| Param | Original file | Final file |
|---|---|---|
| Filename | modeM0/AS1G05_243T01_9000000682cztM0_level2_bc.evt | modeM0/AS1G05_243T01_9000000682cztM0_level2_quad_clean.evt |
| Size (bytes) | 368,976,960 | 49,014,720 |
| Size | 351.9 MB | 46.7 MB |
| Events in quadrant A | 1,102,717 | 297,229 |
| Events in quadrant B | 1,112,585 | 300,560 |
| Events in quadrant C | 1,057,378 | 300,308 |
| Events in quadrant D | 7,574,808 | 254,053 |
| Mode M0 | |||
|---|---|---|---|
| Quadrant | BADHDUFLAG | Total packets | Discarded packets |
| A | 0 | 10781 | 0 |
| B | 0 | 10412 | 0 |
| C | 0 | 10134 | 0 |
| D | 0 | 29638 | 0 |
| Mode M9 | |||
|---|---|---|---|
| Quadrant | BADHDUFLAG | Total packets | Discarded packets |
| A | 0 | 10 | 0 |
| B | 0 | 10 | 0 |
| C | 0 | 10 | 0 |
| D | 0 | 10 | 0 |
| Mode SS | |||
|---|---|---|---|
| Quadrant | BADHDUFLAG | Total packets | Discarded packets |
| A | 0 | 98 | 0 |
| B | 0 | 98 | 0 |
| C | 0 | 98 | 0 |
| D | 0 | 98 | 0 |
| Quadrant | Total seconds | Saturated seconds | Saturation percentage |
|---|---|---|---|
| A | 4713 | 213 | 4.519414% |
| B | 4712 | 89 | 1.888795% |
| C | 4713 | 54 | 1.145767% |
| D | 4712 | 1338 | 28.395586% |
Noise dominated data is calculated using 1-second bins in cleaned event files. If a bin has >2000 counts, and if more than 50% of those come from <1% of pixels, then it is considered to be noise-dominated and hence unusable.
| Quadrant | # 1 sec bins | Bins with >0 counts | Bins with >2000 counts | High rate bins dominated by noise | Noise dominated (total time) | Noise dominated (detector-on time) | Marked lightcurve |
|---|---|---|---|---|---|---|---|
| A | 5788 | 4713 | 1 | 1 | 0.02% | 0.02% | 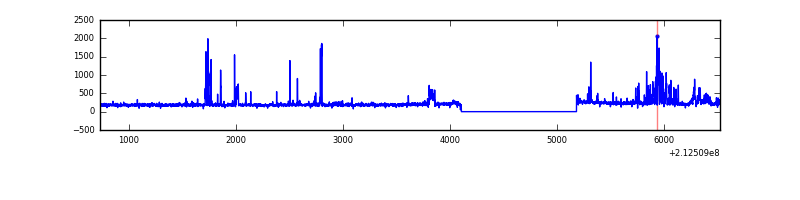 |
| B | 5787 | 4711 | 5 | 5 | 0.09% | 0.11% | 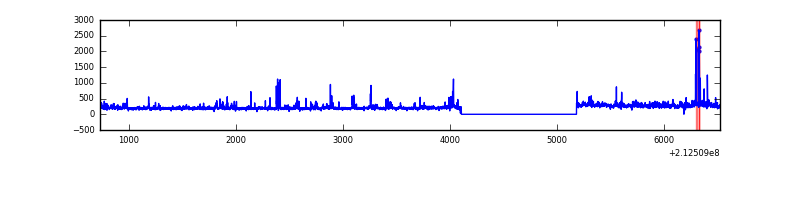 |
| C | 5788 | 4712 | 0 | 0 | 0.00% | 0.00% |  |
| D | 5788 | 4712 | 101 | 101 | 1.74% | 2.14% |  |
Top three noisy pixels from each quadrant. If the there are fewer than three noisy pixels in the level2.evt file, extra rows are filled as -1
| Pixel properties | Quadrant properties | ||||||
|---|---|---|---|---|---|---|---|
| Quadrant | DetID | PixID | Counts | Sigma | Mean | Median | Sigma |
| A | 14 | 111 | 104253 | 1951.69 | 230 | 224 | 53.3 |
| A | 0 | 50 | 54069 | 1010.19 | 230 | 224 | 53.3 |
| A | 15 | 174 | 43608 | 813.93 | 230 | 224 | 53.3 |
| B | 4 | 80 | 77919 | 1645.71 | 233 | 227 | 47.2 |
| B | 15 | 204 | 62861 | 1326.74 | 233 | 227 | 47.2 |
| B | 10 | 245 | 23032 | 483.07 | 233 | 227 | 47.2 |
| C | 1 | 16 | 150214 | 2822.09 | 230 | 226 | 53.1 |
| C | 12 | 4 | 3322 | 58.25 | 230 | 226 | 53.1 |
| C | 14 | 67 | 2767 | 47.81 | 230 | 226 | 53.1 |
| D | 7 | 237 | 6575533 | 123579.27 | 214 | 205 | 53.2 |
| D | 4 | 95 | 51057 | 955.73 | 214 | 205 | 53.2 |
| D | 11 | 18 | 30222 | 564.15 | 214 | 205 | 53.2 |
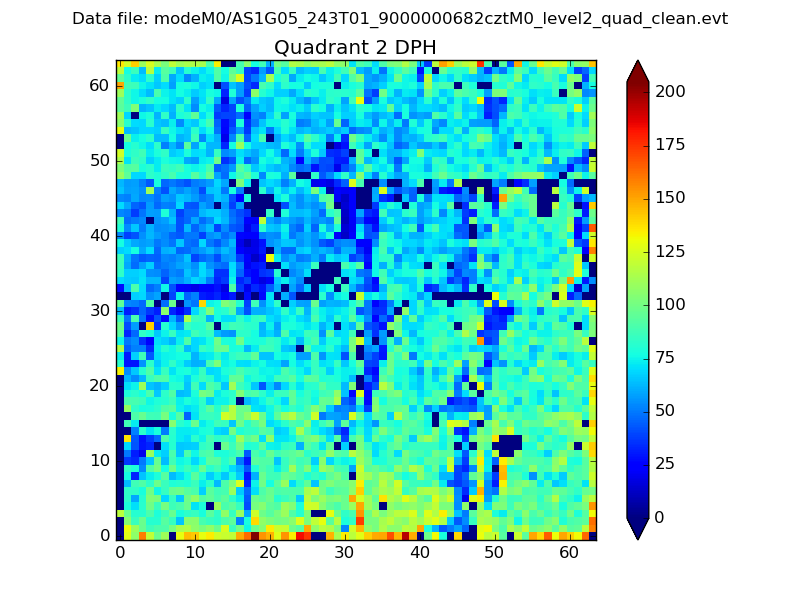
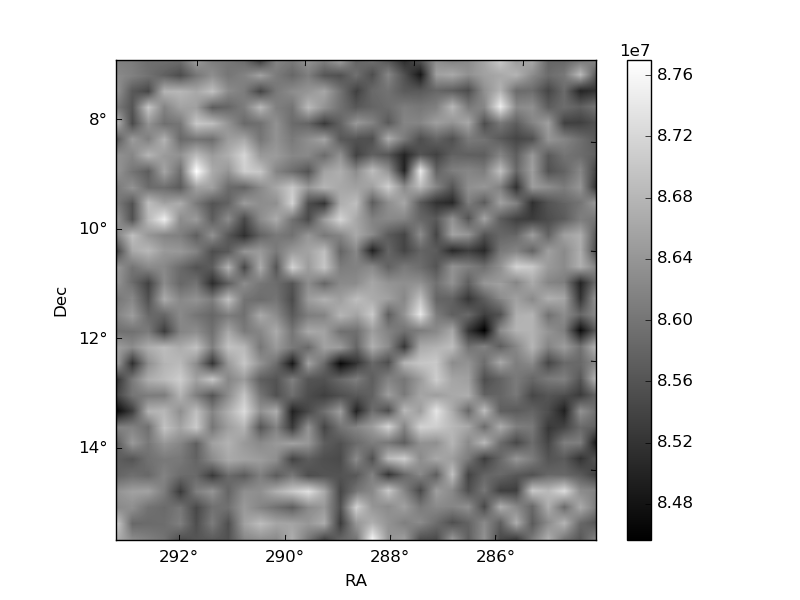
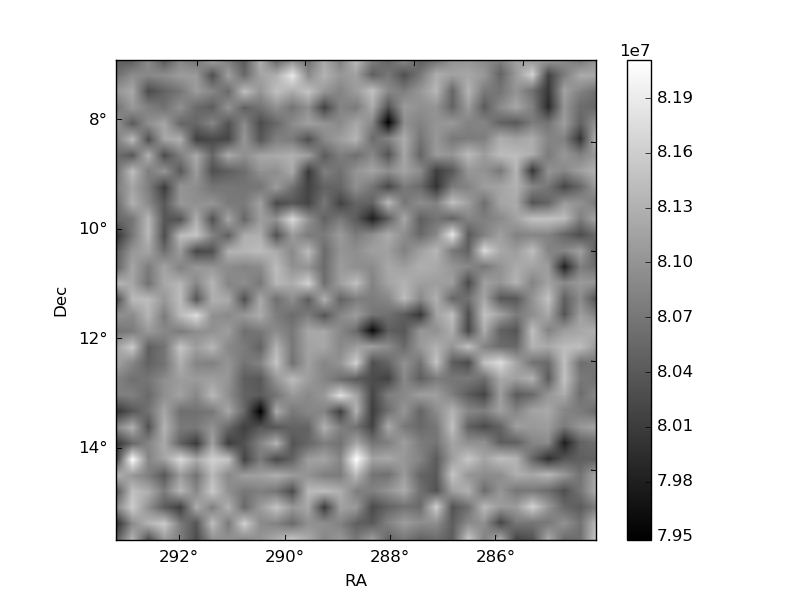
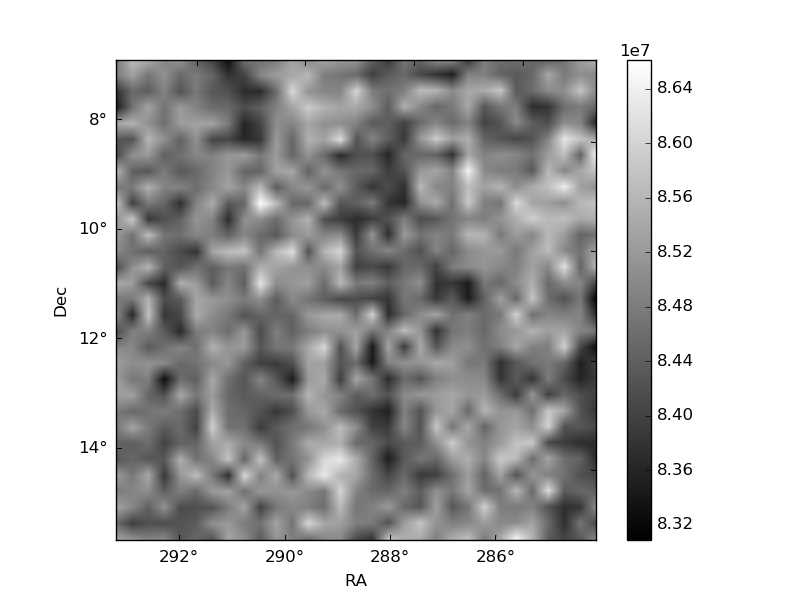
Histogram calculated using DETX and DETY for each event in the final _common_clean file
| Quadrant A | 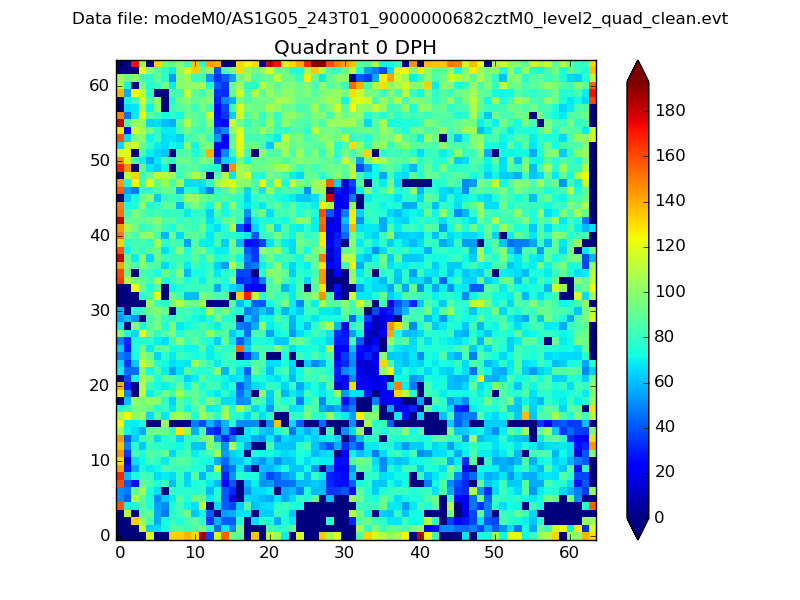 |
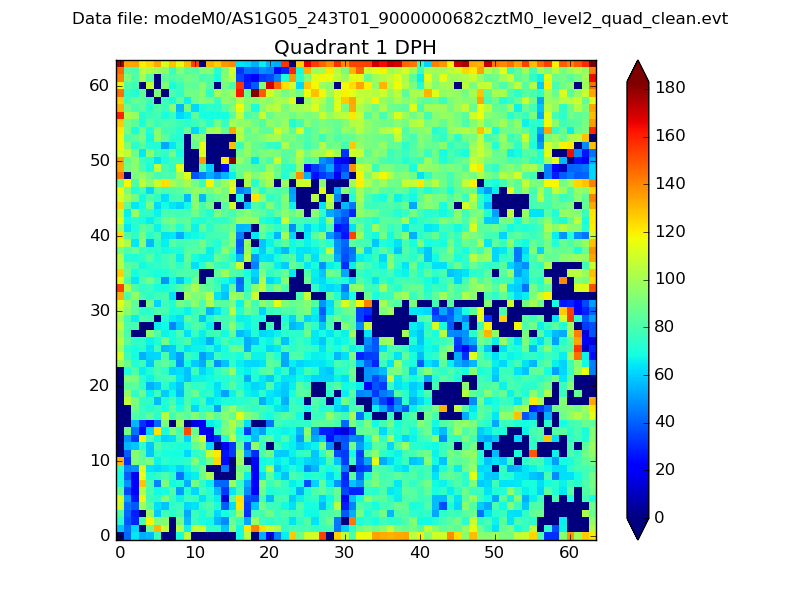 |
Quadrant B |
|---|---|---|---|
| Quadrant D | 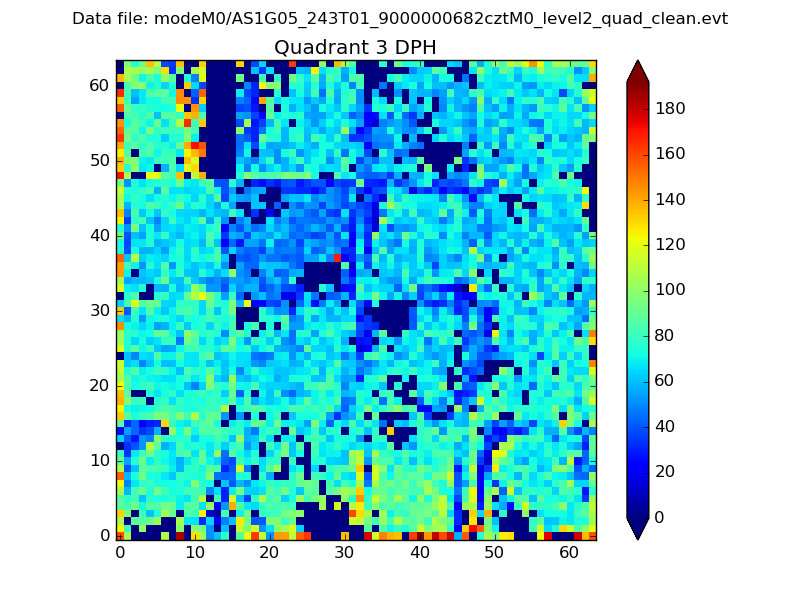 |
 |
Quadrant C |
| Plot type | Count rate plots | Images |
|---|---|---|
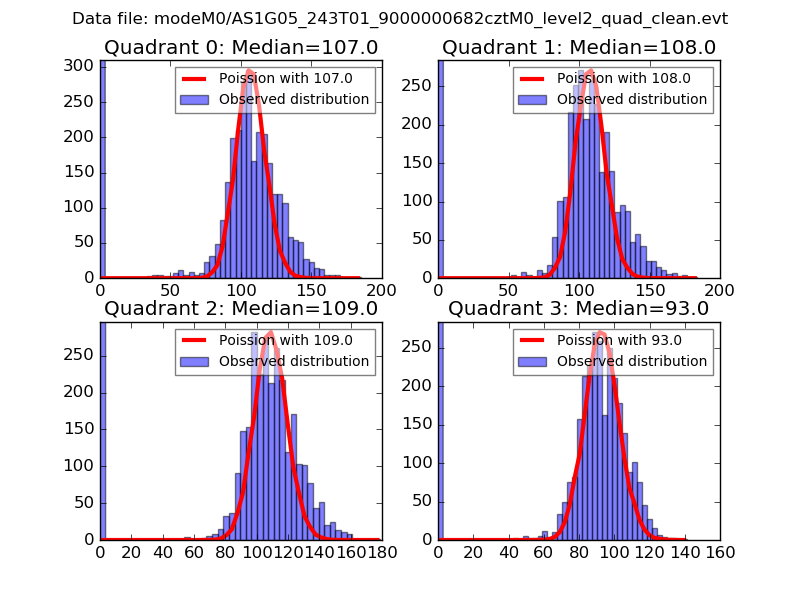
| Comparison with Poisson distribution Blue bars denote a histogram of data divided into 1 sec bins. Red curve is a Poisson curve with rate = median count rate of data. |
 |
 |
| Quadrant-wise count rates Data is divided into 100 sec bins |
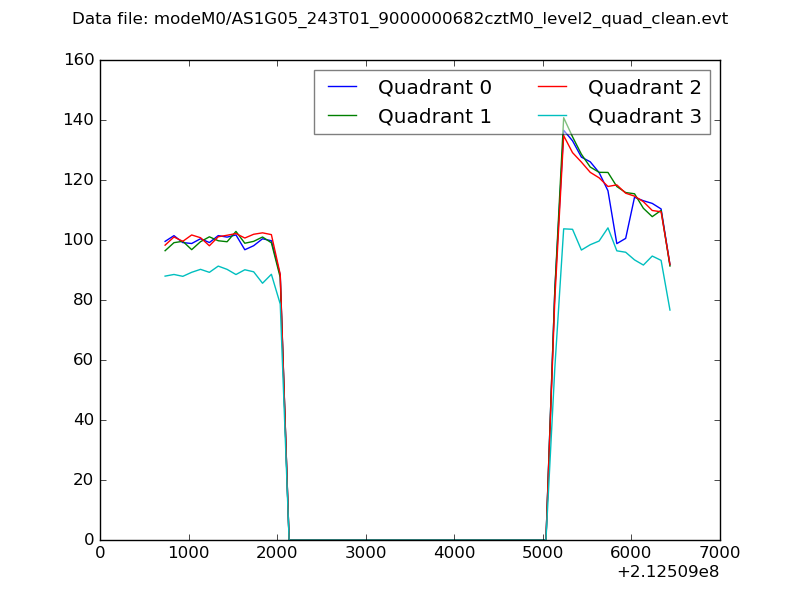 |
|
| Module-wise count rates for Quadrant A Data is divided into 100 sec bins |
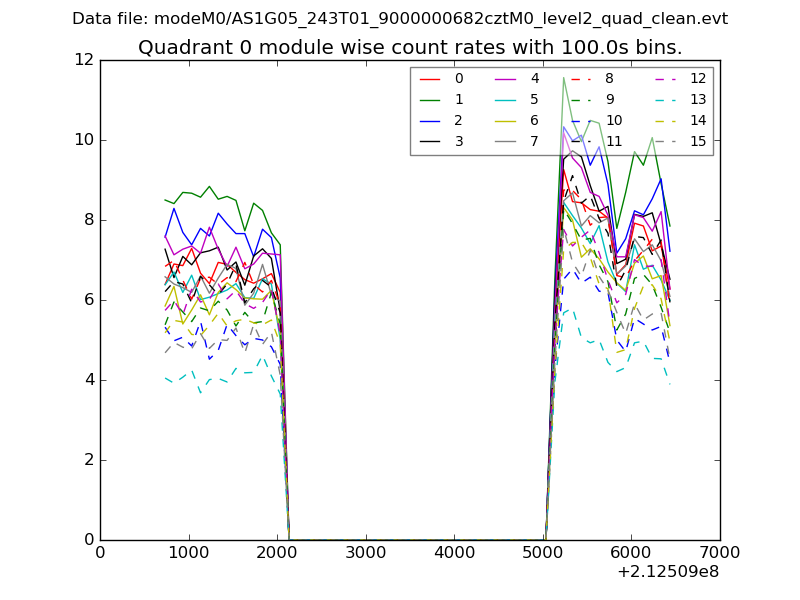 |
 |
| Module-wise count rates for Quadrant B Data is divided into 100 sec bins |
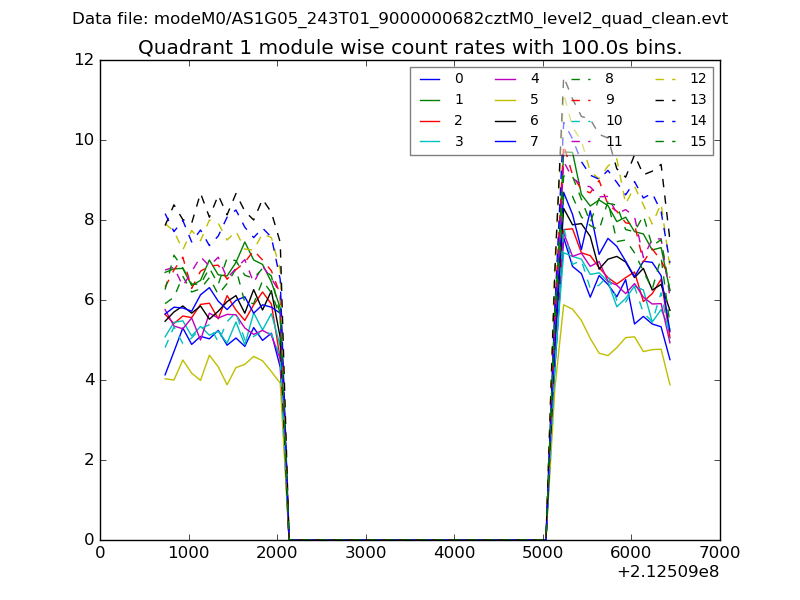 |
 |
| Module-wise count rates for Quadrant C Data is divided into 100 sec bins |
 |
 |
| Module-wise count rates for Quadrant D Data is divided into 100 sec bins |
 |
 |
| Parameter | Plot |
|---|---|
| CZT HV Monitor | 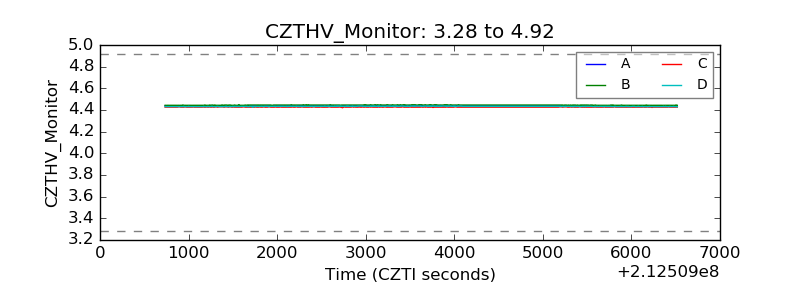 |
| D_VDD | 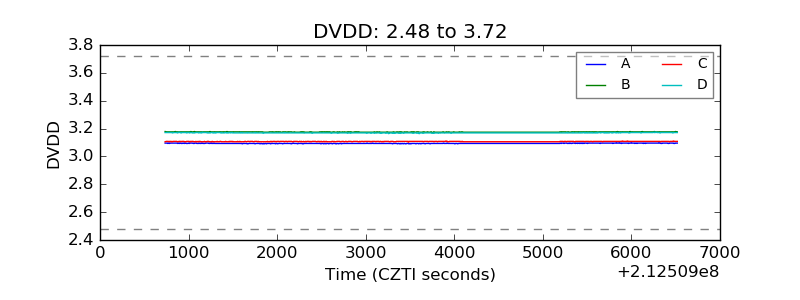 |
| Temperature 1 | 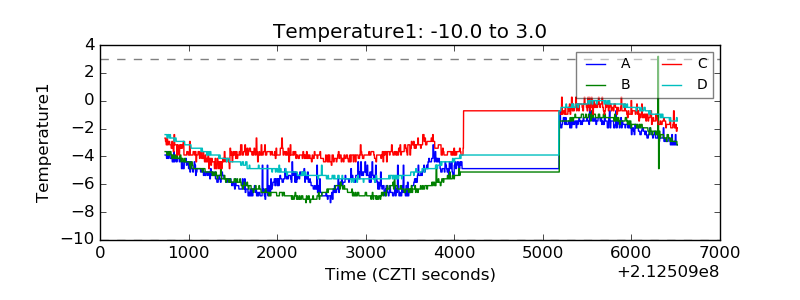 |
| Veto HV Monitor | 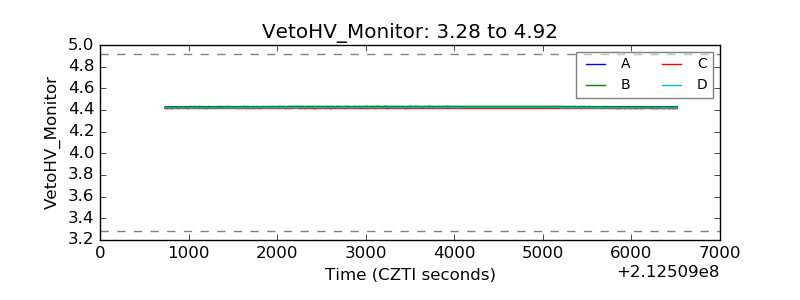 |
| Veto LLD | 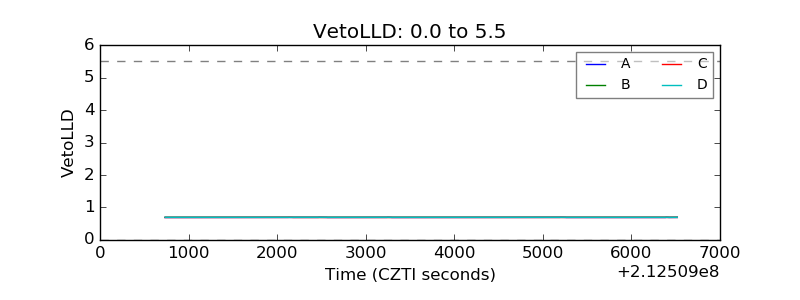 |
| Alpha Counter |  |
| _CPM_Rate | 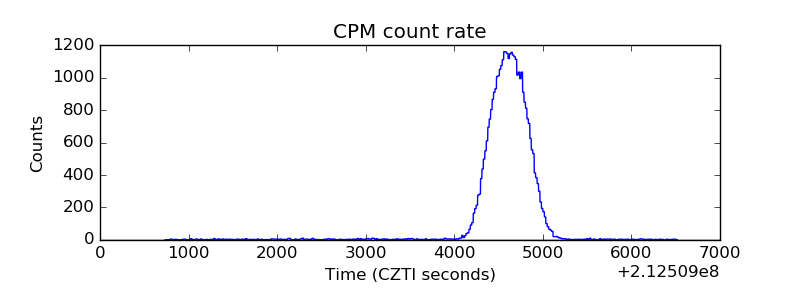 |
| CZT Counter | 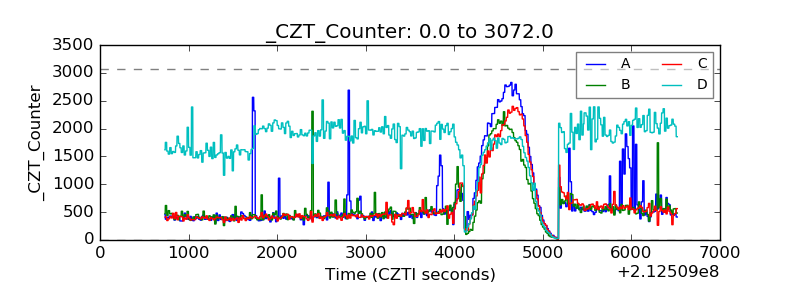 |
| +2.5 Volts monitor |  |
| +5 Volts monitor | 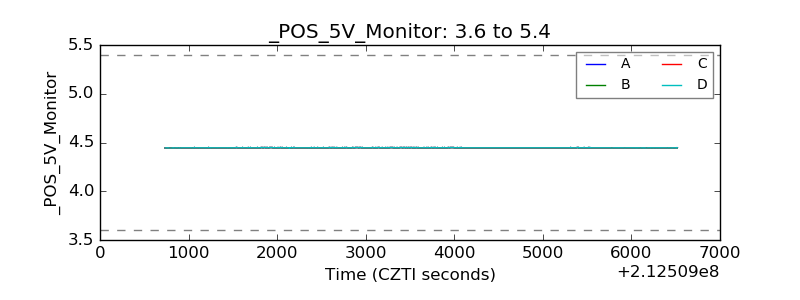 |
| _ROLL_ROT | 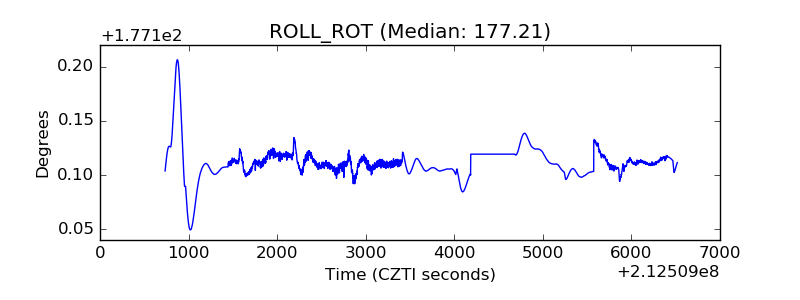 |
| _Roll_DEC | 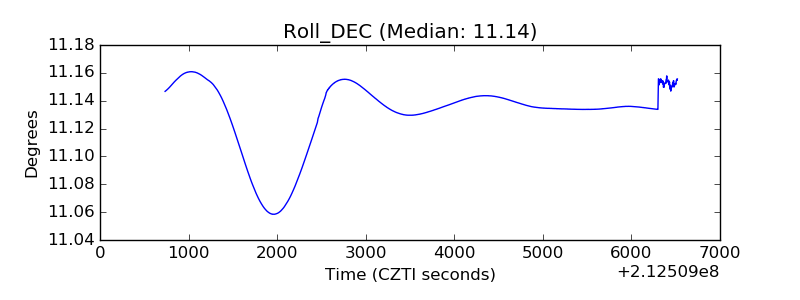 |
| _Roll_RA | 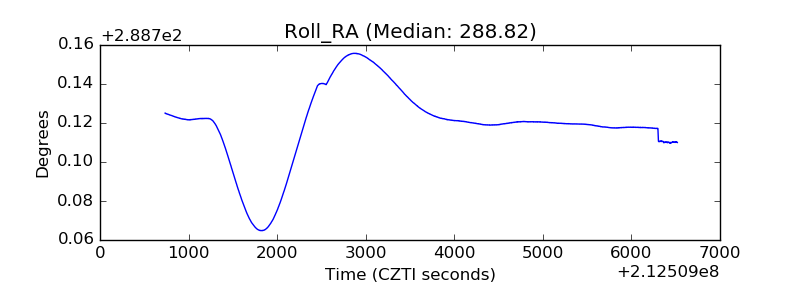 |
| Veto Counter | 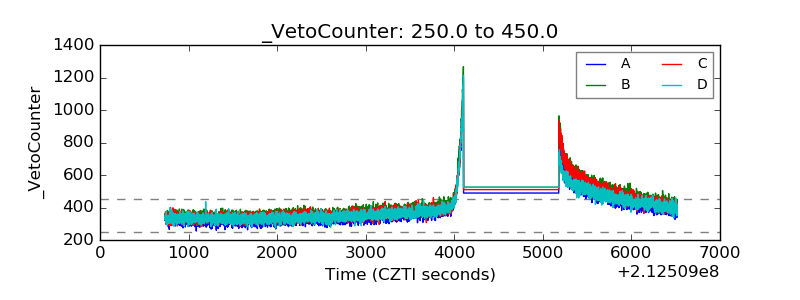 |