| Param | Original file | Final file |
|---|---|---|
| Filename | modeM0/AS1G06_145T01_9000000816cztM0_level2.evt | modeM0/AS1G06_145T01_9000000816cztM0_level2_quad_clean.evt |
| Size (bytes) | 2,267,784,000 | 362,911,680 |
| Size | 2.1 GB | 346.1 MB |
| Events in quadrant A | 16,968,863 | 2,254,886 |
| Events in quadrant B | 16,181,302 | 2,287,836 |
| Events in quadrant C | 13,081,473 | 2,281,271 |
| Events in quadrant D | 20,415,935 | 2,096,232 |
| Mode SS | |||
|---|---|---|---|
| Quadrant | BADHDUFLAG | Total packets | Discarded packets |
| A | 0 | 610 | 0 |
| B | 0 | 610 | 0 |
| C | 0 | 610 | 0 |
| D | 0 | 610 | 0 |
| Mode M9 | |||
|---|---|---|---|
| Quadrant | BADHDUFLAG | Total packets | Discarded packets |
| A | 0 | 24 | 0 |
| B | 0 | 24 | 0 |
| C | 0 | 24 | 0 |
| D | 0 | 24 | 0 |
| Mode M0 | |||
|---|---|---|---|
| Quadrant | BADHDUFLAG | Total packets | Discarded packets |
| A | 0 | 70985 | 0 |
| B | 0 | 68951 | 0 |
| C | 0 | 61243 | 0 |
| D | 0 | 81547 | 0 |
| Quadrant | Total seconds | Saturated seconds | Saturation percentage |
|---|---|---|---|
| A | 30148 | 407 | 1.350007% |
| B | 30148 | 640 | 2.122861% |
| C | 30148 | 70 | 0.232188% |
| D | 30148 | 1395 | 4.627173% |
Noise dominated data is calculated using 1-second bins in cleaned event files. If a bin has >2000 counts, and if more than 50% of those come from <1% of pixels, then it is considered to be noise-dominated and hence unusable.
| Quadrant | # 1 sec bins | Bins with >0 counts | Bins with >2000 counts | High rate bins dominated by noise | Noise dominated (total time) | Noise dominated (detector-on time) | Marked lightcurve |
|---|---|---|---|---|---|---|---|
| A | 32298 | 30153 | 54 | 54 | 0.17% | 0.18% | 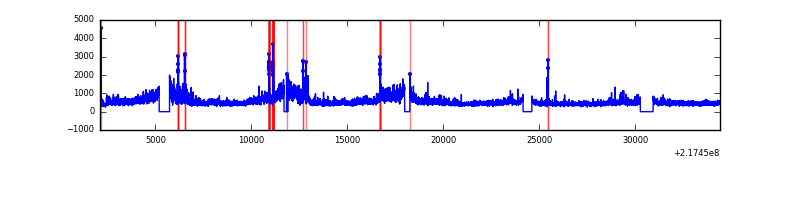 |
| B | 32298 | 30152 | 262 | 262 | 0.81% | 0.87% | 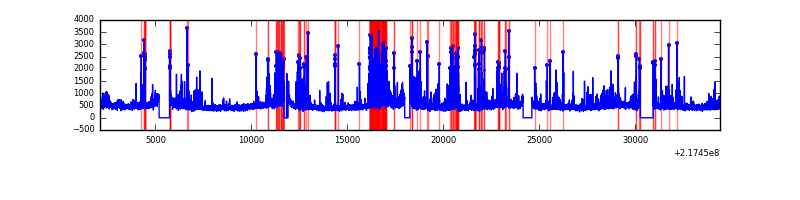 |
| C | 32298 | 30154 | 1 | 1 | 0.00% | 0.00% | 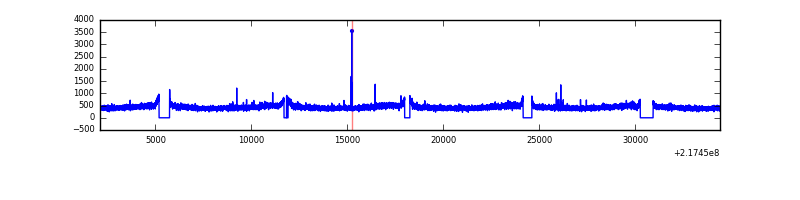 |
| D | 32298 | 30153 | 1299 | 1299 | 4.02% | 4.31% | 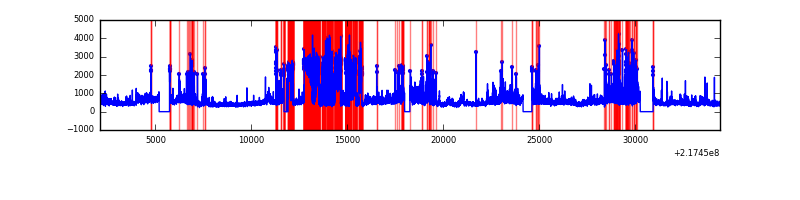 |
Top three noisy pixels from each quadrant. If the there are fewer than three noisy pixels in the level2.evt file, extra rows are filled as -1
| Pixel properties | Quadrant properties | ||||||
|---|---|---|---|---|---|---|---|
| Quadrant | DetID | PixID | Counts | Sigma | Mean | Median | Sigma |
| A | 13 | 34 | 3069028 | 4377.51 | 3411 | 3332 | 700.3 |
| A | 8 | 15 | 356033 | 503.62 | 3411 | 3332 | 700.3 |
| A | 15 | 236 | 131038 | 182.35 | 3411 | 3332 | 700.3 |
| B | 3 | 64 | 1757693 | 2670.67 | 3440 | 3352 | 656.9 |
| B | 0 | 219 | 381351 | 575.44 | 3440 | 3352 | 656.9 |
| B | 0 | 187 | 204451 | 306.14 | 3440 | 3352 | 656.9 |
| C | 9 | 54 | 27534 | 31.58 | 3339 | 3352 | 765.7 |
| C | 13 | 61 | 26194 | 29.83 | 3339 | 3352 | 765.7 |
| C | 1 | 16 | 21188 | 23.29 | 3339 | 3352 | 765.7 |
| D | 12 | 221 | 4448927 | 5582.54 | 3256 | 3145 | 796.4 |
| D | 2 | 63 | 1589522 | 1992.0 | 3256 | 3145 | 796.4 |
| D | 2 | 136 | 1490114 | 1867.18 | 3256 | 3145 | 796.4 |
Histogram calculated using DETX and DETY for each event in the final _common_clean file
| Quadrant A | 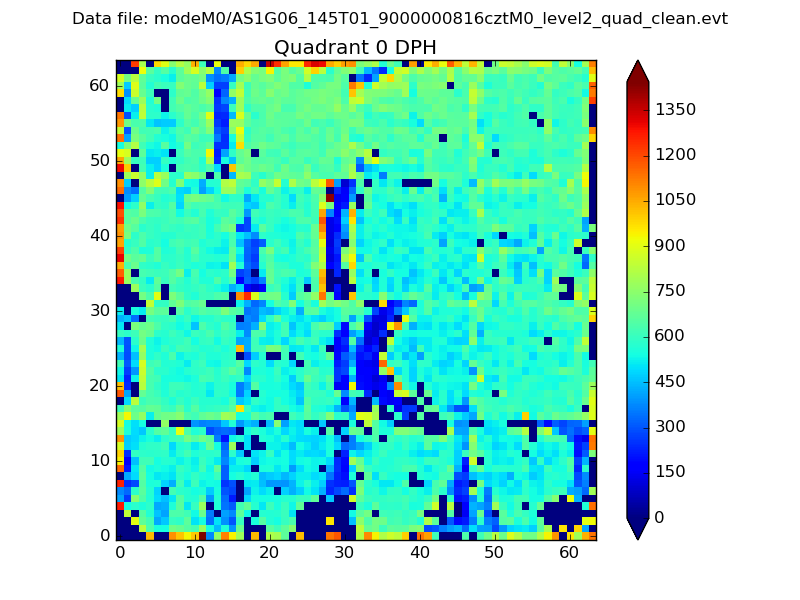 |
 |
Quadrant B |
|---|---|---|---|
| Quadrant D |  |
 |
Quadrant C |
| Plot type | Count rate plots | Images |
|---|---|---|
| Comparison with Poisson distribution Blue bars denote a histogram of data divided into 1 sec bins. Red curve is a Poisson curve with rate = median count rate of data. |
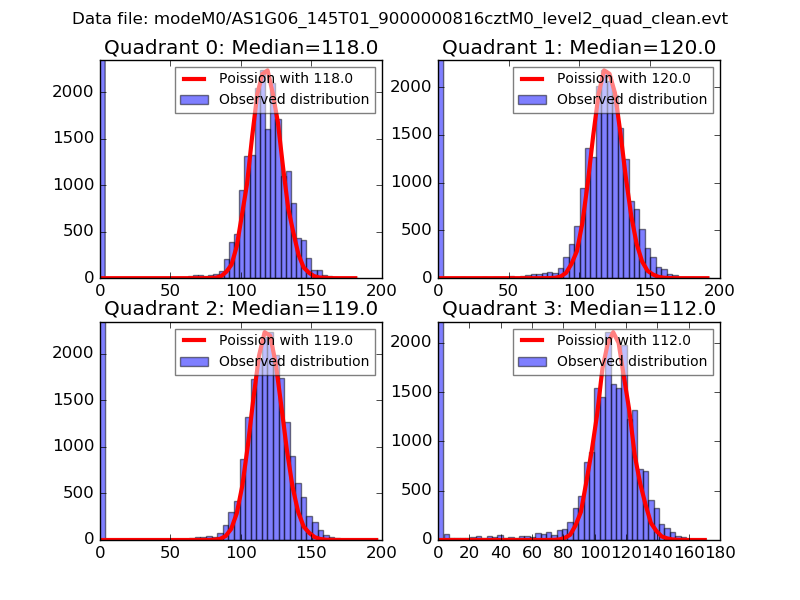 |
 |
| Quadrant-wise count rates Data is divided into 100 sec bins |
 |
|
| Module-wise count rates for Quadrant A Data is divided into 100 sec bins |
 |
 |
| Module-wise count rates for Quadrant B Data is divided into 100 sec bins |
 |
 |
| Module-wise count rates for Quadrant C Data is divided into 100 sec bins |
 |
 |
| Module-wise count rates for Quadrant D Data is divided into 100 sec bins |
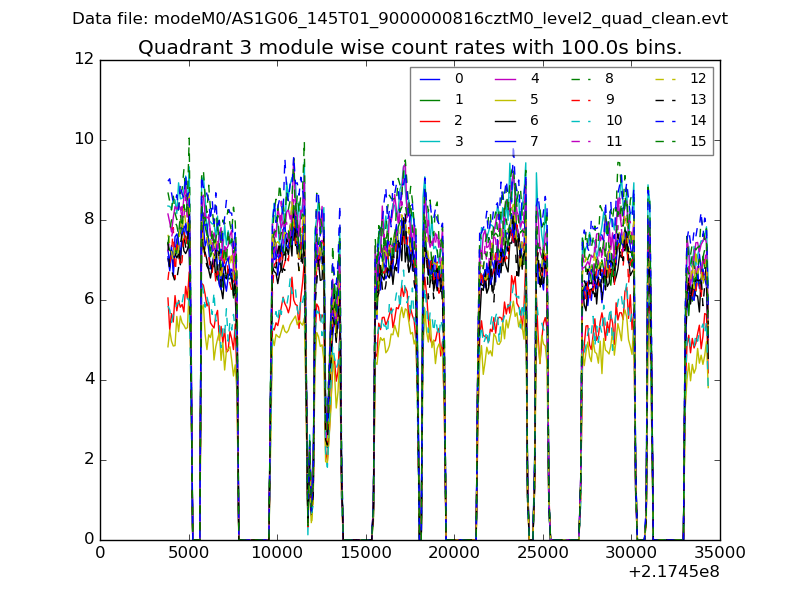 |
 |
| Parameter | Plot |
|---|---|
| CZT HV Monitor | 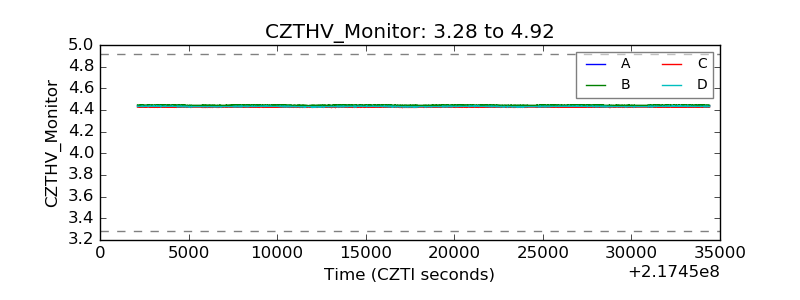 |
| D_VDD | 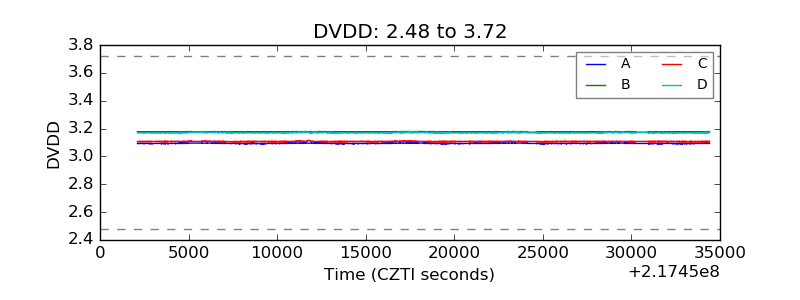 |
| Temperature 1 |  |
| Veto HV Monitor | 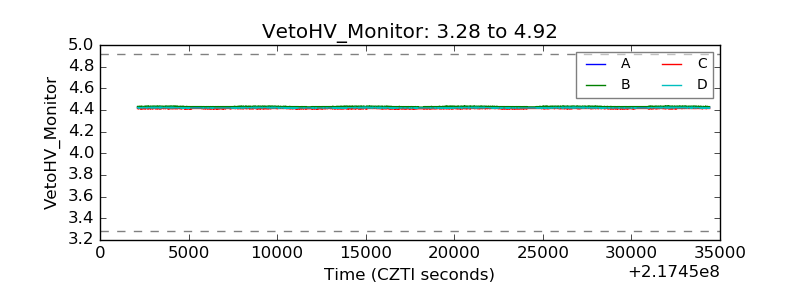 |
| Veto LLD |  |
| Alpha Counter |  |
| _CPM_Rate | 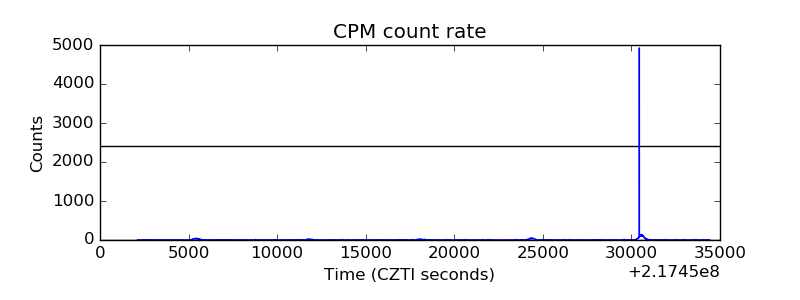 |
| CZT Counter |  |
| +2.5 Volts monitor |  |
| +5 Volts monitor |  |
| _ROLL_ROT | 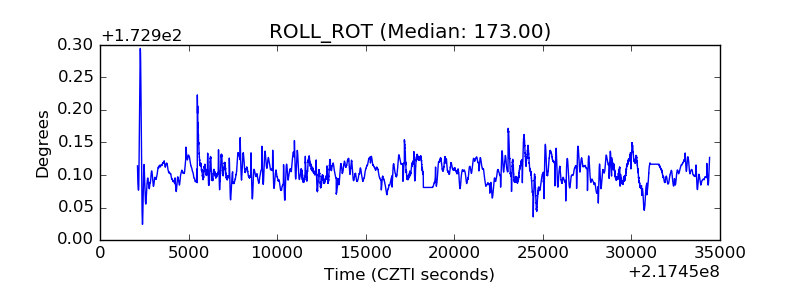 |
| _Roll_DEC |  |
| _Roll_RA |  |
| Veto Counter | 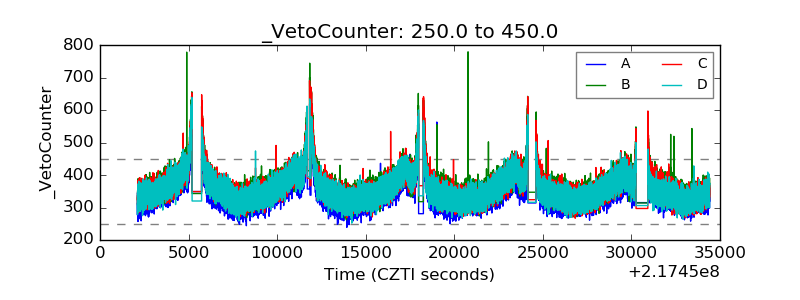 |