| Param | Original file | Final file |
|---|---|---|
| Filename | modeM0/AS1G06_067T01_9000000872cztM0_level2.evt | modeM0/AS1G06_067T01_9000000872cztM0_level2_quad_clean.evt |
| Size (bytes) | 1,111,855,680 | 212,639,040 |
| Size | 1.0 GB | 202.8 MB |
| Events in quadrant A | 8,026,161 | 1,347,111 |
| Events in quadrant B | 8,009,023 | 1,342,232 |
| Events in quadrant C | 7,438,429 | 1,323,693 |
| Events in quadrant D | 9,080,668 | 1,287,813 |
| Mode M0 | |||
|---|---|---|---|
| Quadrant | BADHDUFLAG | Total packets | Discarded packets |
| A | 0 | 35303 | 0 |
| B | 0 | 35171 | 0 |
| C | 0 | 34519 | 0 |
| D | 0 | 38541 | 0 |
| Mode M9 | |||
|---|---|---|---|
| Quadrant | BADHDUFLAG | Total packets | Discarded packets |
| A | 0 | 5 | 0 |
| B | 0 | 5 | 0 |
| C | 0 | 5 | 0 |
| D | 0 | 5 | 0 |
| Mode SS | |||
|---|---|---|---|
| Quadrant | BADHDUFLAG | Total packets | Discarded packets |
| A | 0 | 332 | 0 |
| B | 0 | 332 | 0 |
| C | 0 | 332 | 0 |
| D | 0 | 332 | 0 |
| Quadrant | Total seconds | Saturated seconds | Saturation percentage |
|---|---|---|---|
| A | 16521 | 609 | 3.686218% |
| B | 16521 | 583 | 3.528842% |
| C | 16521 | 420 | 2.542219% |
| D | 16521 | 614 | 3.716482% |
Noise dominated data is calculated using 1-second bins in cleaned event files. If a bin has >2000 counts, and if more than 50% of those come from <1% of pixels, then it is considered to be noise-dominated and hence unusable.
| Quadrant | # 1 sec bins | Bins with >0 counts | Bins with >2000 counts | High rate bins dominated by noise | Noise dominated (total time) | Noise dominated (detector-on time) | Marked lightcurve |
|---|---|---|---|---|---|---|---|
| A | 16941 | 16523 | 54 | 54 | 0.32% | 0.33% | 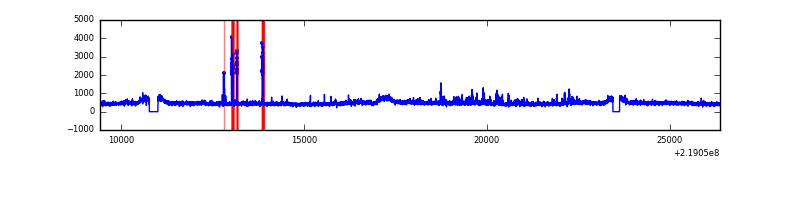 |
| B | 16941 | 16523 | 22 | 22 | 0.13% | 0.13% | 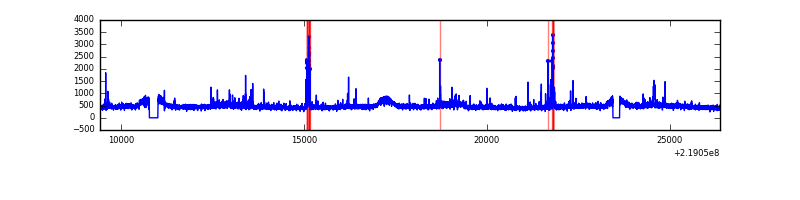 |
| C | 16941 | 16523 | 0 | 0 | 0.00% | 0.00% |  |
| D | 16941 | 16523 | 169 | 169 | 1.00% | 1.02% | 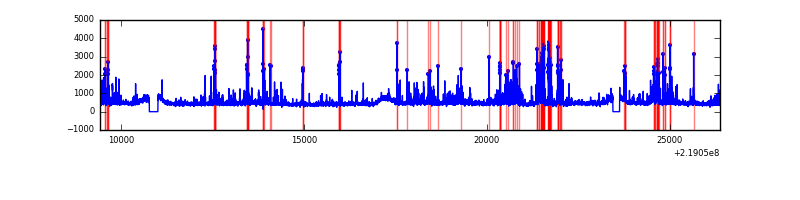 |
Top three noisy pixels from each quadrant. If the there are fewer than three noisy pixels in the level2.evt file, extra rows are filled as -1
| Pixel properties | Quadrant properties | ||||||
|---|---|---|---|---|---|---|---|
| Quadrant | DetID | PixID | Counts | Sigma | Mean | Median | Sigma |
| A | 15 | 239 | 207833 | 527.78 | 1924 | 1876 | 390.2 |
| A | 15 | 234 | 206346 | 523.97 | 1924 | 1876 | 390.2 |
| A | 15 | 174 | 152543 | 386.1 | 1924 | 1876 | 390.2 |
| B | 0 | 214 | 115953 | 308.81 | 1932 | 1880 | 369.4 |
| B | 0 | 228 | 88635 | 234.86 | 1932 | 1880 | 369.4 |
| B | 15 | 35 | 77588 | 204.95 | 1932 | 1880 | 369.4 |
| C | 1 | 16 | 148482 | 340.82 | 1859 | 1863 | 430.2 |
| C | 7 | 247 | 21616 | 45.92 | 1859 | 1863 | 430.2 |
| C | 13 | 61 | 14970 | 30.47 | 1859 | 1863 | 430.2 |
| D | 2 | 152 | 1357261 | 2995.15 | 1862 | 1797 | 452.6 |
| D | 2 | 14 | 130313 | 283.98 | 1862 | 1797 | 452.6 |
| D | 8 | 195 | 125158 | 272.59 | 1862 | 1797 | 452.6 |
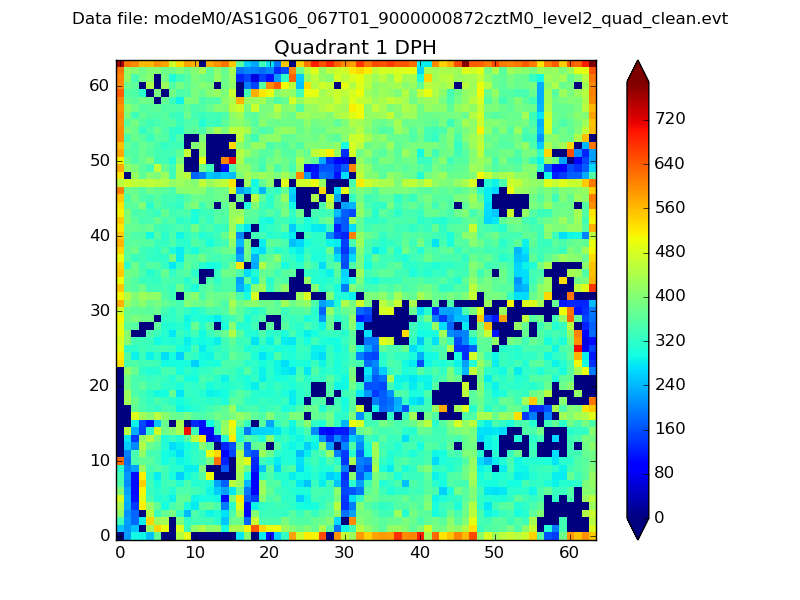
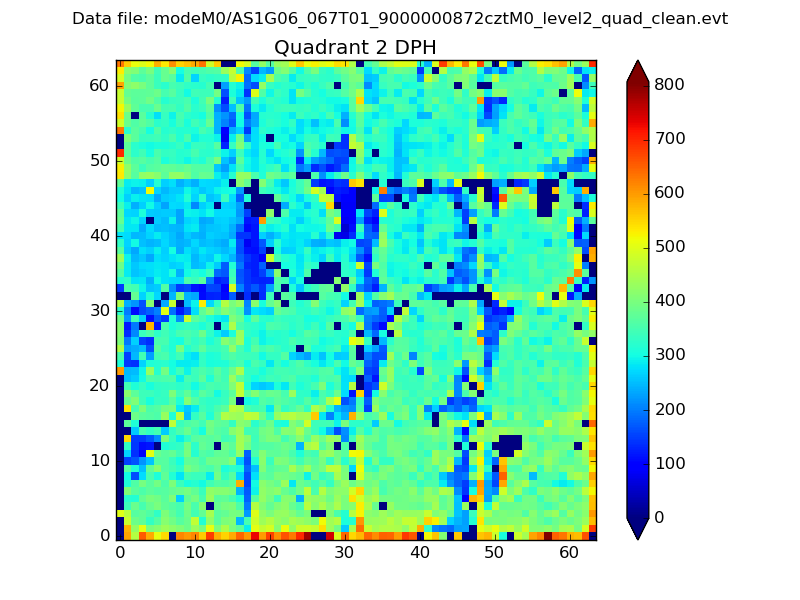
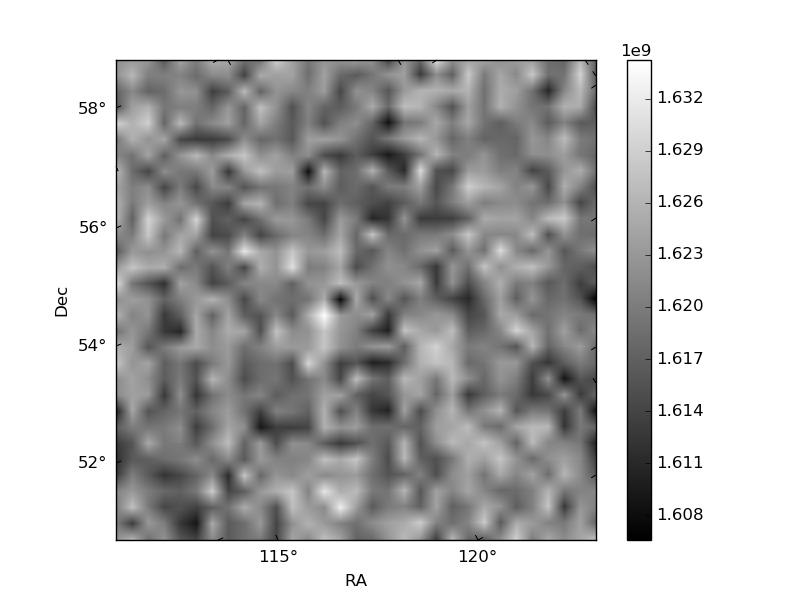
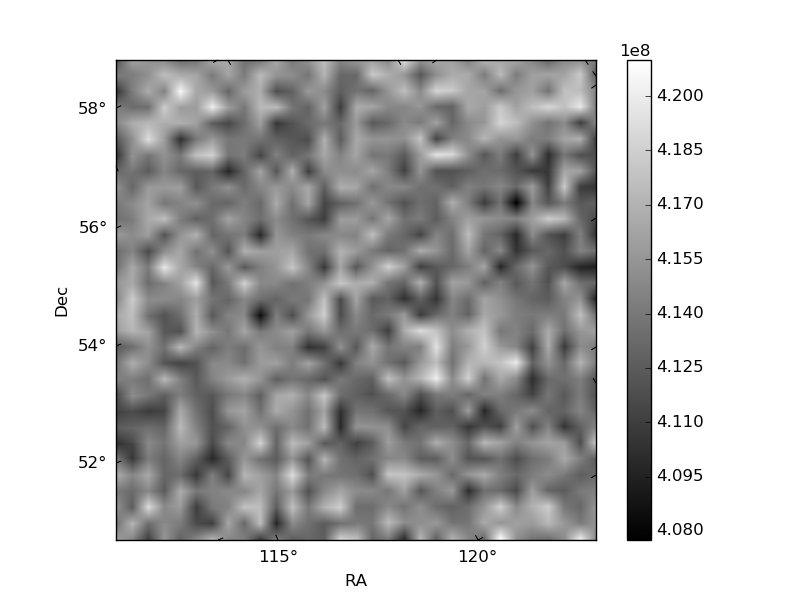
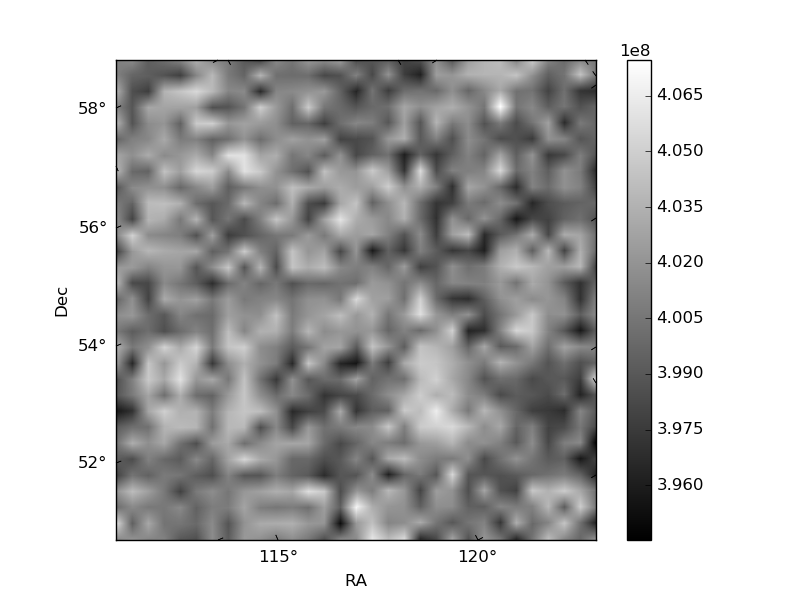
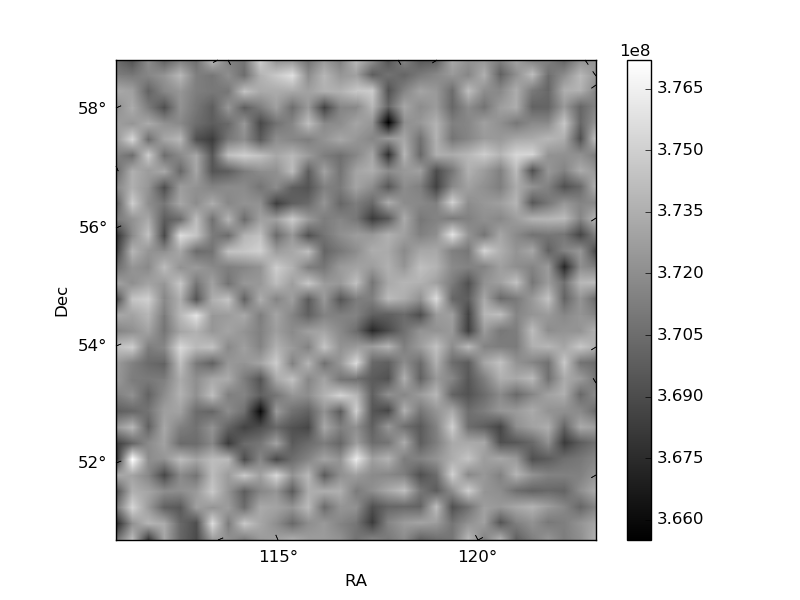
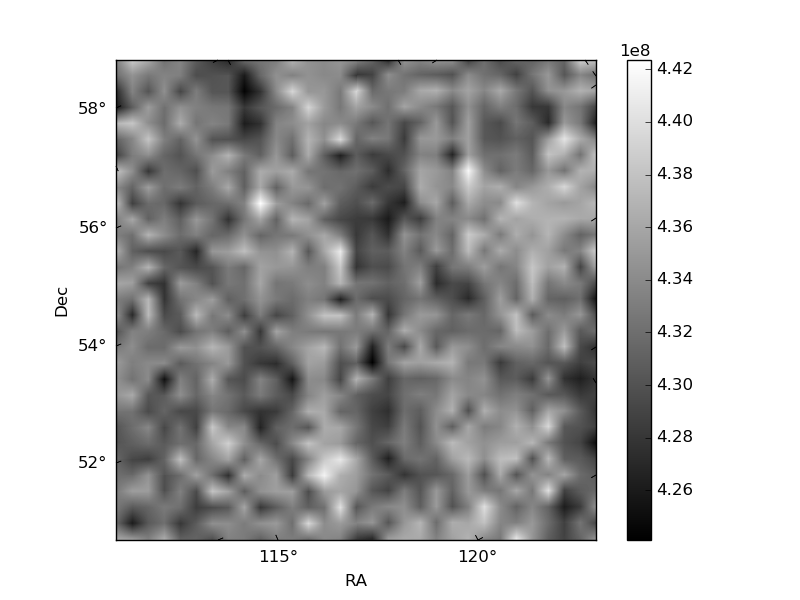
Histogram calculated using DETX and DETY for each event in the final _common_clean file
| Quadrant A | 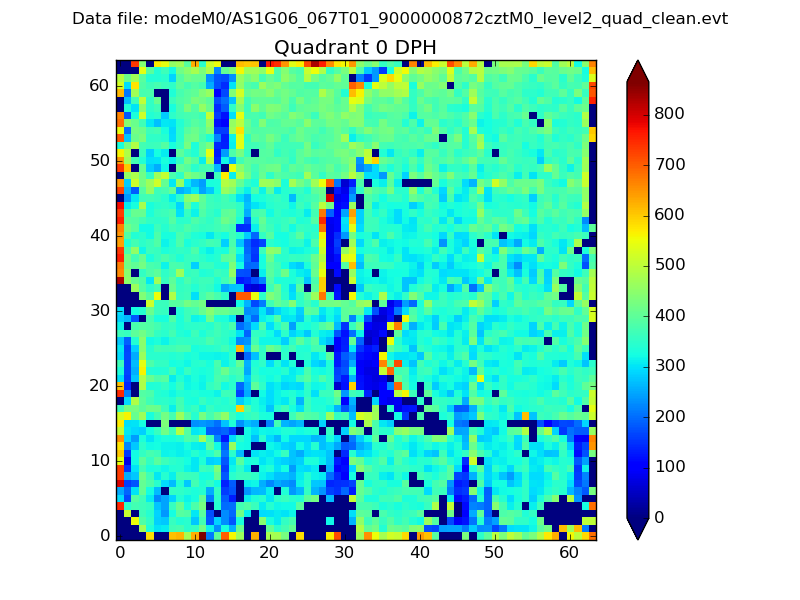 |
 |
Quadrant B |
|---|---|---|---|
| Quadrant D | 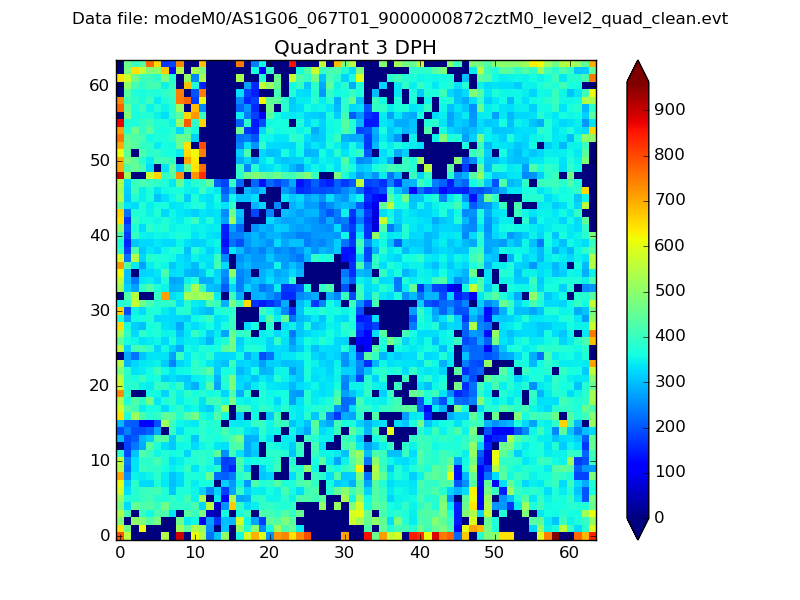 |
 |
Quadrant C |
| Plot type | Count rate plots | Images |
|---|---|---|
| Comparison with Poisson distribution Blue bars denote a histogram of data divided into 1 sec bins. Red curve is a Poisson curve with rate = median count rate of data. |
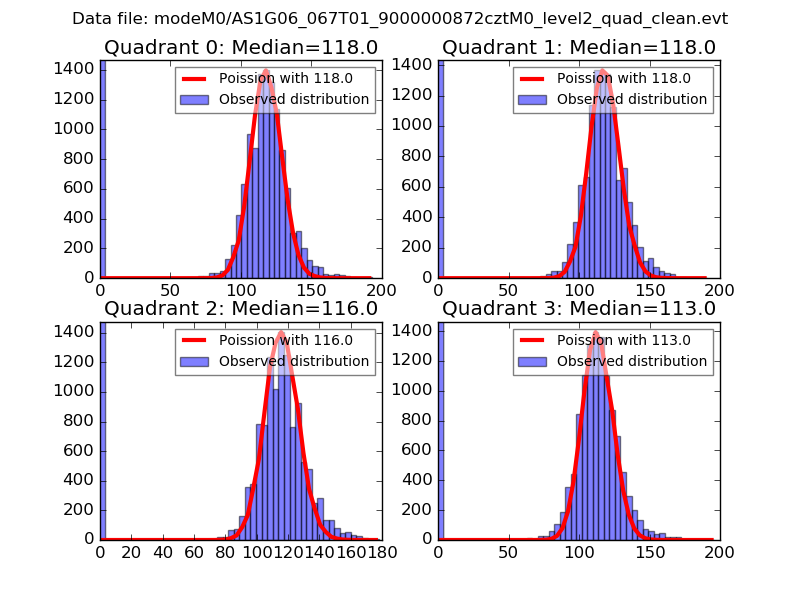 |
 |
| Quadrant-wise count rates Data is divided into 100 sec bins |
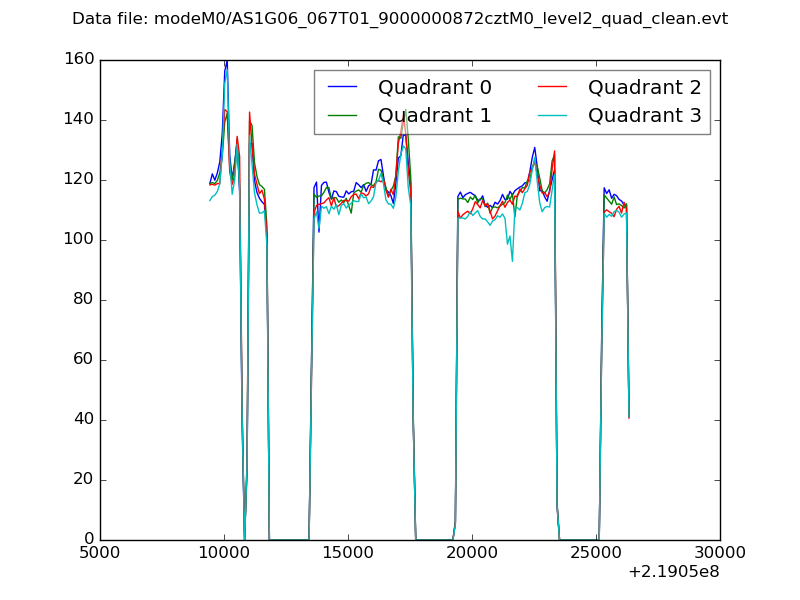 |
|
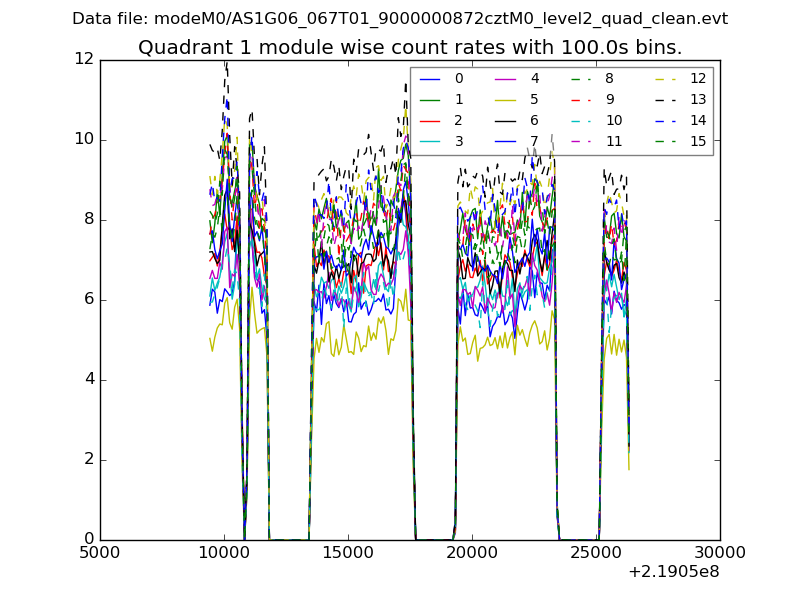
| Module-wise count rates for Quadrant A Data is divided into 100 sec bins |
 |
 |
| Module-wise count rates for Quadrant B Data is divided into 100 sec bins |
 |
 |
| Module-wise count rates for Quadrant C Data is divided into 100 sec bins |
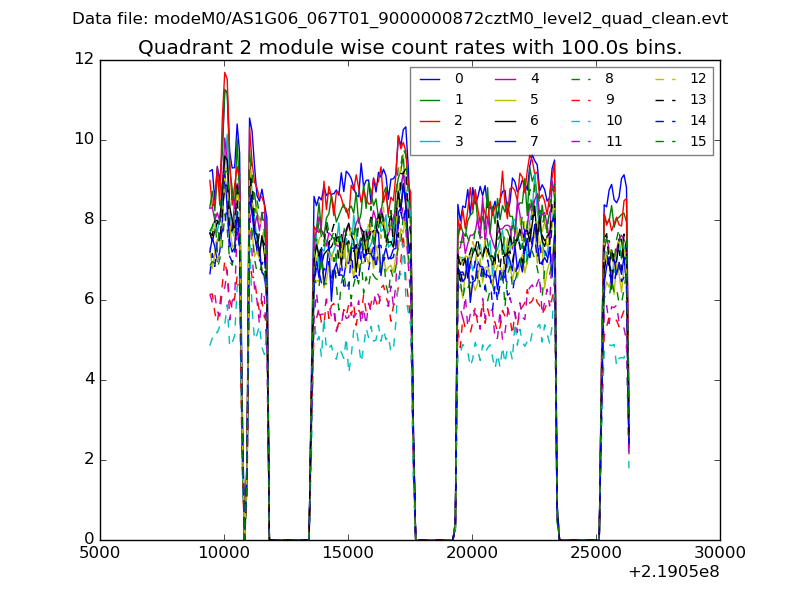 |
 |
| Module-wise count rates for Quadrant D Data is divided into 100 sec bins |
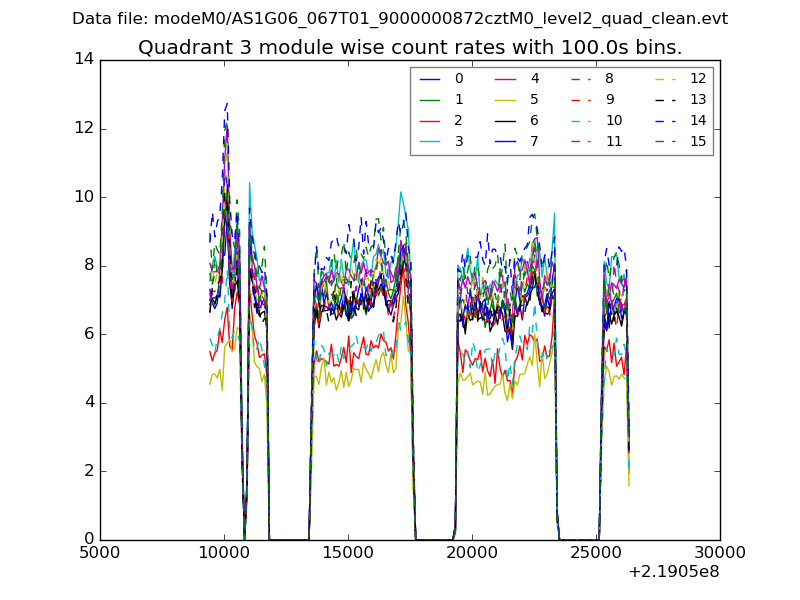 |
 |
| Parameter | Plot |
|---|---|
| CZT HV Monitor | 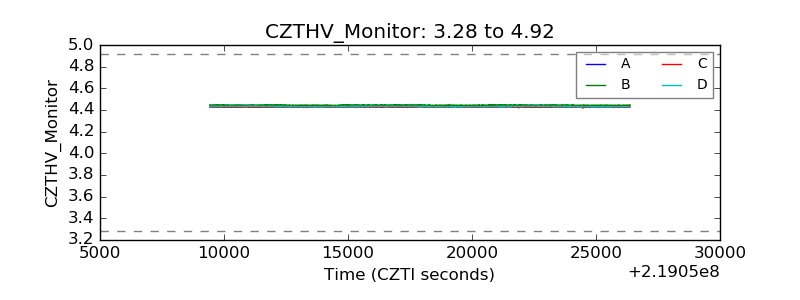 |
| D_VDD | 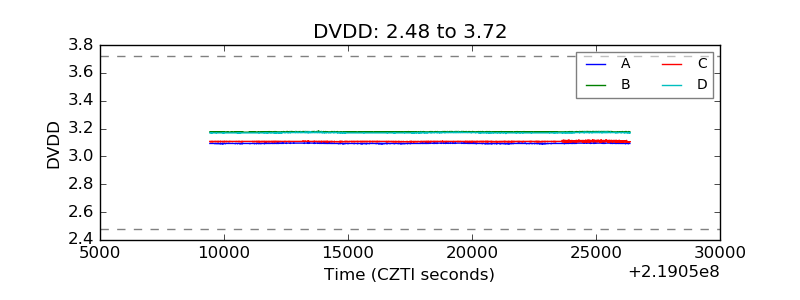 |
| Temperature 1 | 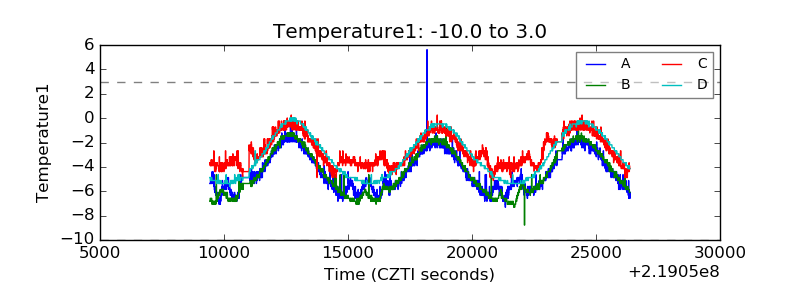 |
| Veto HV Monitor | 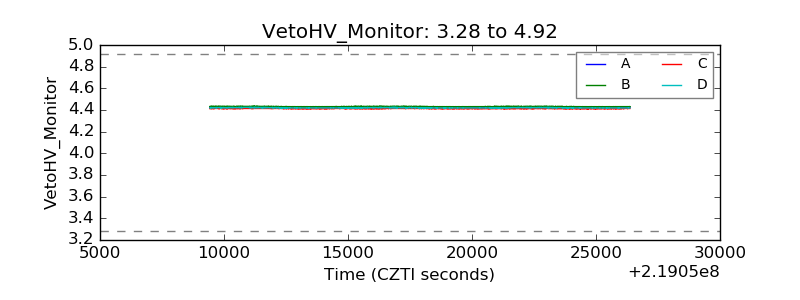 |
| Veto LLD | 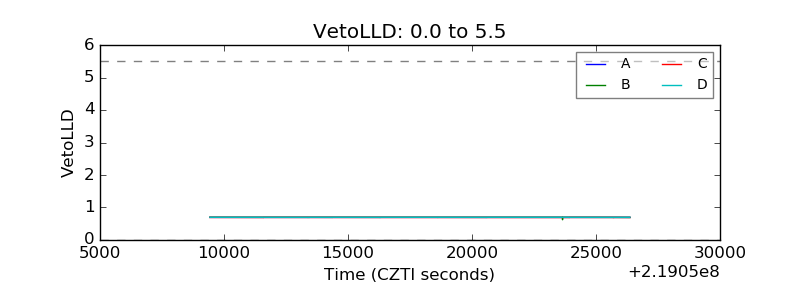 |
| Alpha Counter | 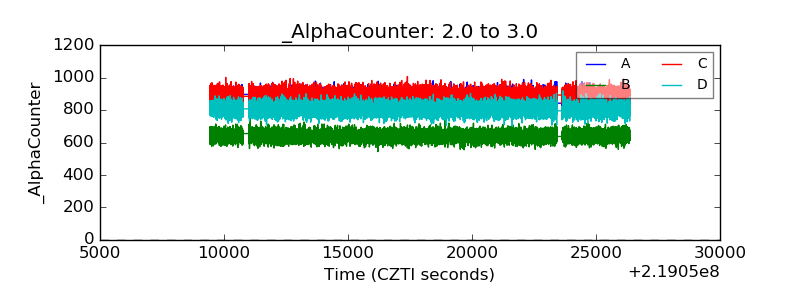 |
| _CPM_Rate | 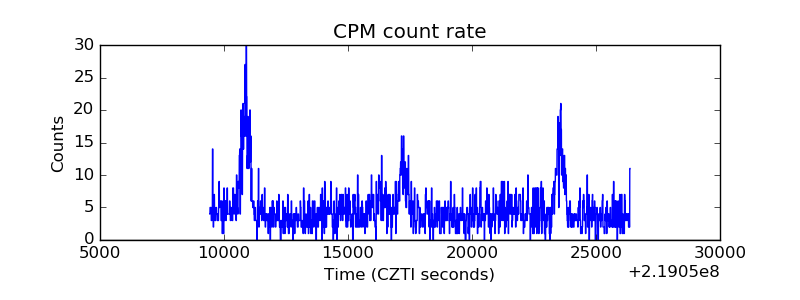 |
| CZT Counter | 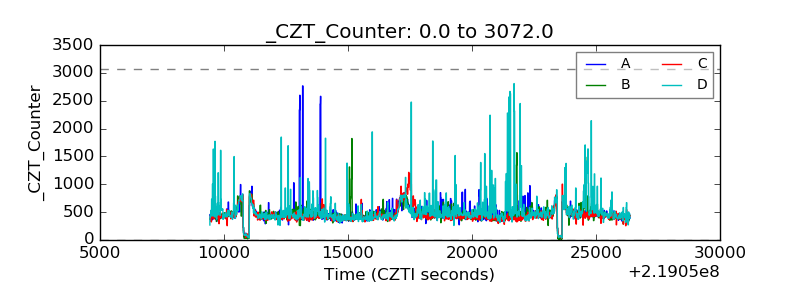 |
| +2.5 Volts monitor | 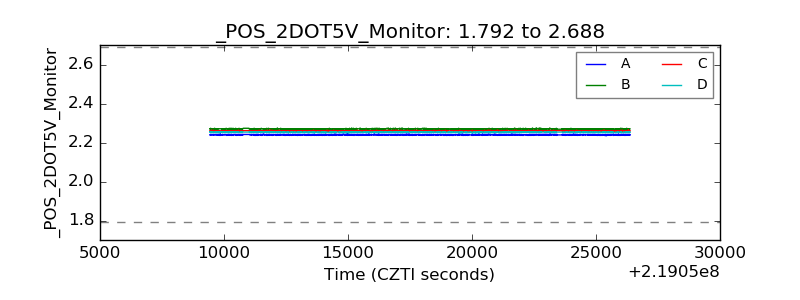 |
| +5 Volts monitor |  |
| _ROLL_ROT | 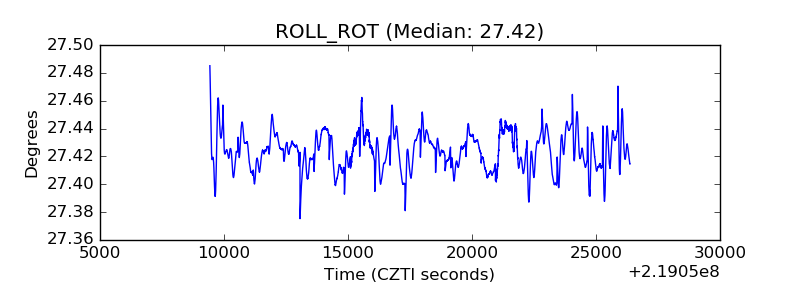 |
| _Roll_DEC | 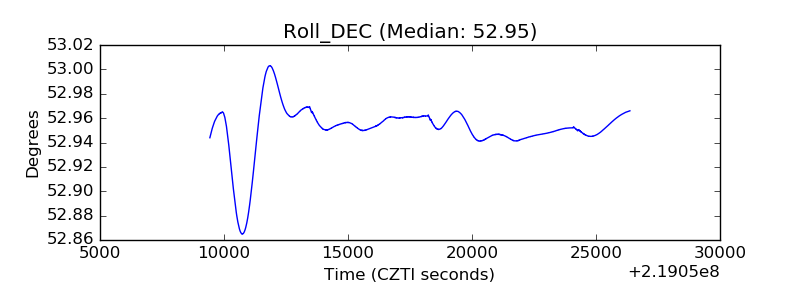 |
| _Roll_RA | 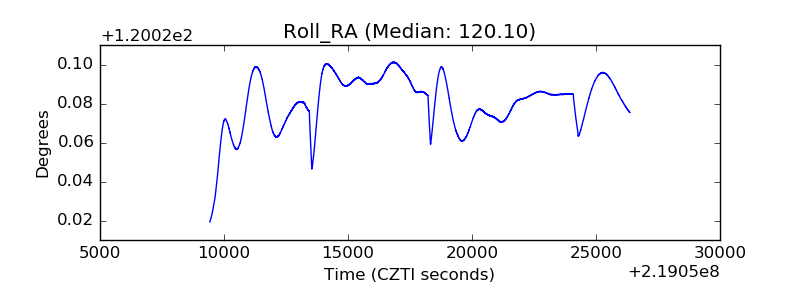 |
| Veto Counter | 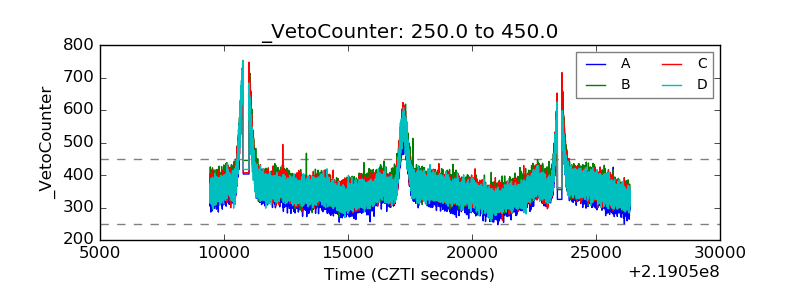 |