| Param | Original file | Final file |
|---|---|---|
| Filename | modeM0/AS1A02_075T05_9000000920cztM0_level2.evt | modeM0/AS1A02_075T05_9000000920cztM0_level2_quad_clean.evt |
| Size (bytes) | 692,516,160 | 106,125,120 |
| Size | 660.4 MB | 101.2 MB |
| Events in quadrant A | 5,787,120 | 629,309 |
| Events in quadrant B | 4,520,653 | 650,813 |
| Events in quadrant C | 4,206,199 | 640,328 |
| Events in quadrant D | 5,801,223 | 620,509 |
| Mode SS | |||
|---|---|---|---|
| Quadrant | BADHDUFLAG | Total packets | Discarded packets |
| A | 0 | 198 | 0 |
| B | 0 | 198 | 0 |
| C | 0 | 198 | 0 |
| D | 0 | 198 | 0 |
| Mode M9 | |||
|---|---|---|---|
| Quadrant | BADHDUFLAG | Total packets | Discarded packets |
| A | 0 | 8 | 0 |
| B | 0 | 8 | 0 |
| C | 0 | 8 | 0 |
| D | 0 | 8 | 0 |
| Mode M0 | |||
|---|---|---|---|
| Quadrant | BADHDUFLAG | Total packets | Discarded packets |
| A | 0 | 23882 | 0 |
| B | 0 | 20128 | 0 |
| C | 0 | 19784 | 0 |
| D | 0 | 24130 | 0 |
| Quadrant | Total seconds | Saturated seconds | Saturation percentage |
|---|---|---|---|
| A | 9701 | 622 | 6.411710% |
| B | 9701 | 217 | 2.236883% |
| C | 9701 | 158 | 1.628698% |
| D | 9701 | 243 | 2.504896% |
Noise dominated data is calculated using 1-second bins in cleaned event files. If a bin has >2000 counts, and if more than 50% of those come from <1% of pixels, then it is considered to be noise-dominated and hence unusable.
| Quadrant | # 1 sec bins | Bins with >0 counts | Bins with >2000 counts | High rate bins dominated by noise | Noise dominated (total time) | Noise dominated (detector-on time) | Marked lightcurve |
|---|---|---|---|---|---|---|---|
| A | 10507 | 9705 | 205 | 205 | 1.95% | 2.11% |  |
| B | 10507 | 9705 | 3 | 3 | 0.03% | 0.03% |  |
| C | 10507 | 9705 | 0 | 0 | 0.00% | 0.00% | 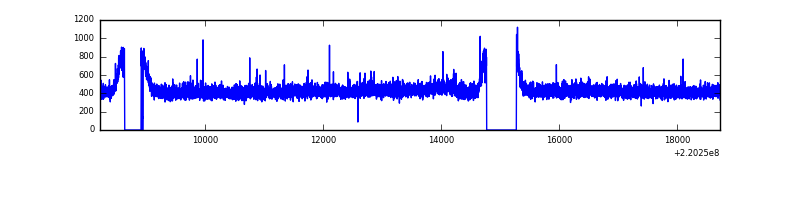 |
| D | 10507 | 9705 | 40 | 40 | 0.38% | 0.41% |  |
Top three noisy pixels from each quadrant. If the there are fewer than three noisy pixels in the level2.evt file, extra rows are filled as -1
| Pixel properties | Quadrant properties | ||||||
|---|---|---|---|---|---|---|---|
| Quadrant | DetID | PixID | Counts | Sigma | Mean | Median | Sigma |
| A | 14 | 111 | 1369100 | 6138.94 | 1088 | 1064 | 222.8 |
| A | 4 | 2 | 164863 | 735.03 | 1088 | 1064 | 222.8 |
| A | 8 | 15 | 39706 | 173.4 | 1088 | 1064 | 222.8 |
| B | 0 | 214 | 100750 | 462.81 | 1112 | 1083 | 215.4 |
| B | 11 | 51 | 50437 | 229.18 | 1112 | 1083 | 215.4 |
| B | 12 | 111 | 21541 | 95.0 | 1112 | 1083 | 215.4 |
| C | 10 | 22 | 9254 | 32.56 | 1073 | 1075 | 251.2 |
| C | 13 | 61 | 8387 | 29.11 | 1073 | 1075 | 251.2 |
| C | 9 | 247 | 7038 | 23.74 | 1073 | 1075 | 251.2 |
| D | 8 | 195 | 1261661 | 4819.08 | 1073 | 1037 | 261.6 |
| D | 2 | 33 | 315604 | 1202.52 | 1073 | 1037 | 261.6 |
| D | 10 | 172 | 77588 | 292.64 | 1073 | 1037 | 261.6 |
Histogram calculated using DETX and DETY for each event in the final _common_clean file
| Quadrant A | 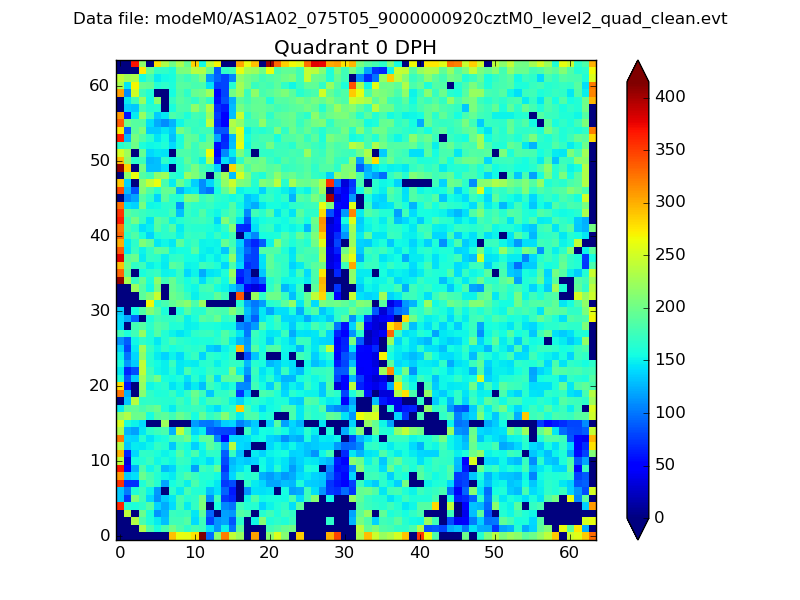 |
 |
Quadrant B |
|---|---|---|---|
| Quadrant D |  |
 |
Quadrant C |
| Plot type | Count rate plots | Images |
|---|---|---|
| Comparison with Poisson distribution Blue bars denote a histogram of data divided into 1 sec bins. Red curve is a Poisson curve with rate = median count rate of data. |
 |
 |
| Quadrant-wise count rates Data is divided into 100 sec bins |
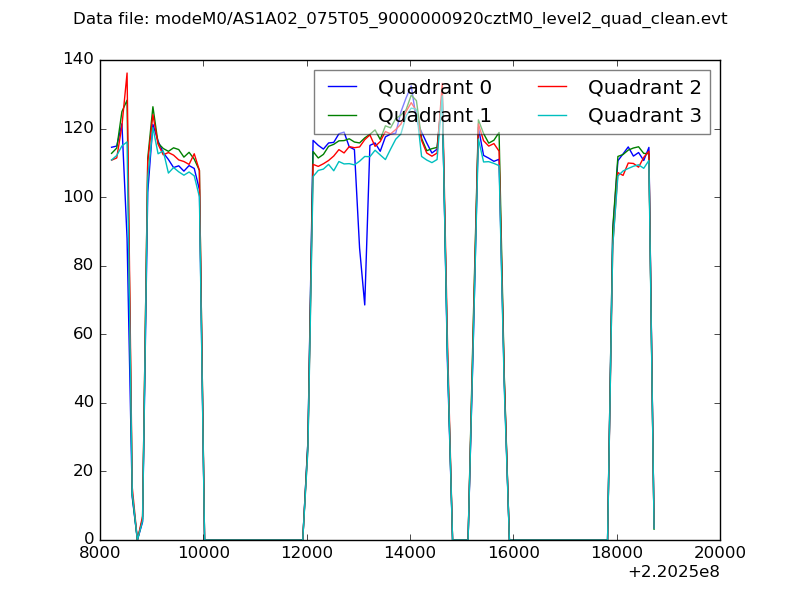 |
|
| Module-wise count rates for Quadrant A Data is divided into 100 sec bins |
 |
 |
| Module-wise count rates for Quadrant B Data is divided into 100 sec bins |
 |
 |
| Module-wise count rates for Quadrant C Data is divided into 100 sec bins |
 |
 |
| Module-wise count rates for Quadrant D Data is divided into 100 sec bins |
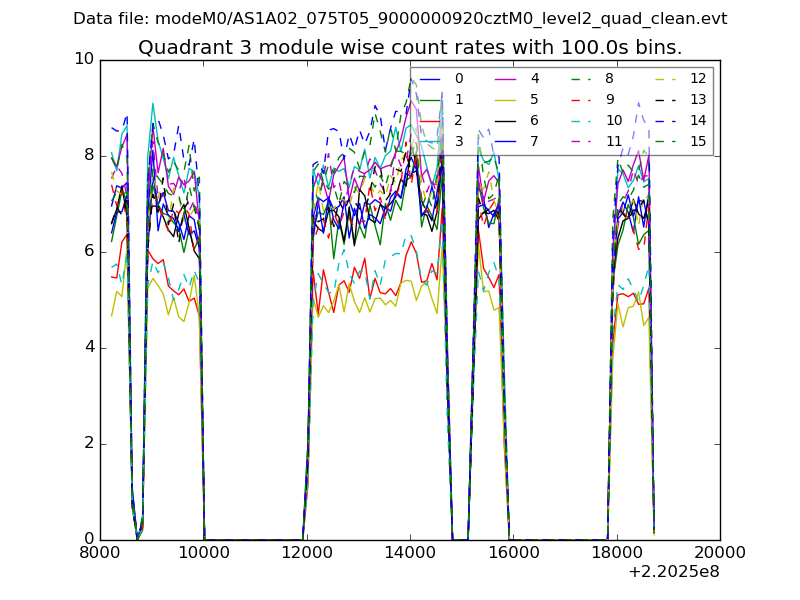 |
 |
| Parameter | Plot |
|---|---|
| CZT HV Monitor |  |
| D_VDD | 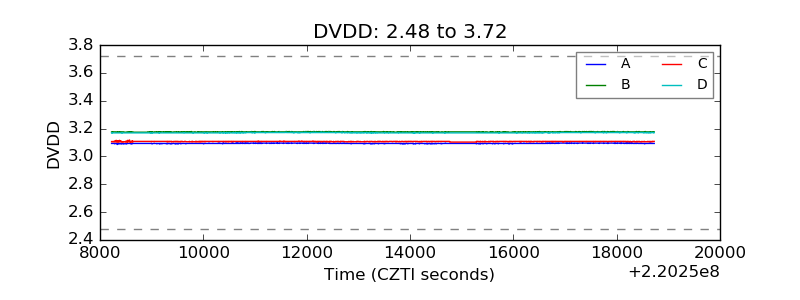 |
| Temperature 1 | 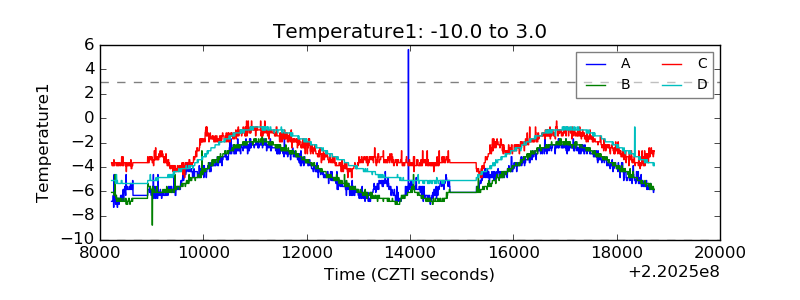 |
| Veto HV Monitor |  |
| Veto LLD | 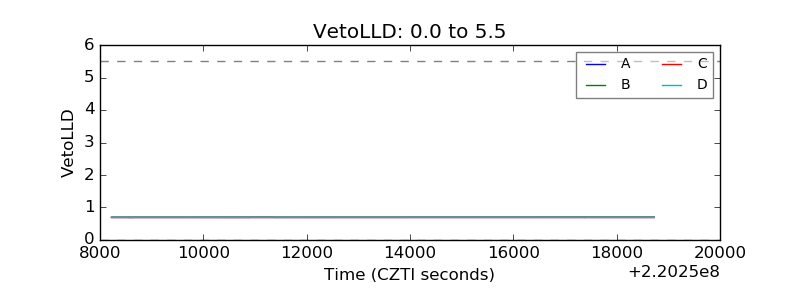 |
| Alpha Counter |  |
| _CPM_Rate |  |
| CZT Counter |  |
| +2.5 Volts monitor |  |
| +5 Volts monitor |  |
| _ROLL_ROT |  |
| _Roll_DEC |  |
| _Roll_RA |  |
| Veto Counter |  |