| Param | Original file | Final file |
|---|---|---|
| Filename | modeM0/AS1G06_168T13_9000000942cztM0_level2.evt | modeM0/AS1G06_168T13_9000000942cztM0_level2_quad_clean.evt |
| Size (bytes) | 736,228,800 | 146,059,200 |
| Size | 702.1 MB | 139.3 MB |
| Events in quadrant A | 5,400,358 | 921,653 |
| Events in quadrant B | 5,177,165 | 937,547 |
| Events in quadrant C | 5,303,376 | 924,283 |
| Events in quadrant D | 5,691,609 | 900,481 |
| Mode M9 | |||
|---|---|---|---|
| Quadrant | BADHDUFLAG | Total packets | Discarded packets |
| A | 0 | 16 | 0 |
| B | 0 | 16 | 0 |
| C | 0 | 16 | 0 |
| D | 0 | 16 | 0 |
| Mode SS | |||
|---|---|---|---|
| Quadrant | BADHDUFLAG | Total packets | Discarded packets |
| A | 0 | 218 | 0 |
| B | 0 | 218 | 0 |
| C | 0 | 218 | 0 |
| D | 0 | 218 | 0 |
| Mode M0 | |||
|---|---|---|---|
| Quadrant | BADHDUFLAG | Total packets | Discarded packets |
| A | 0 | 23209 | 0 |
| B | 0 | 22636 | 0 |
| C | 0 | 23151 | 0 |
| D | 0 | 24560 | 0 |
| Quadrant | Total seconds | Saturated seconds | Saturation percentage |
|---|---|---|---|
| A | 10683 | 108 | 1.010952% |
| B | 10683 | 137 | 1.282411% |
| C | 10683 | 153 | 1.432182% |
| D | 10683 | 273 | 2.555462% |
Noise dominated data is calculated using 1-second bins in cleaned event files. If a bin has >2000 counts, and if more than 50% of those come from <1% of pixels, then it is considered to be noise-dominated and hence unusable.
| Quadrant | # 1 sec bins | Bins with >0 counts | Bins with >2000 counts | High rate bins dominated by noise | Noise dominated (total time) | Noise dominated (detector-on time) | Marked lightcurve |
|---|---|---|---|---|---|---|---|
| A | 12288 | 10685 | 4 | 4 | 0.03% | 0.04% | 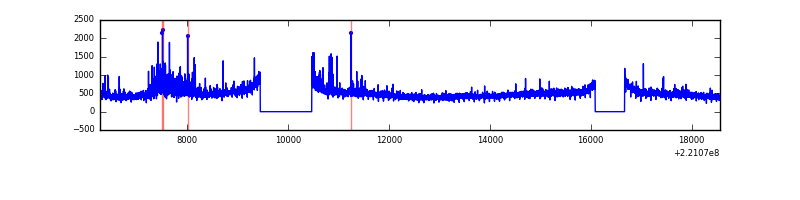 |
| B | 12288 | 10685 | 4 | 4 | 0.03% | 0.04% |  |
| C | 12288 | 10685 | 64 | 64 | 0.52% | 0.60% | 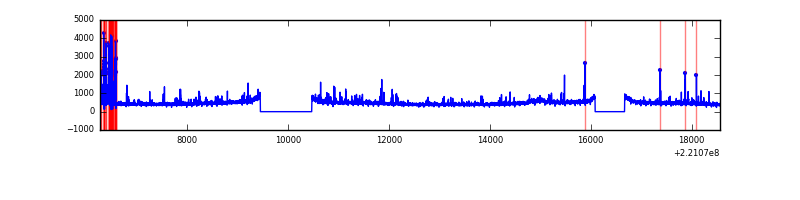 |
| D | 12288 | 10685 | 171 | 171 | 1.39% | 1.60% | 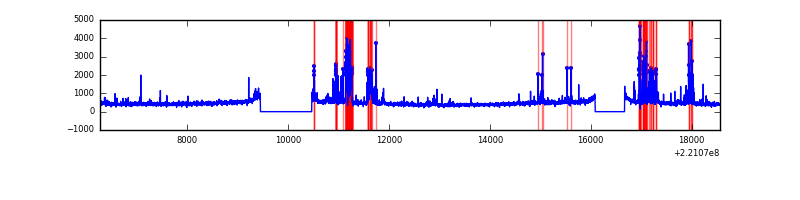 |
Top three noisy pixels from each quadrant. If the there are fewer than three noisy pixels in the level2.evt file, extra rows are filled as -1
| Pixel properties | Quadrant properties | ||||||
|---|---|---|---|---|---|---|---|
| Quadrant | DetID | PixID | Counts | Sigma | Mean | Median | Sigma |
| A | 8 | 15 | 389038 | 1492.37 | 1265 | 1236 | 259.9 |
| A | 15 | 239 | 105309 | 400.5 | 1265 | 1236 | 259.9 |
| A | 13 | 248 | 30845 | 113.94 | 1265 | 1236 | 259.9 |
| B | 4 | 48 | 49592 | 197.11 | 1277 | 1248 | 245.3 |
| B | 0 | 219 | 41287 | 163.25 | 1277 | 1248 | 245.3 |
| B | 3 | 220 | 32664 | 128.09 | 1277 | 1248 | 245.3 |
| C | 9 | 68 | 364720 | 1271.89 | 1230 | 1239 | 285.8 |
| C | 10 | 22 | 53782 | 183.86 | 1230 | 1239 | 285.8 |
| C | 9 | 247 | 29328 | 98.29 | 1230 | 1239 | 285.8 |
| D | 2 | 33 | 683814 | 2268.83 | 1226 | 1187 | 300.9 |
| D | 8 | 195 | 138835 | 457.5 | 1226 | 1187 | 300.9 |
| D | 14 | 34 | 85383 | 279.84 | 1226 | 1187 | 300.9 |
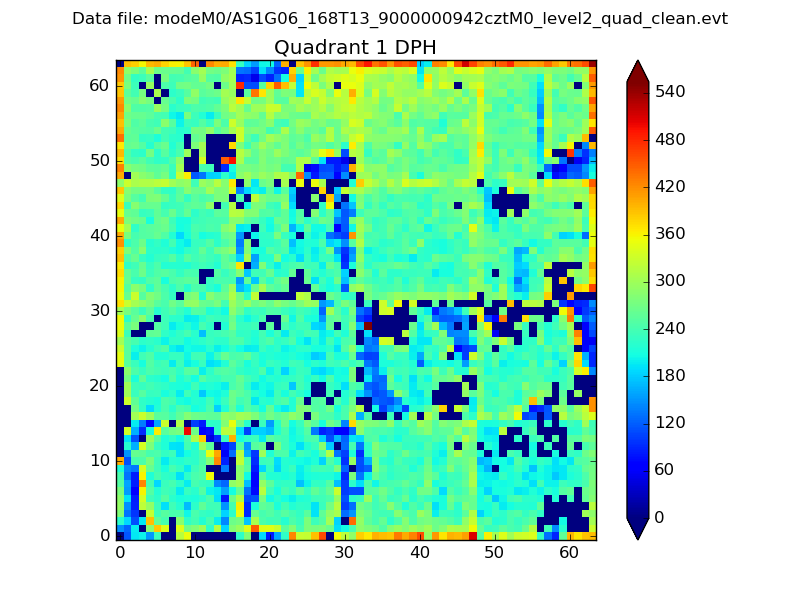
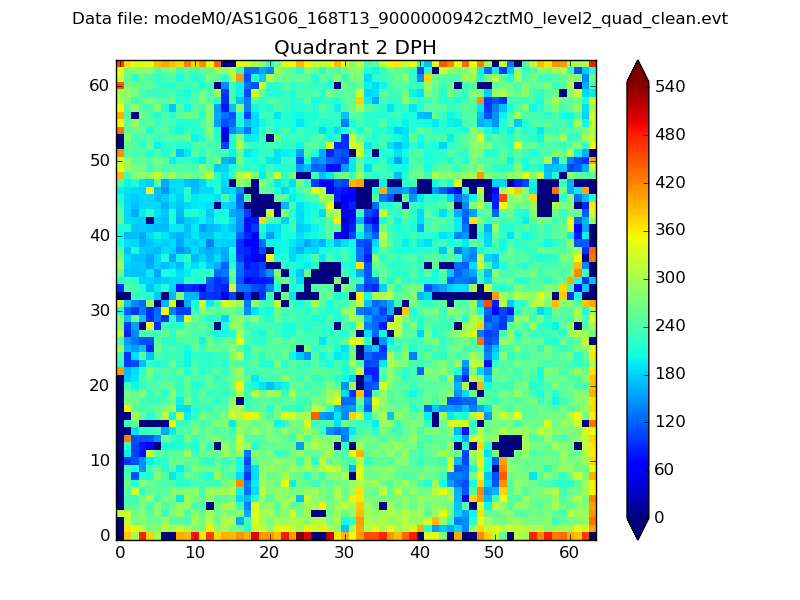
Histogram calculated using DETX and DETY for each event in the final _common_clean file
| Quadrant A |  |
 |
Quadrant B |
|---|---|---|---|
| Quadrant D | 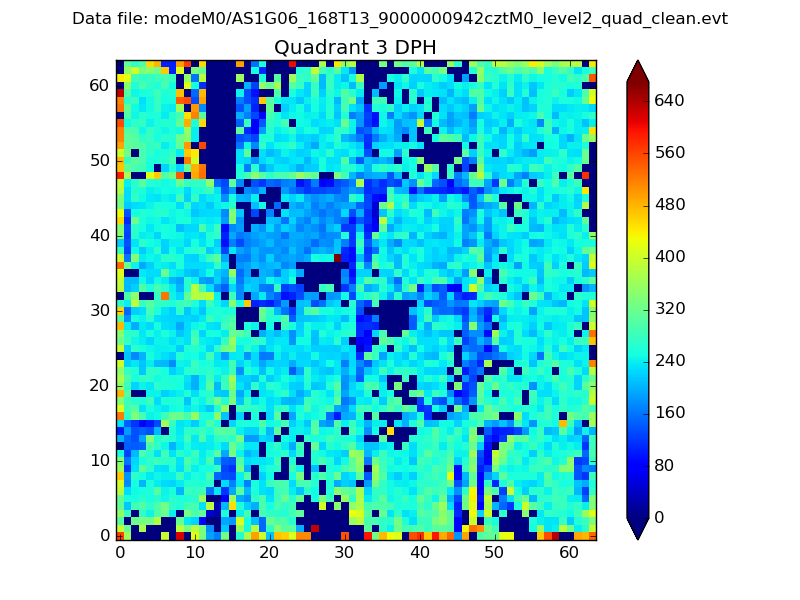 |
 |
Quadrant C |
| Plot type | Count rate plots | Images |
|---|---|---|
| Comparison with Poisson distribution Blue bars denote a histogram of data divided into 1 sec bins. Red curve is a Poisson curve with rate = median count rate of data. |
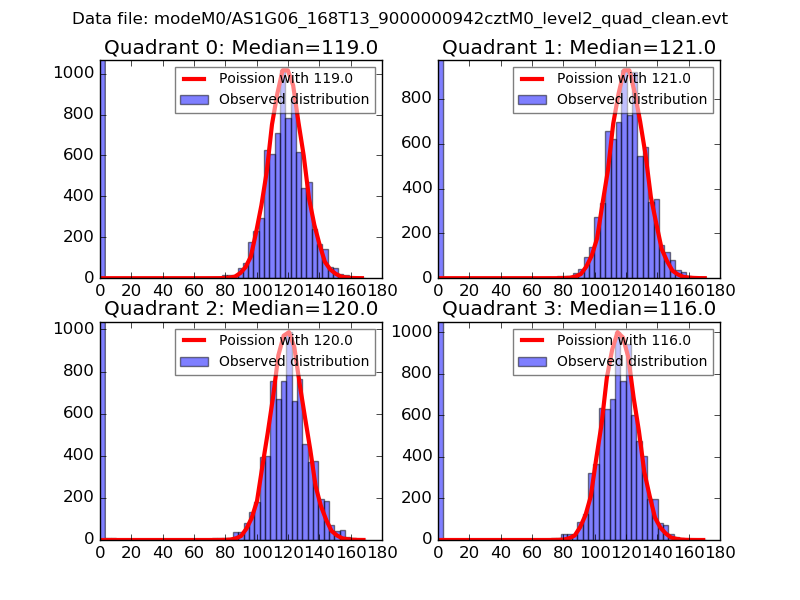 |
 |
| Quadrant-wise count rates Data is divided into 100 sec bins |
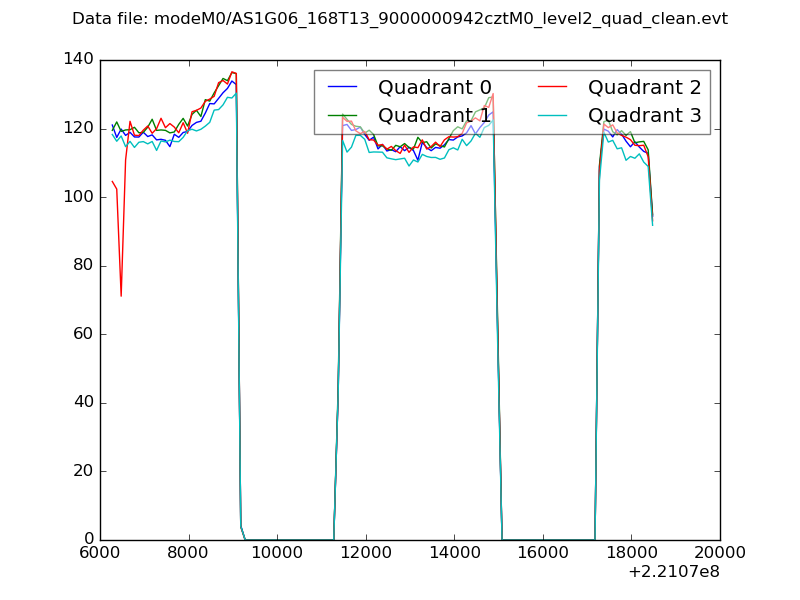 |
|
| Module-wise count rates for Quadrant A Data is divided into 100 sec bins |
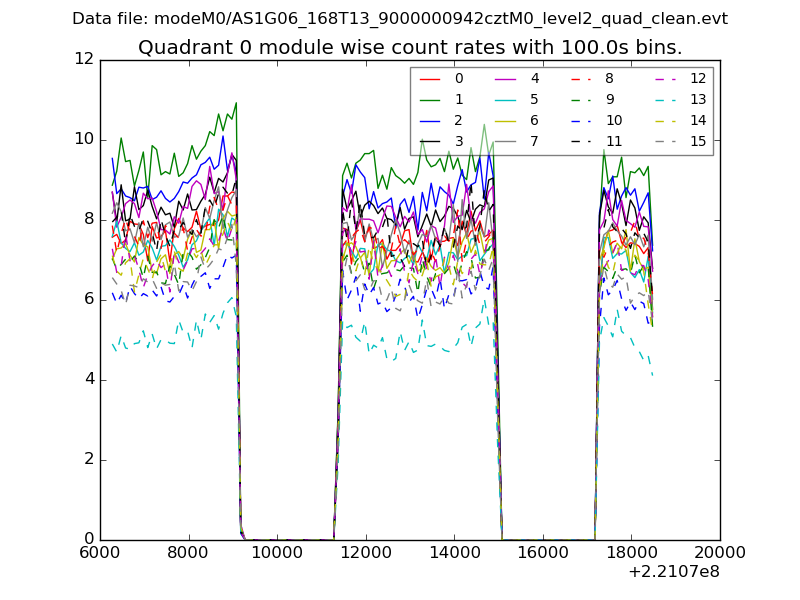 |
 |
| Module-wise count rates for Quadrant B Data is divided into 100 sec bins |
 |
 |
| Module-wise count rates for Quadrant C Data is divided into 100 sec bins |
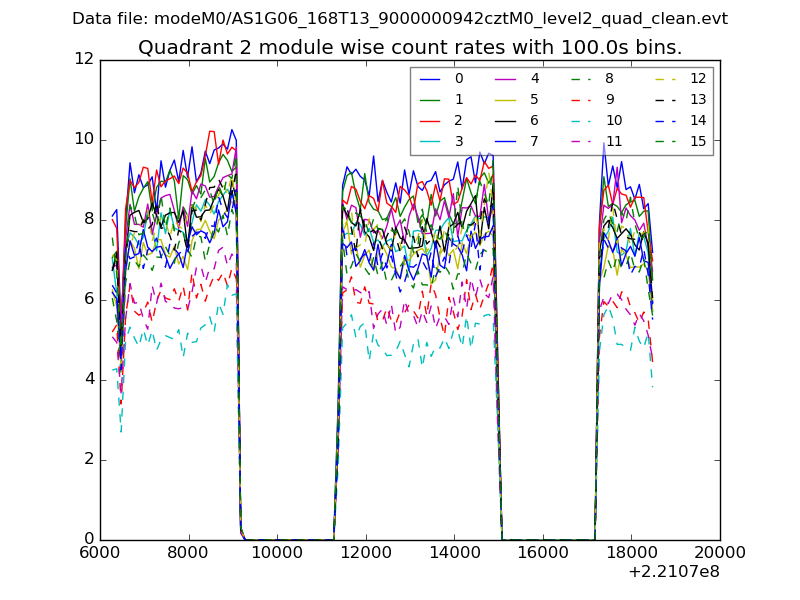 |
 |
| Module-wise count rates for Quadrant D Data is divided into 100 sec bins |
 |
 |
| Parameter | Plot |
|---|---|
| CZT HV Monitor | 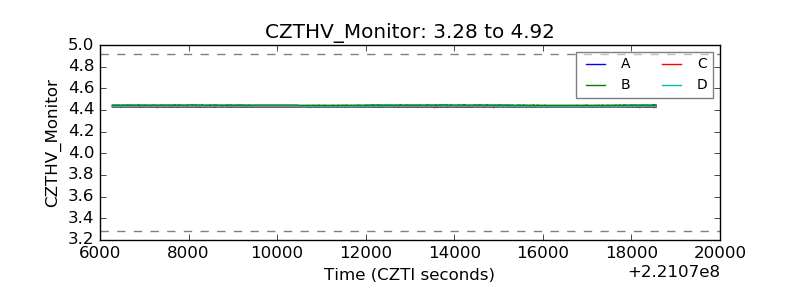 |
| D_VDD | 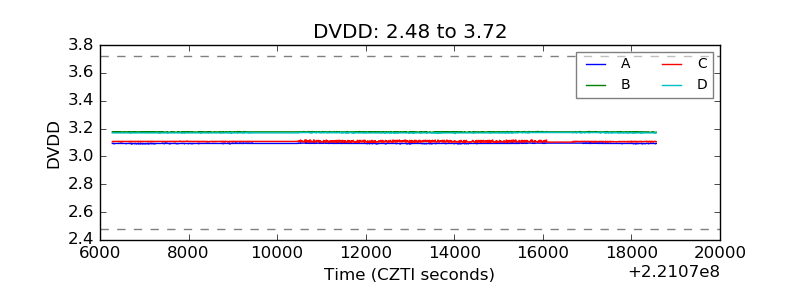 |
| Temperature 1 |  |
| Veto HV Monitor |  |
| Veto LLD |  |
| Alpha Counter | 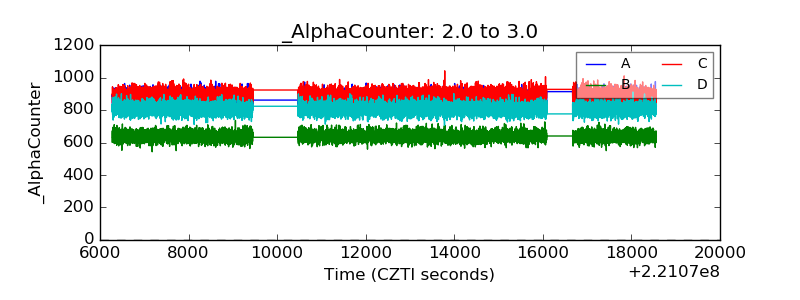 |
| _CPM_Rate | 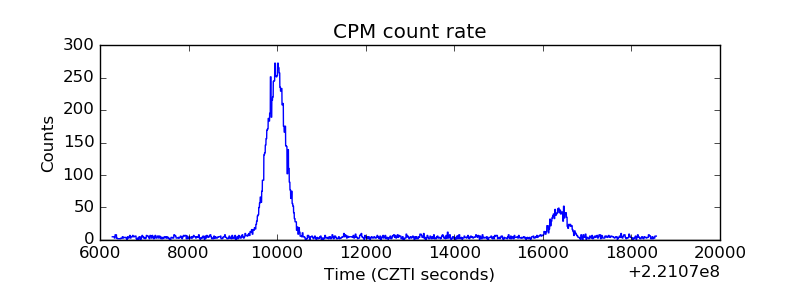 |
| CZT Counter |  |
| +2.5 Volts monitor | 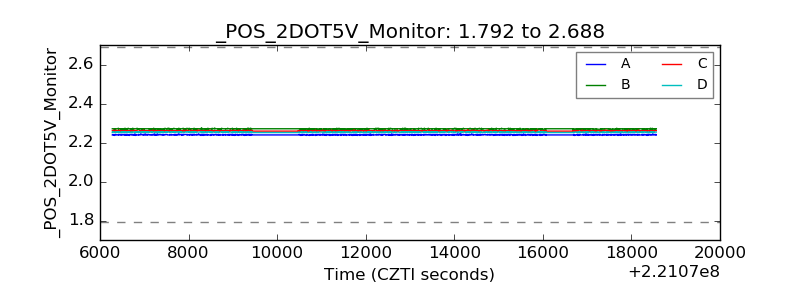 |
| +5 Volts monitor |  |
| _ROLL_ROT |  |
| _Roll_DEC |  |
| _Roll_RA | 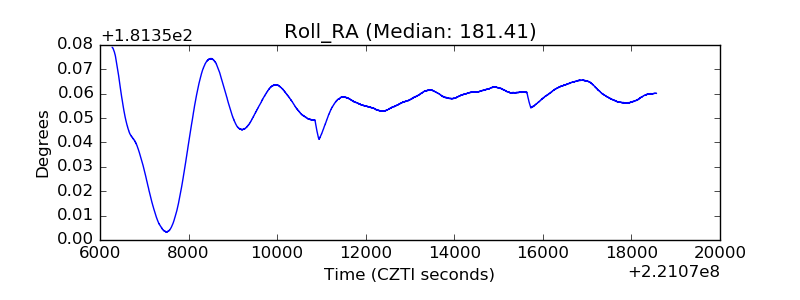 |
| Veto Counter |  |