| Param | Original file | Final file |
|---|---|---|
| Filename | modeM0/AS1G06_026T01_9000000958cztM0_level2.evt | modeM0/AS1G06_026T01_9000000958cztM0_level2_quad_clean.evt |
| Size (bytes) | 1,181,203,200 | 233,576,640 |
| Size | 1.1 GB | 222.8 MB |
| Events in quadrant A | 8,354,530 | 1,471,939 |
| Events in quadrant B | 8,846,385 | 1,483,383 |
| Events in quadrant C | 8,172,996 | 1,454,742 |
| Events in quadrant D | 9,158,437 | 1,401,359 |
| Mode M0 | |||
|---|---|---|---|
| Quadrant | BADHDUFLAG | Total packets | Discarded packets |
| A | 0 | 37809 | 0 |
| B | 0 | 39017 | 0 |
| C | 0 | 37467 | 0 |
| D | 0 | 39708 | 0 |
| Mode M9 | |||
|---|---|---|---|
| Quadrant | BADHDUFLAG | Total packets | Discarded packets |
| A | 0 | 126 | 0 |
| B | 0 | 126 | 0 |
| C | 0 | 126 | 0 |
| D | 0 | 126 | 0 |
| Mode SS | |||
|---|---|---|---|
| Quadrant | BADHDUFLAG | Total packets | Discarded packets |
| A | 0 | 372 | 0 |
| B | 0 | 372 | 0 |
| C | 0 | 372 | 0 |
| D | 0 | 372 | 0 |
| Quadrant | Total seconds | Saturated seconds | Saturation percentage |
|---|---|---|---|
| A | 18340 | 128 | 0.697928% |
| B | 18340 | 160 | 0.872410% |
| C | 18340 | 52 | 0.283533% |
| D | 18340 | 206 | 1.123228% |
Noise dominated data is calculated using 1-second bins in cleaned event files. If a bin has >2000 counts, and if more than 50% of those come from <1% of pixels, then it is considered to be noise-dominated and hence unusable.
| Quadrant | # 1 sec bins | Bins with >0 counts | Bins with >2000 counts | High rate bins dominated by noise | Noise dominated (total time) | Noise dominated (detector-on time) | Marked lightcurve |
|---|---|---|---|---|---|---|---|
| A | 26417 | 18346 | 8 | 8 | 0.03% | 0.04% |  |
| B | 26417 | 18346 | 11 | 11 | 0.04% | 0.06% |  |
| C | 26417 | 18346 | 0 | 0 | 0.00% | 0.00% |  |
| D | 26417 | 18346 | 117 | 117 | 0.44% | 0.64% |  |
Top three noisy pixels from each quadrant. If the there are fewer than three noisy pixels in the level2.evt file, extra rows are filled as -1
| Pixel properties | Quadrant properties | ||||||
|---|---|---|---|---|---|---|---|
| Quadrant | DetID | PixID | Counts | Sigma | Mean | Median | Sigma |
| A | 15 | 234 | 47713 | 105.15 | 2140 | 2092 | 433.9 |
| A | 13 | 248 | 32295 | 69.61 | 2140 | 2092 | 433.9 |
| A | 0 | 226 | 20559 | 42.56 | 2140 | 2092 | 433.9 |
| B | 0 | 214 | 218276 | 524.35 | 2153 | 2097 | 412.3 |
| B | 0 | 228 | 92224 | 218.61 | 2153 | 2097 | 412.3 |
| B | 15 | 204 | 54196 | 126.37 | 2153 | 2097 | 412.3 |
| C | 13 | 61 | 16234 | 29.21 | 2085 | 2093 | 484.1 |
| C | 8 | 128 | 14793 | 26.23 | 2085 | 2093 | 484.1 |
| C | 1 | 16 | 9536 | 15.37 | 2085 | 2093 | 484.1 |
| D | 8 | 195 | 606687 | 1188.03 | 2083 | 2014 | 509.0 |
| D | 13 | 105 | 240184 | 467.94 | 2083 | 2014 | 509.0 |
| D | 12 | 233 | 187215 | 363.87 | 2083 | 2014 | 509.0 |
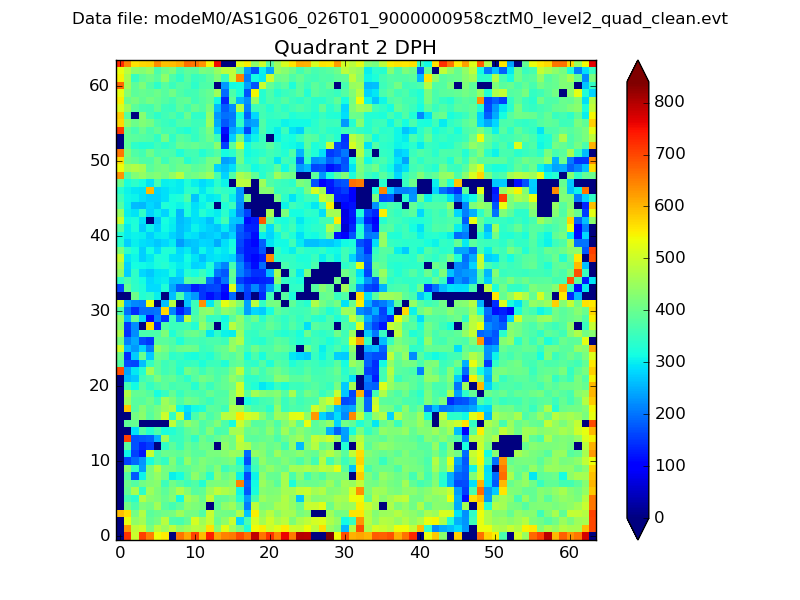
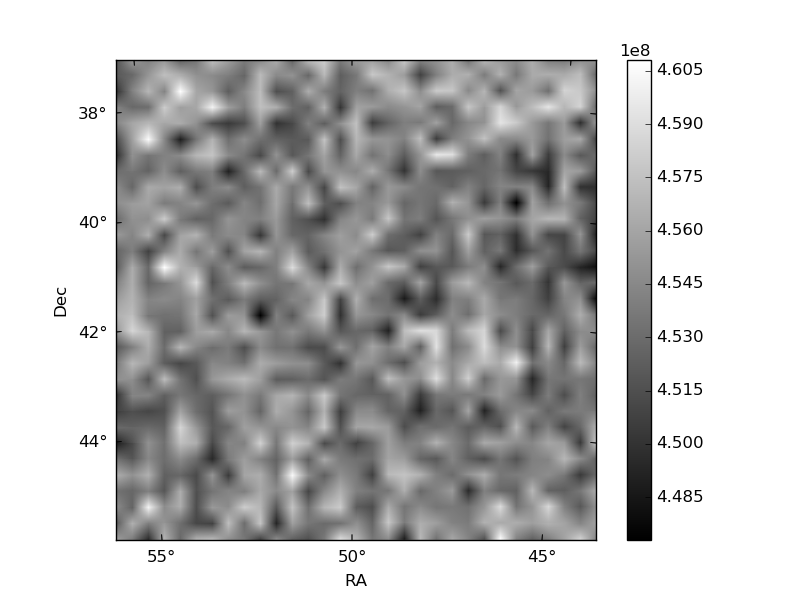
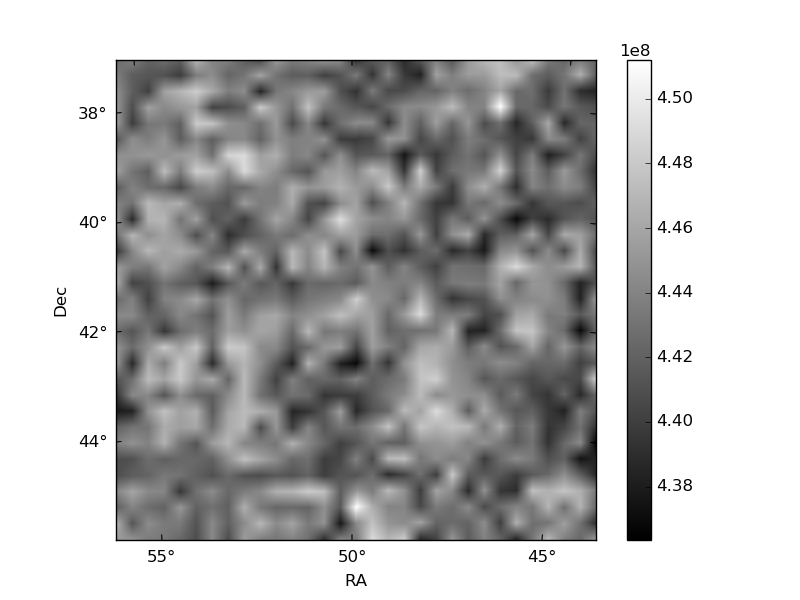
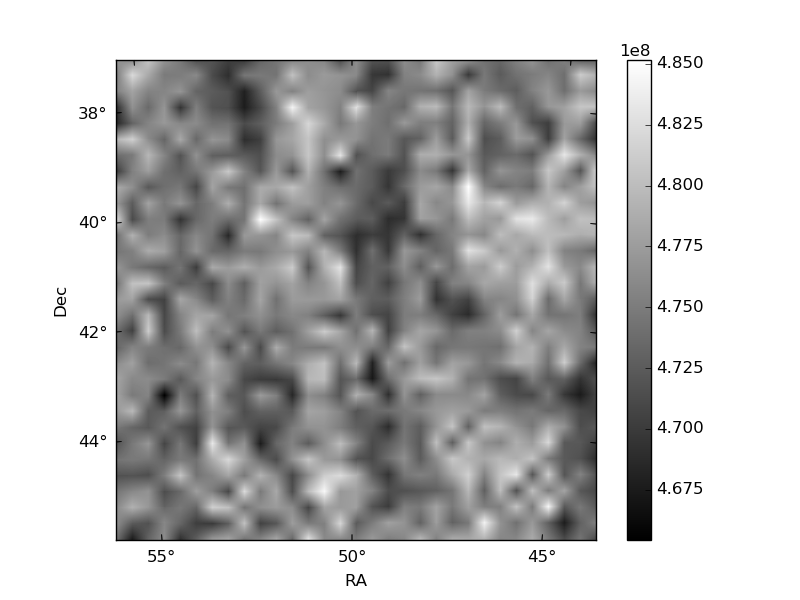
Histogram calculated using DETX and DETY for each event in the final _common_clean file
| Quadrant A |  |
 |
Quadrant B |
|---|---|---|---|
| Quadrant D | 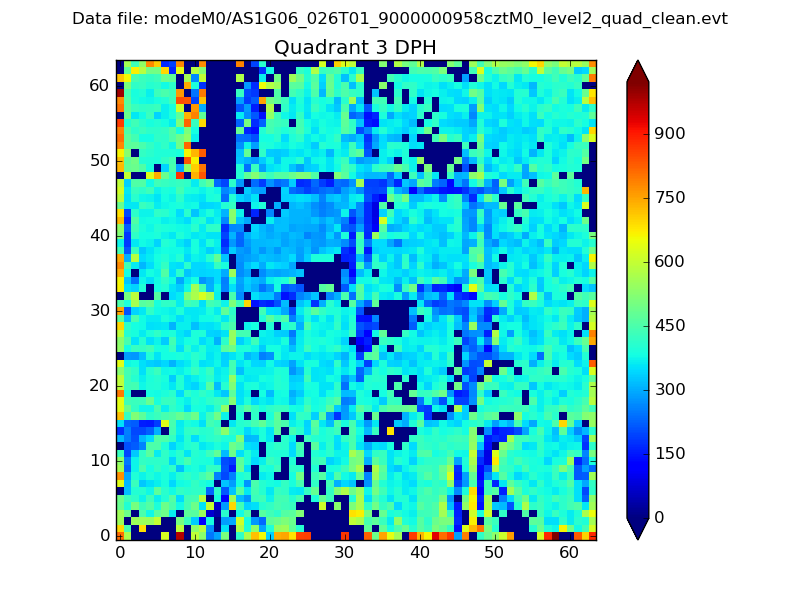 |
 |
Quadrant C |
| Plot type | Count rate plots | Images |
|---|---|---|
| Comparison with Poisson distribution Blue bars denote a histogram of data divided into 1 sec bins. Red curve is a Poisson curve with rate = median count rate of data. |
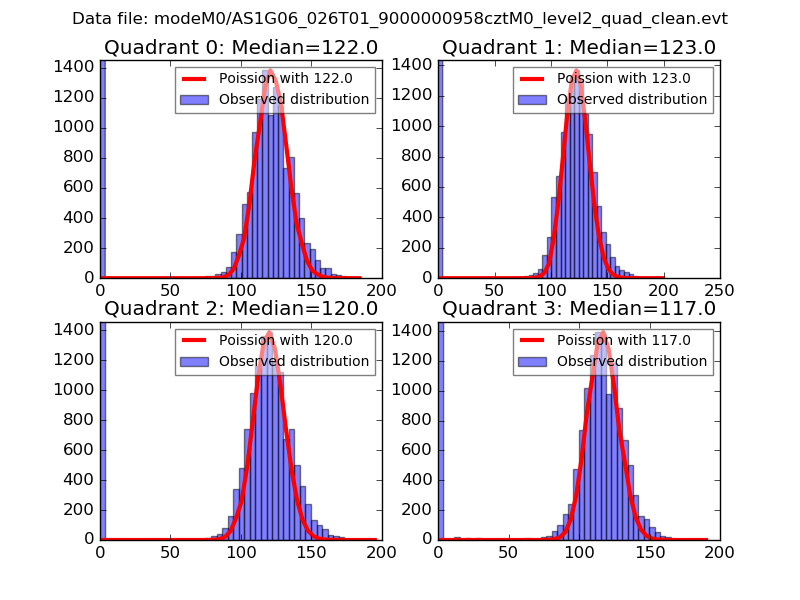 |
 |
| Quadrant-wise count rates Data is divided into 100 sec bins |
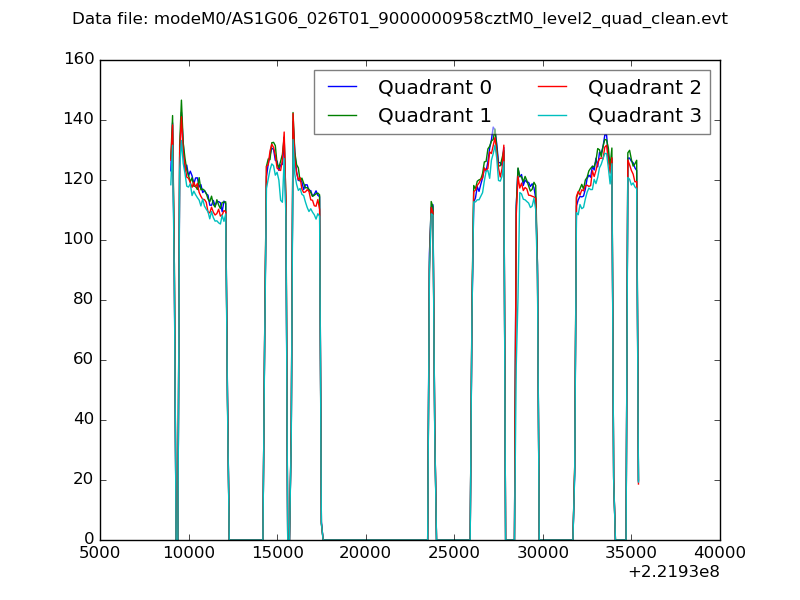 |
|
| Module-wise count rates for Quadrant A Data is divided into 100 sec bins |
 |
 |
| Module-wise count rates for Quadrant B Data is divided into 100 sec bins |
 |
 |
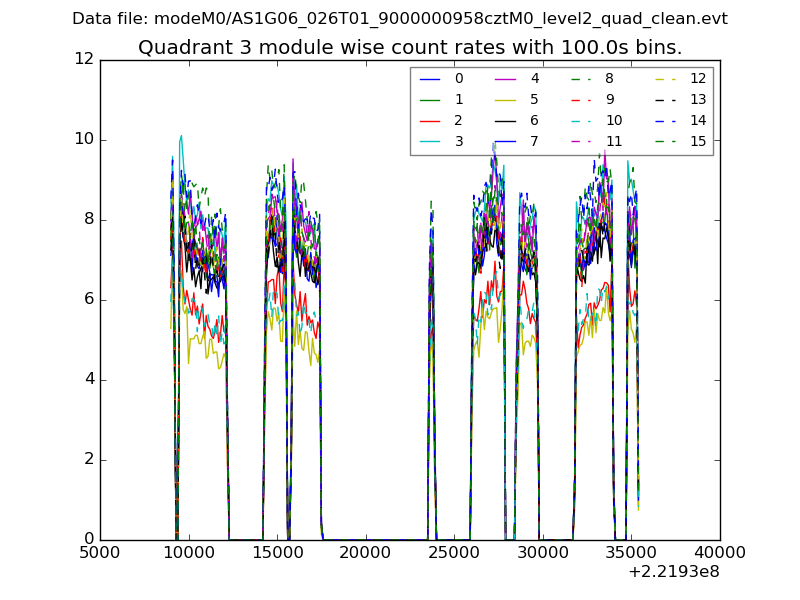
| Module-wise count rates for Quadrant C Data is divided into 100 sec bins |
 |
 |
| Module-wise count rates for Quadrant D Data is divided into 100 sec bins |
 |
 |
| Parameter | Plot |
|---|---|
| CZT HV Monitor | 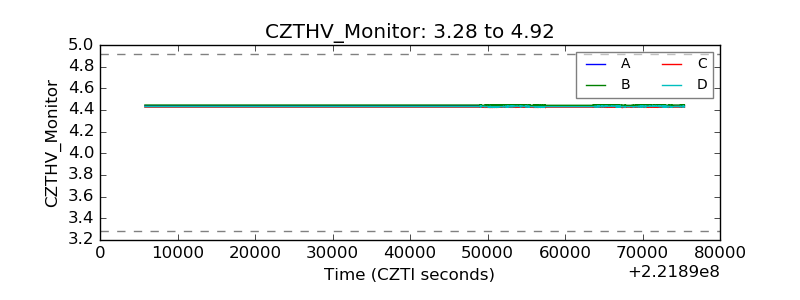 |
| D_VDD | 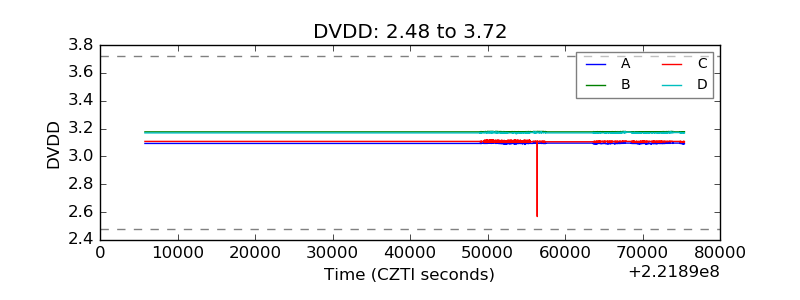 |
| Temperature 1 |  |
| Veto HV Monitor |  |
| Veto LLD |  |
| Alpha Counter |  |
| _CPM_Rate |  |
| CZT Counter | 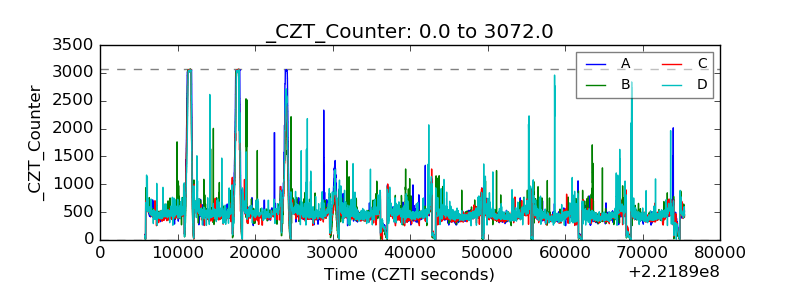 |
| +2.5 Volts monitor |  |
| +5 Volts monitor |  |
| _ROLL_ROT |  |
| _Roll_DEC |  |
| _Roll_RA |  |
| Veto Counter |  |