| Param | Original file | Final file |
|---|---|---|
| Filename | modeM0/AS1A03_009T01_9000001160cztM0_level2.evt | modeM0/AS1A03_009T01_9000001160cztM0_level2_quad_clean.evt |
| Size (bytes) | 1,344,830,400 | 215,951,040 |
| Size | 1.3 GB | 205.9 MB |
| Events in quadrant A | 9,721,600 | 1,362,504 |
| Events in quadrant B | 9,195,936 | 1,391,356 |
| Events in quadrant C | 8,450,268 | 1,337,487 |
| Events in quadrant D | 12,141,734 | 1,205,660 |
| Mode M9 | |||
|---|---|---|---|
| Quadrant | BADHDUFLAG | Total packets | Discarded packets |
| A | 0 | 37 | 0 |
| B | 0 | 37 | 0 |
| C | 0 | 37 | 0 |
| D | 0 | 37 | 0 |
| Mode SS | |||
|---|---|---|---|
| Quadrant | BADHDUFLAG | Total packets | Discarded packets |
| A | 0 | 368 | 0 |
| B | 0 | 368 | 0 |
| C | 0 | 368 | 0 |
| D | 0 | 368 | 0 |
| Mode M0 | |||
|---|---|---|---|
| Quadrant | BADHDUFLAG | Total packets | Discarded packets |
| A | 0 | 40437 | 0 |
| B | 0 | 38571 | 0 |
| C | 0 | 37294 | 0 |
| D | 0 | 48126 | 0 |
| Quadrant | Total seconds | Saturated seconds | Saturation percentage |
|---|---|---|---|
| A | 18023 | 646 | 3.584309% |
| B | 18023 | 430 | 2.385840% |
| C | 18023 | 318 | 1.764412% |
| D | 18023 | 1481 | 8.217278% |
Noise dominated data is calculated using 1-second bins in cleaned event files. If a bin has >2000 counts, and if more than 50% of those come from <1% of pixels, then it is considered to be noise-dominated and hence unusable.
| Quadrant | # 1 sec bins | Bins with >0 counts | Bins with >2000 counts | High rate bins dominated by noise | Noise dominated (total time) | Noise dominated (detector-on time) | Marked lightcurve |
|---|---|---|---|---|---|---|---|
| A | 20923 | 18023 | 138 | 138 | 0.66% | 0.77% |  |
| B | 20923 | 18024 | 11 | 11 | 0.05% | 0.06% | 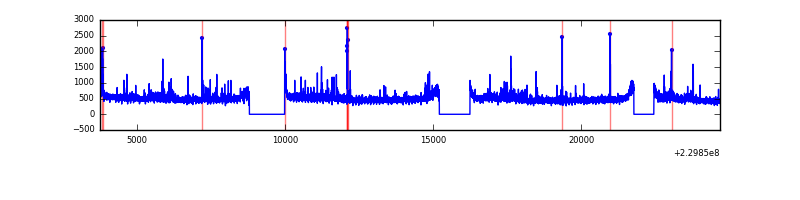 |
| C | 20923 | 18025 | 0 | 0 | 0.00% | 0.00% |  |
| D | 20923 | 18024 | 1005 | 1005 | 4.80% | 5.58% |  |
Top three noisy pixels from each quadrant. If the there are fewer than three noisy pixels in the level2.evt file, extra rows are filled as -1
| Pixel properties | Quadrant properties | ||||||
|---|---|---|---|---|---|---|---|
| Quadrant | DetID | PixID | Counts | Sigma | Mean | Median | Sigma |
| A | 15 | 239 | 902250 | 2036.6 | 2217 | 2174 | 441.9 |
| A | 15 | 236 | 168567 | 376.5 | 2217 | 2174 | 441.9 |
| A | 1 | 162 | 49527 | 107.15 | 2217 | 2174 | 441.9 |
| B | 0 | 214 | 301130 | 719.58 | 2232 | 2180 | 415.5 |
| B | 4 | 80 | 58984 | 136.73 | 2232 | 2180 | 415.5 |
| B | 12 | 111 | 44010 | 100.69 | 2232 | 2180 | 415.5 |
| C | 13 | 61 | 16452 | 28.79 | 2165 | 2176 | 495.9 |
| C | 8 | 128 | 7639 | 11.02 | 2165 | 2176 | 495.9 |
| C | 3 | 202 | 5537 | 6.78 | 2165 | 2176 | 495.9 |
| D | 1 | 52 | 2758910 | 5233.66 | 2087 | 2034 | 526.8 |
| D | 2 | 14 | 531957 | 1006.01 | 2087 | 2034 | 526.8 |
| D | 2 | 152 | 407046 | 768.88 | 2087 | 2034 | 526.8 |
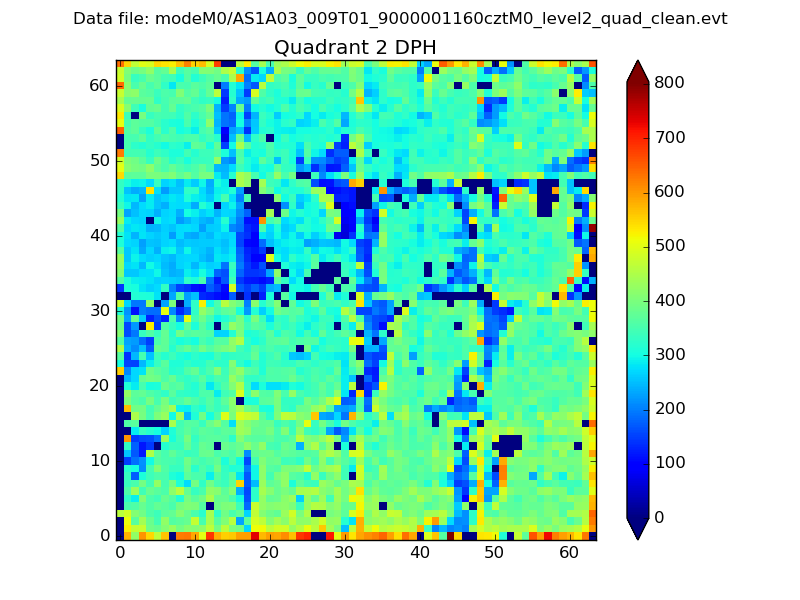
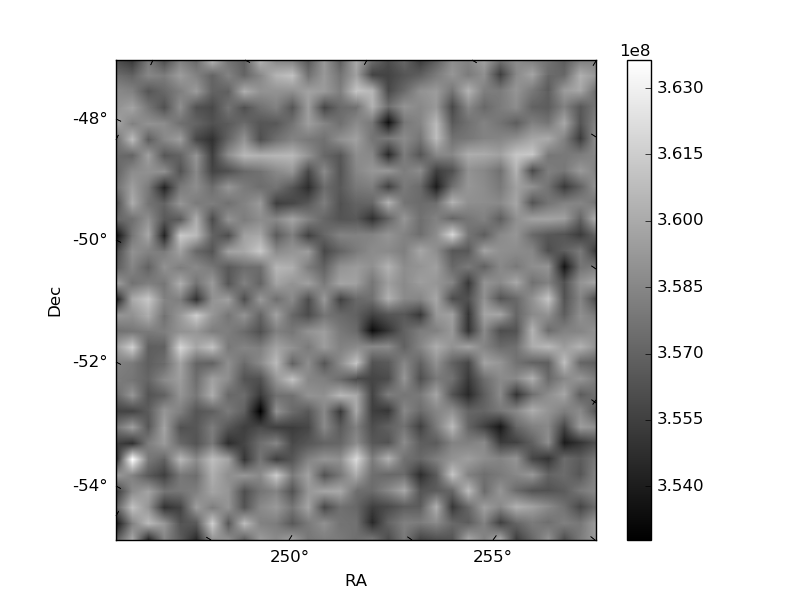
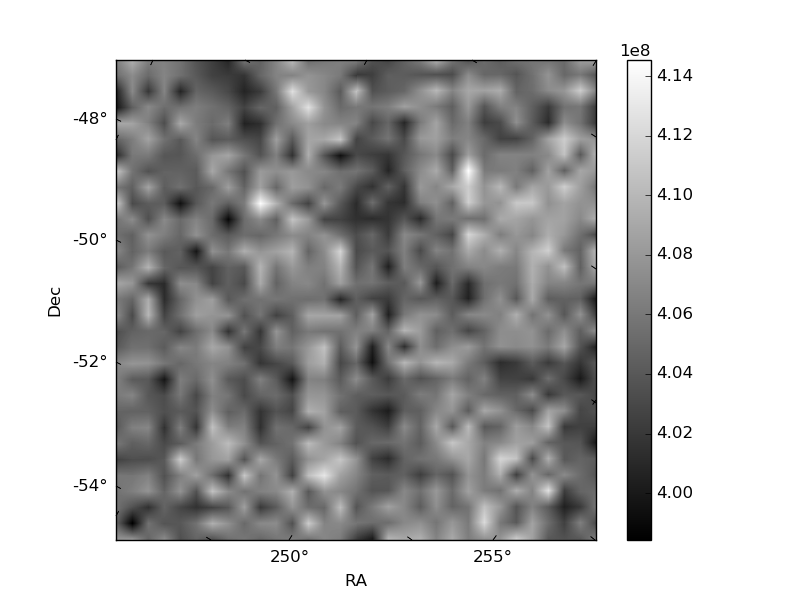
Histogram calculated using DETX and DETY for each event in the final _common_clean file
| Quadrant A |  |
 |
Quadrant B |
|---|---|---|---|
| Quadrant D | 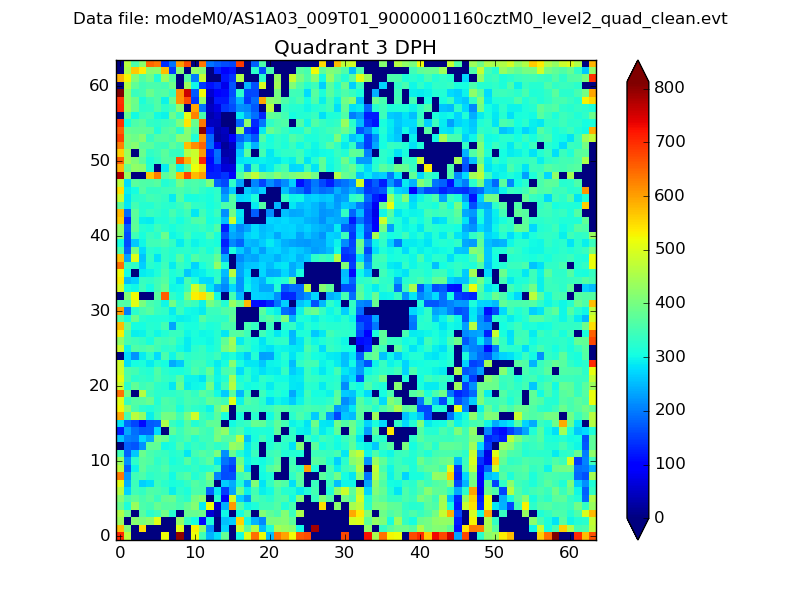 |
 |
Quadrant C |
| Plot type | Count rate plots | Images |
|---|---|---|
| Comparison with Poisson distribution Blue bars denote a histogram of data divided into 1 sec bins. Red curve is a Poisson curve with rate = median count rate of data. |
 |
 |
| Quadrant-wise count rates Data is divided into 100 sec bins |
 |
|
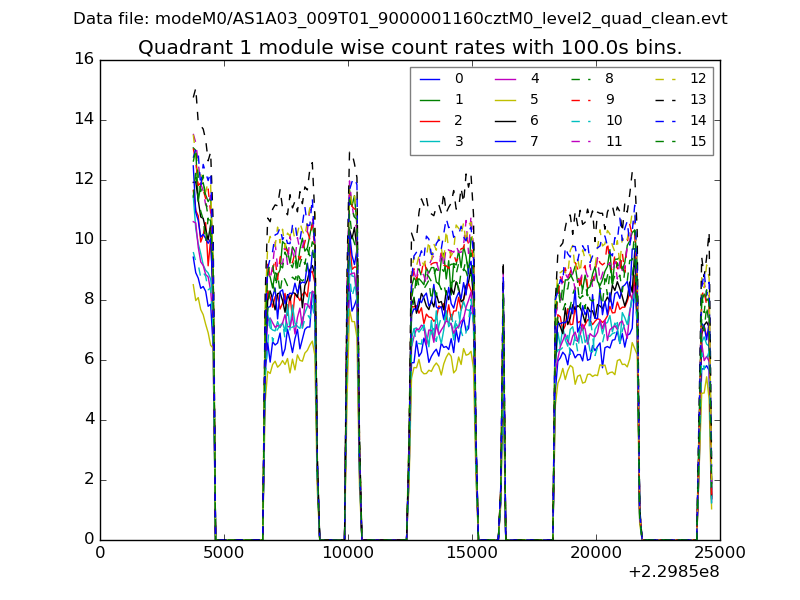
| Module-wise count rates for Quadrant A Data is divided into 100 sec bins |
 |
 |
| Module-wise count rates for Quadrant B Data is divided into 100 sec bins |
 |
 |
| Module-wise count rates for Quadrant C Data is divided into 100 sec bins |
 |
 |
| Module-wise count rates for Quadrant D Data is divided into 100 sec bins |
 |
 |
| Parameter | Plot |
|---|---|
| CZT HV Monitor |  |
| D_VDD |  |
| Temperature 1 | 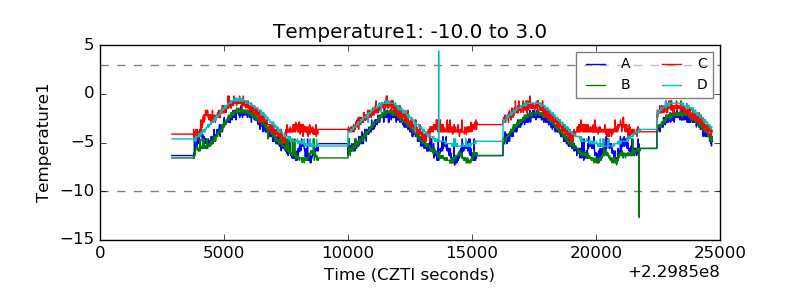 |
| Veto HV Monitor |  |
| Veto LLD | 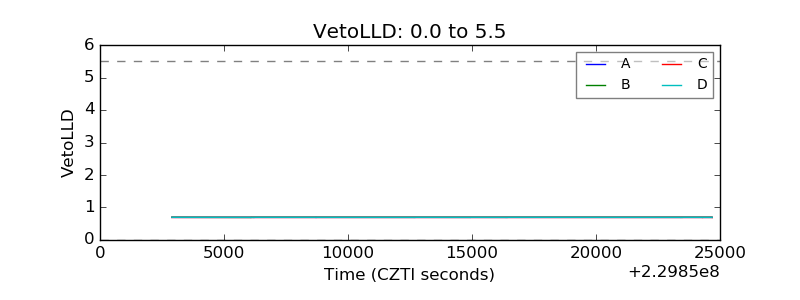 |
| Alpha Counter |  |
| _CPM_Rate |  |
| CZT Counter |  |
| +2.5 Volts monitor |  |
| +5 Volts monitor |  |
| _ROLL_ROT |  |
| _Roll_DEC |  |
| _Roll_RA |  |
| Veto Counter |  |