| Param | Original file | Final file |
|---|---|---|
| Filename | modeM0/AS1A03_005T01_9000001348cztM0_level2.evt | modeM0/AS1A03_005T01_9000001348cztM0_level2_quad_clean.evt |
| Size (bytes) | 3,887,259,840 | 670,844,160 |
| Size | 3.6 GB | 639.8 MB |
| Events in quadrant A | 28,508,160 | 4,268,783 |
| Events in quadrant B | 23,475,839 | 4,296,671 |
| Events in quadrant C | 25,423,006 | 4,292,680 |
| Events in quadrant D | 36,973,677 | 4,055,324 |
| Mode M9 | |||
|---|---|---|---|
| Quadrant | BADHDUFLAG | Total packets | Discarded packets |
| A | 0 | 77 | 0 |
| B | 0 | 77 | 0 |
| C | 0 | 77 | 0 |
| D | 0 | 77 | 0 |
| Mode SS | |||
|---|---|---|---|
| Quadrant | BADHDUFLAG | Total packets | Discarded packets |
| A | 0 | 1014 | 0 |
| B | 0 | 1014 | 0 |
| C | 0 | 1010 | 0 |
| D | 0 | 1008 | 0 |
| Mode M0 | |||
|---|---|---|---|
| Quadrant | BADHDUFLAG | Total packets | Discarded packets |
| A | 0 | 117030 | 0 |
| B | 0 | 103280 | 0 |
| C | 0 | 109357 | 0 |
| D | 0 | 143932 | 0 |
| Quadrant | Total seconds | Saturated seconds | Saturation percentage |
|---|---|---|---|
| A | 49587 | 645 | 1.300744% |
| B | 49690 | 550 | 1.106863% |
| C | 49629 | 893 | 1.799351% |
| D | 49588 | 3463 | 6.983544% |
Noise dominated data is calculated using 1-second bins in cleaned event files. If a bin has >2000 counts, and if more than 50% of those come from <1% of pixels, then it is considered to be noise-dominated and hence unusable.
| Quadrant | # 1 sec bins | Bins with >0 counts | Bins with >2000 counts | High rate bins dominated by noise | Noise dominated (total time) | Noise dominated (detector-on time) | Marked lightcurve |
|---|---|---|---|---|---|---|---|
| A | 63941 | 50252 | 13 | 13 | 0.02% | 0.03% | 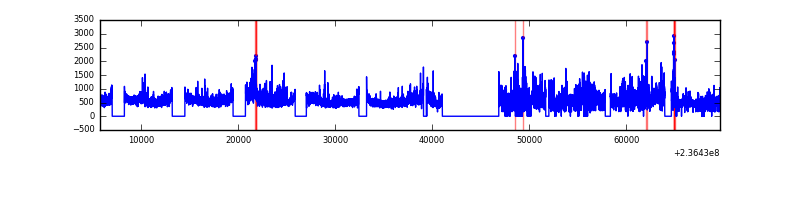 |
| B | 63941 | 50321 | 3 | 3 | 0.00% | 0.01% | 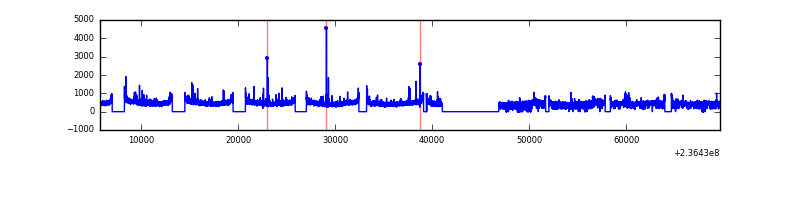 |
| C | 63941 | 50286 | 309 | 309 | 0.48% | 0.61% |  |
| D | 63941 | 50284 | 2679 | 2679 | 4.19% | 5.33% |  |
Top three noisy pixels from each quadrant. If the there are fewer than three noisy pixels in the level2.evt file, extra rows are filled as -1
| Pixel properties | Quadrant properties | ||||||
|---|---|---|---|---|---|---|---|
| Quadrant | DetID | PixID | Counts | Sigma | Mean | Median | Sigma |
| A | 8 | 5 | 4560739 | 3794.1 | 5962 | 5841 | 1200.5 |
| A | 1 | 162 | 540781 | 445.59 | 5962 | 5841 | 1200.5 |
| A | 1 | 178 | 187339 | 151.18 | 5962 | 5841 | 1200.5 |
| B | 4 | 173 | 258087 | 225.57 | 5961 | 5812 | 1118.4 |
| B | 12 | 111 | 128897 | 110.06 | 5961 | 5812 | 1118.4 |
| B | 11 | 111 | 104719 | 88.44 | 5961 | 5812 | 1118.4 |
| C | 4 | 254 | 2117664 | 1585.7 | 5825 | 5873 | 1331.8 |
| C | 9 | 68 | 554702 | 412.1 | 5825 | 5873 | 1331.8 |
| C | 13 | 61 | 43166 | 28.0 | 5825 | 5873 | 1331.8 |
| D | 1 | 52 | 8905220 | 6592.94 | 5641 | 5512 | 1349.9 |
| D | 8 | 195 | 3269975 | 2418.33 | 5641 | 5512 | 1349.9 |
| D | 2 | 136 | 969830 | 714.37 | 5641 | 5512 | 1349.9 |
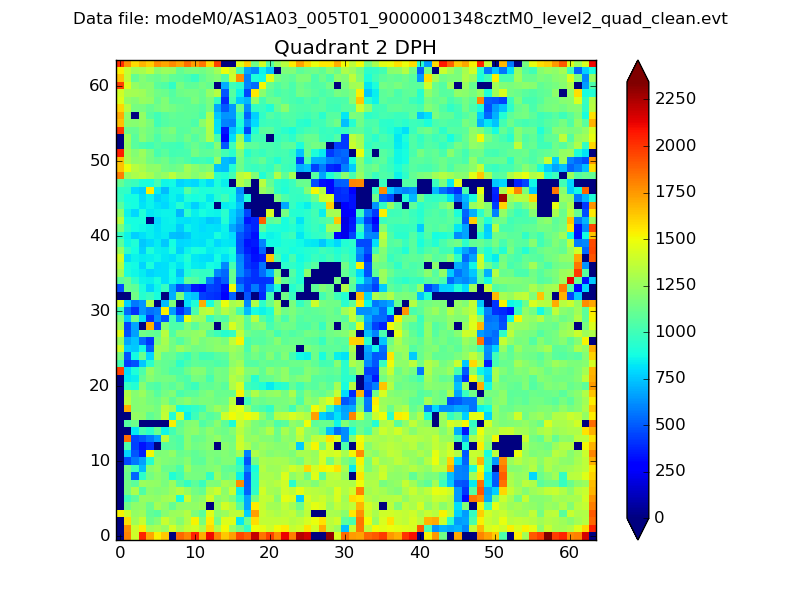
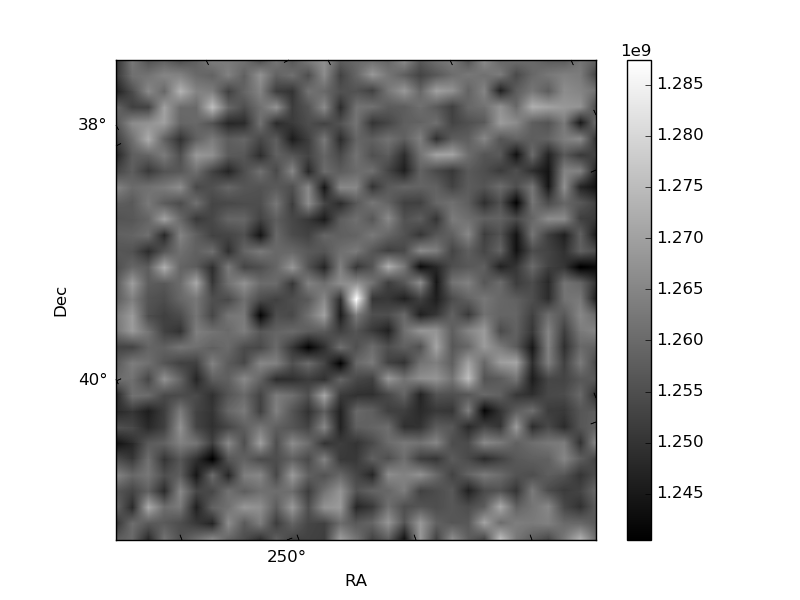
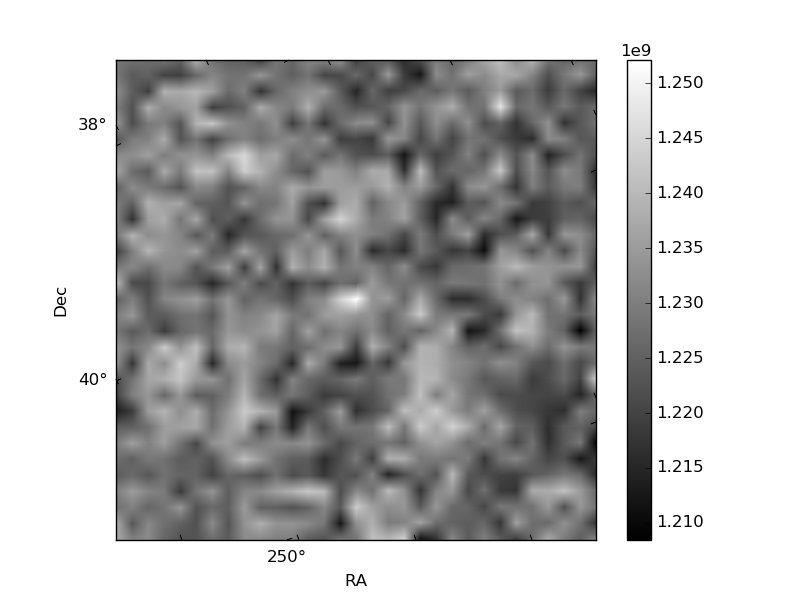
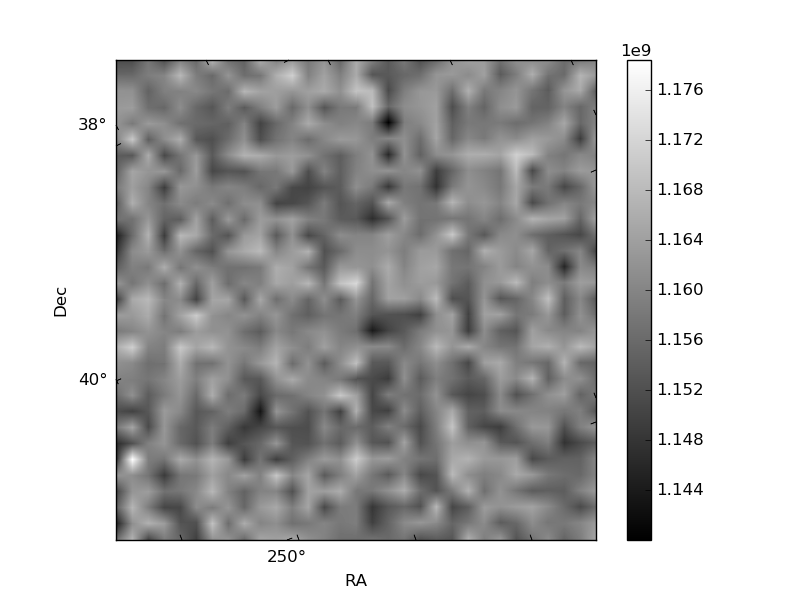
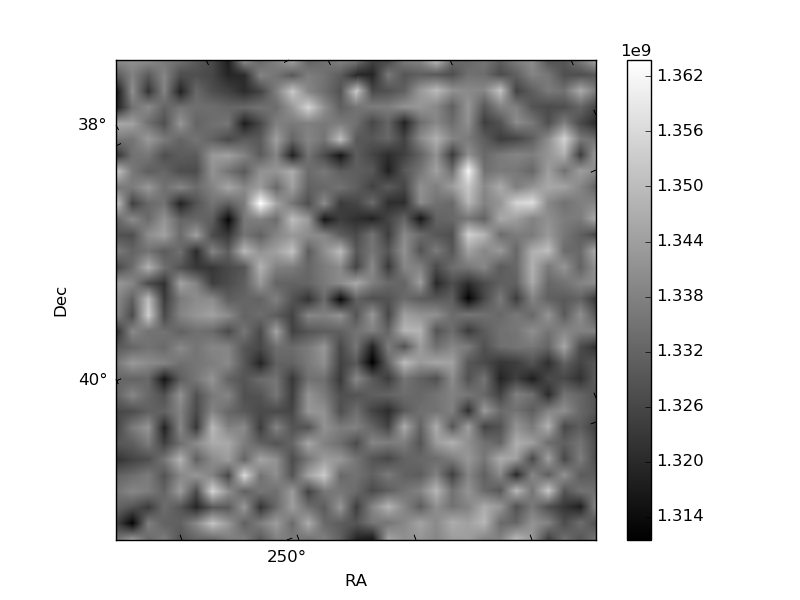
Histogram calculated using DETX and DETY for each event in the final _common_clean file
| Quadrant A | 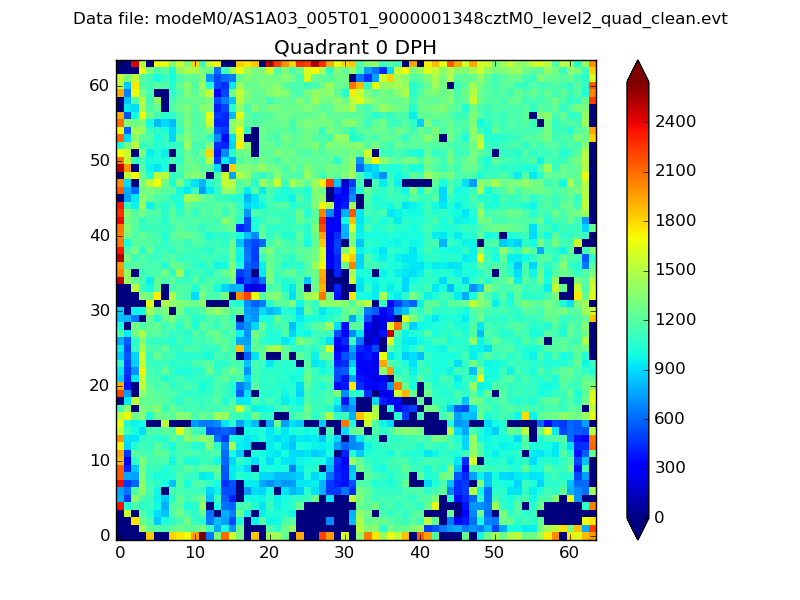 |
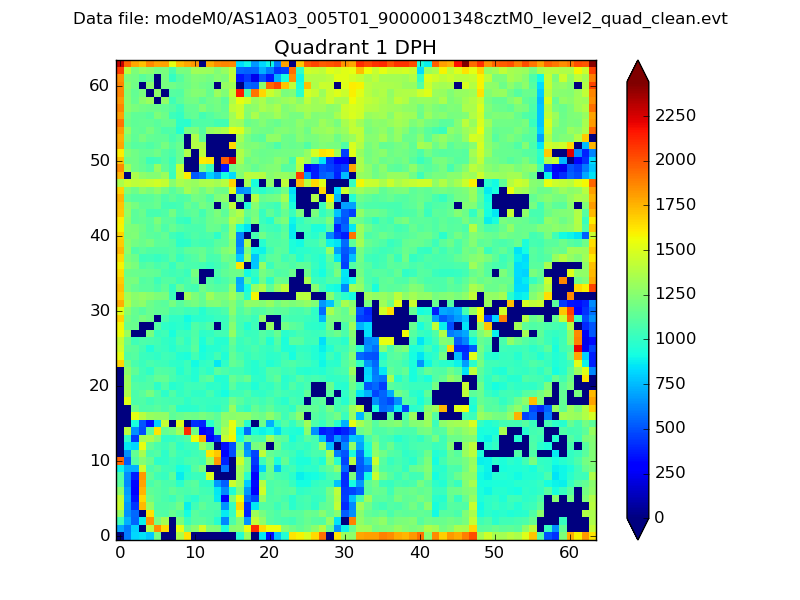 |
Quadrant B |
|---|---|---|---|
| Quadrant D | 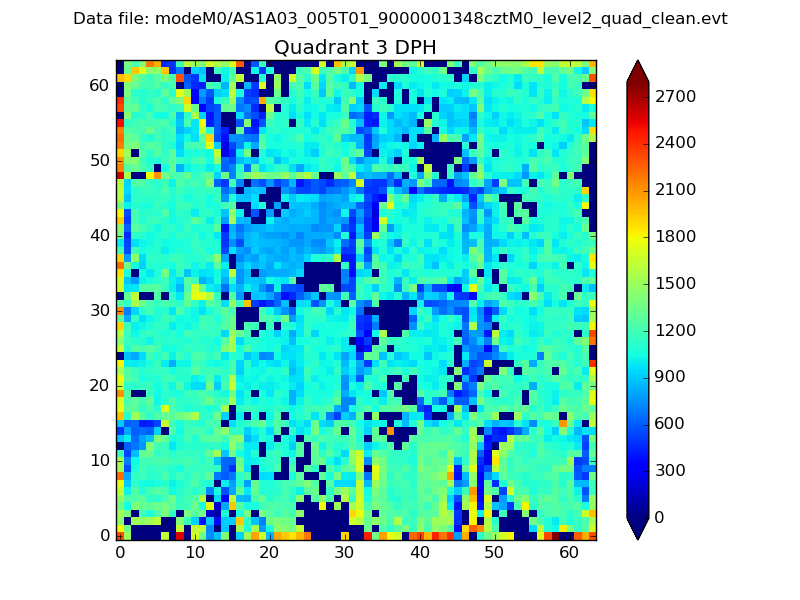 |
 |
Quadrant C |
| Plot type | Count rate plots | Images |
|---|---|---|
| Comparison with Poisson distribution Blue bars denote a histogram of data divided into 1 sec bins. Red curve is a Poisson curve with rate = median count rate of data. |
 |
 |
| Quadrant-wise count rates Data is divided into 100 sec bins |
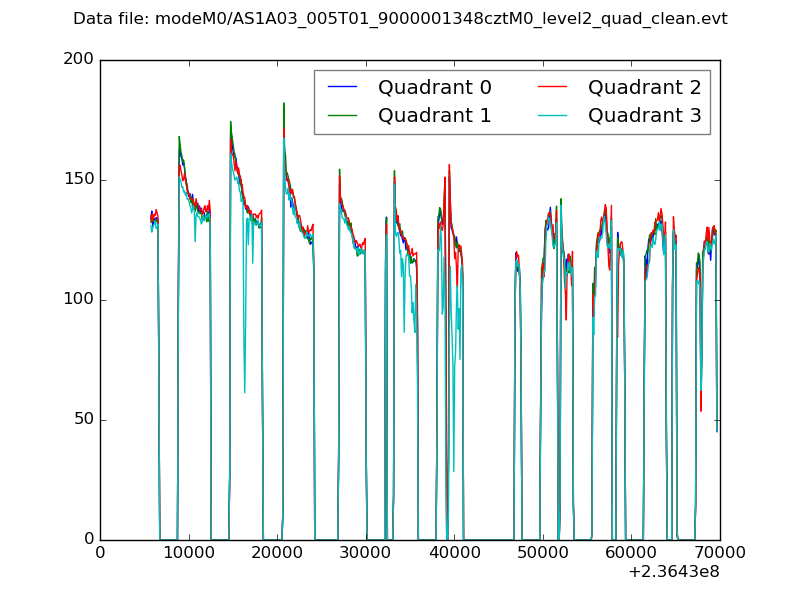 |
|
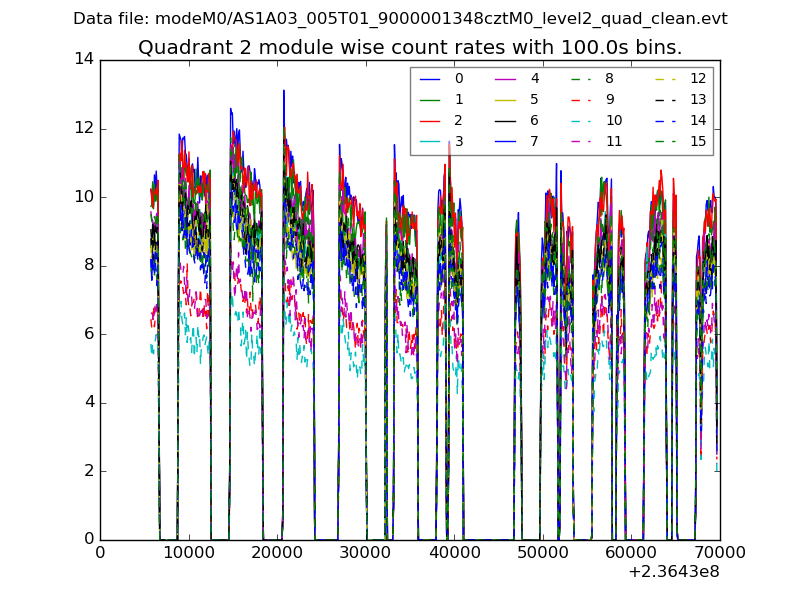
| Module-wise count rates for Quadrant A Data is divided into 100 sec bins |
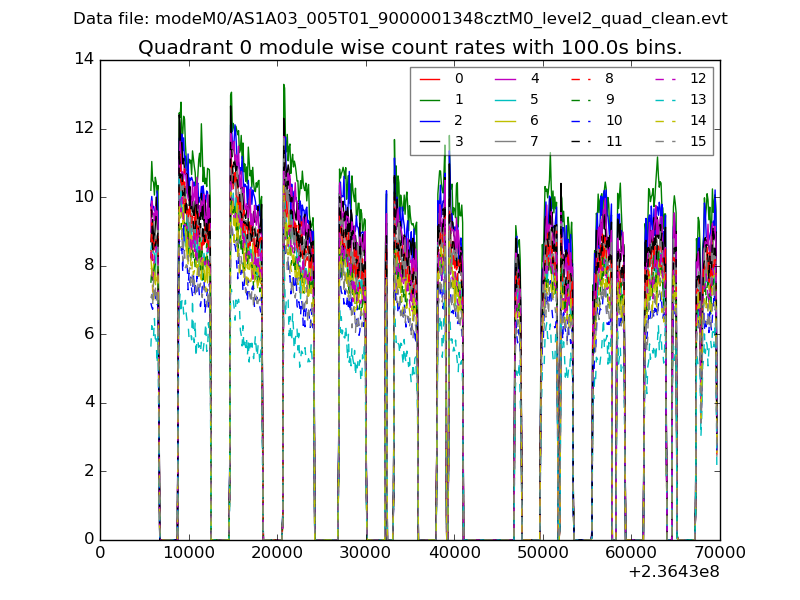 |
 |
| Module-wise count rates for Quadrant B Data is divided into 100 sec bins |
 |
 |
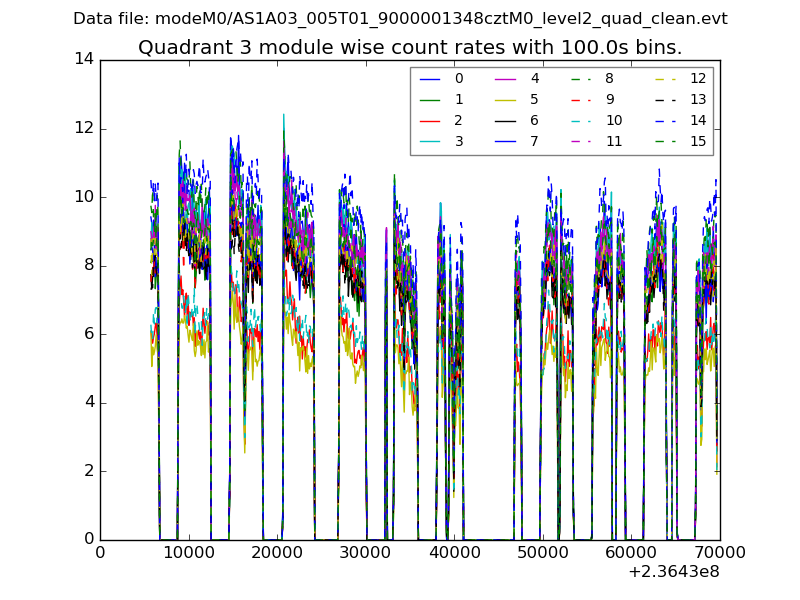
| Module-wise count rates for Quadrant C Data is divided into 100 sec bins |
 |
 |
| Module-wise count rates for Quadrant D Data is divided into 100 sec bins |
 |
 |
| Parameter | Plot |
|---|---|
| CZT HV Monitor | 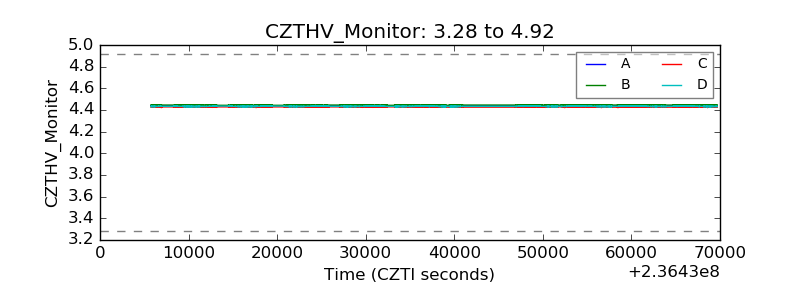 |
| D_VDD | 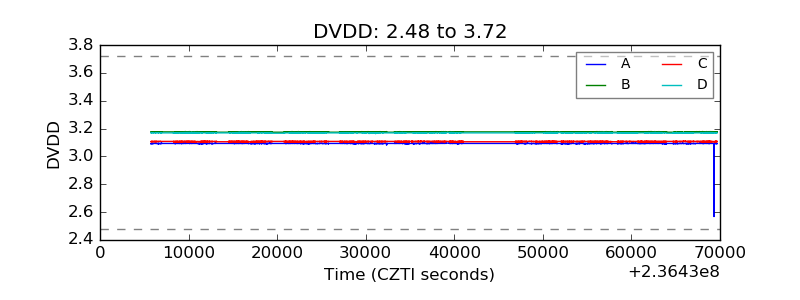 |
| Temperature 1 | 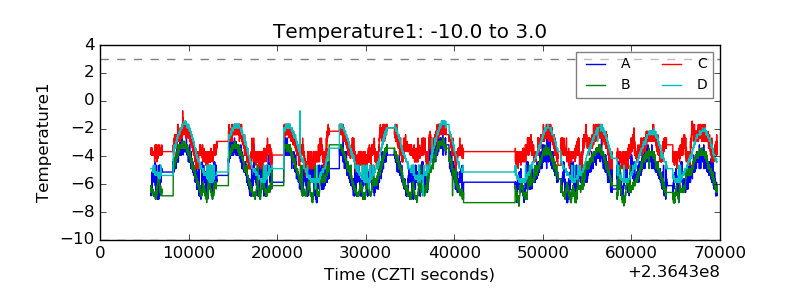 |
| Veto HV Monitor | 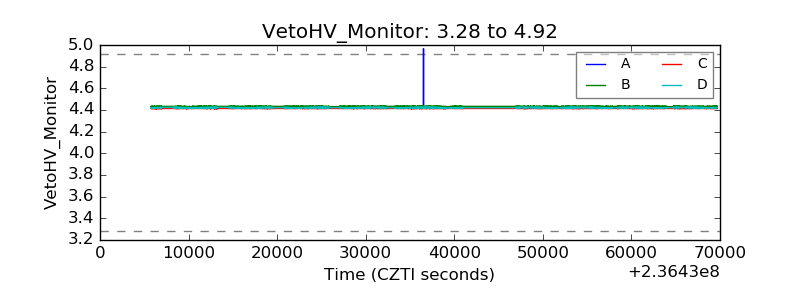 |
| Veto LLD |  |
| Alpha Counter | 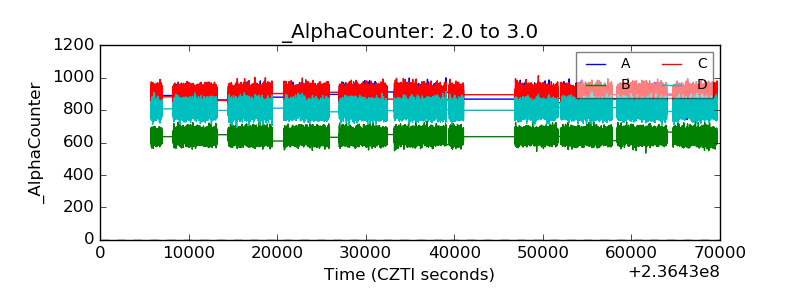 |
| _CPM_Rate |  |
| CZT Counter |  |
| +2.5 Volts monitor |  |
| +5 Volts monitor | 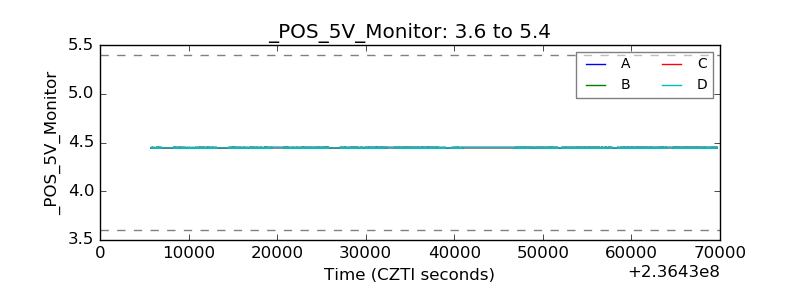 |
| _ROLL_ROT |  |
| _Roll_DEC |  |
| _Roll_RA | 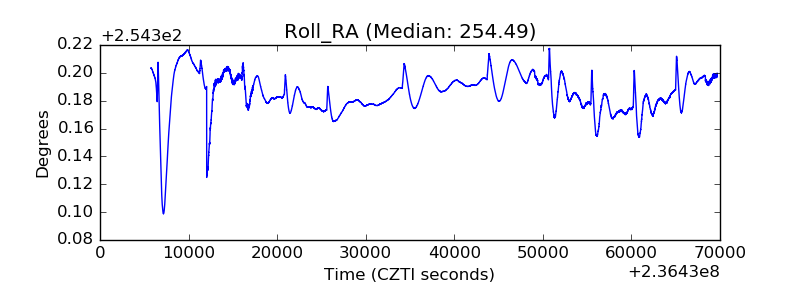 |
| Veto Counter | 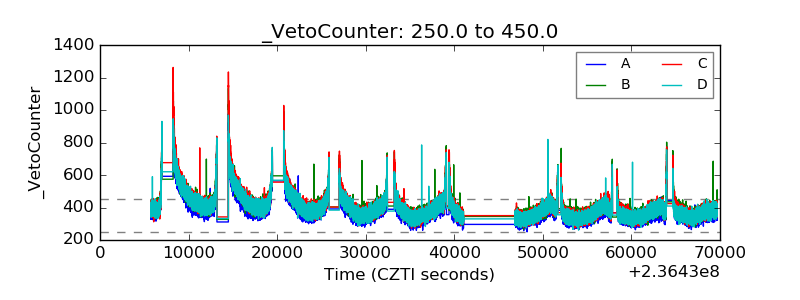 |