| Param | Original file | Final file |
|---|---|---|
| Filename | modeM0/AS1A03_053T01_9000001410cztM0_level2.evt | modeM0/AS1A03_053T01_9000001410cztM0_level2_quad_clean.evt |
| Size (bytes) | 3,979,440,000 | 625,242,240 |
| Size | 3.7 GB | 596.3 MB |
| Events in quadrant A | 28,731,415 | 3,853,828 |
| Events in quadrant B | 26,750,171 | 3,962,661 |
| Events in quadrant C | 23,349,291 | 3,936,757 |
| Events in quadrant D | 38,215,987 | 3,649,817 |
| Mode SS | |||
|---|---|---|---|
| Quadrant | BADHDUFLAG | Total packets | Discarded packets |
| A | 0 | 1050 | 0 |
| B | 0 | 1050 | 0 |
| C | 0 | 1050 | 0 |
| D | 0 | 1050 | 0 |
| Mode M0 | |||
|---|---|---|---|
| Quadrant | BADHDUFLAG | Total packets | Discarded packets |
| A | 0 | 120215 | 0 |
| B | 0 | 113418 | 0 |
| C | 0 | 105622 | 0 |
| D | 0 | 147988 | 0 |
| Mode M9 | |||
|---|---|---|---|
| Quadrant | BADHDUFLAG | Total packets | Discarded packets |
| A | 0 | 81 | 0 |
| B | 0 | 81 | 0 |
| C | 0 | 81 | 0 |
| D | 0 | 81 | 0 |
| Quadrant | Total seconds | Saturated seconds | Saturation percentage |
|---|---|---|---|
| A | 51500 | 1792 | 3.479612% |
| B | 51502 | 984 | 1.910605% |
| C | 51509 | 470 | 0.912462% |
| D | 51485 | 2222 | 4.315820% |
Noise dominated data is calculated using 1-second bins in cleaned event files. If a bin has >2000 counts, and if more than 50% of those come from <1% of pixels, then it is considered to be noise-dominated and hence unusable.
| Quadrant | # 1 sec bins | Bins with >0 counts | Bins with >2000 counts | High rate bins dominated by noise | Noise dominated (total time) | Noise dominated (detector-on time) | Marked lightcurve |
|---|---|---|---|---|---|---|---|
| A | 64435 | 51611 | 1080 | 1080 | 1.68% | 2.09% |  |
| B | 64435 | 51610 | 156 | 156 | 0.24% | 0.30% |  |
| C | 64435 | 51612 | 1 | 1 | 0.00% | 0.00% | 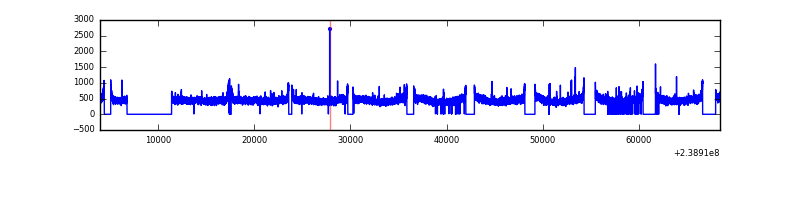 |
| D | 64435 | 51610 | 1758 | 1758 | 2.73% | 3.41% |  |
Top three noisy pixels from each quadrant. If the there are fewer than three noisy pixels in the level2.evt file, extra rows are filled as -1
| Pixel properties | Quadrant properties | ||||||
|---|---|---|---|---|---|---|---|
| Quadrant | DetID | PixID | Counts | Sigma | Mean | Median | Sigma |
| A | 15 | 239 | 3894876 | 3168.25 | 6082 | 5961 | 1227.5 |
| A | 14 | 254 | 1191308 | 965.69 | 6082 | 5961 | 1227.5 |
| A | 15 | 174 | 118276 | 91.5 | 6082 | 5961 | 1227.5 |
| B | 4 | 81 | 1328673 | 1124.51 | 6168 | 6027 | 1176.2 |
| B | 4 | 239 | 500231 | 420.17 | 6168 | 6027 | 1176.2 |
| B | 0 | 214 | 313336 | 261.27 | 6168 | 6027 | 1176.2 |
| C | 13 | 61 | 44960 | 28.28 | 5961 | 5993 | 1378.0 |
| C | 14 | 67 | 38961 | 23.92 | 5961 | 5993 | 1378.0 |
| C | 12 | 4 | 33295 | 19.81 | 5961 | 5993 | 1378.0 |
| D | 8 | 195 | 5071022 | 3573.73 | 5823 | 5685 | 1417.4 |
| D | 2 | 16 | 3333773 | 2348.05 | 5823 | 5685 | 1417.4 |
| D | 1 | 52 | 2205860 | 1552.28 | 5823 | 5685 | 1417.4 |
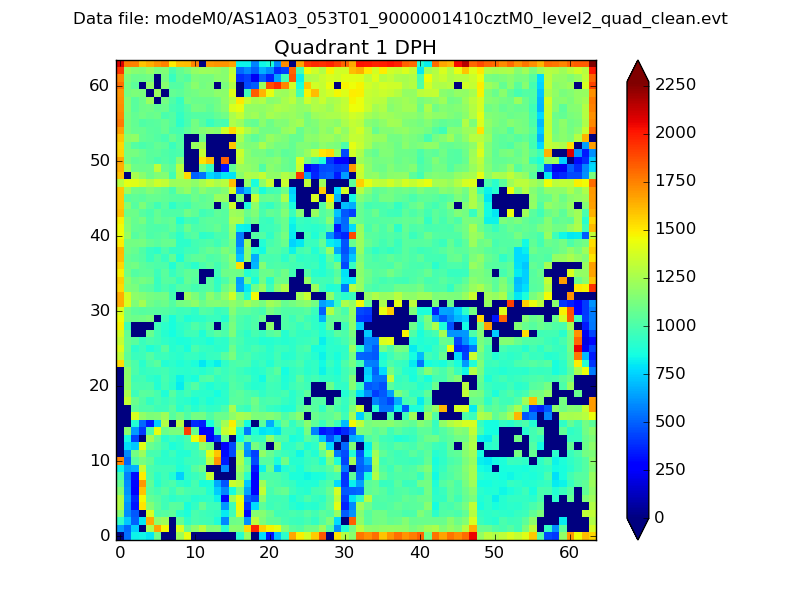
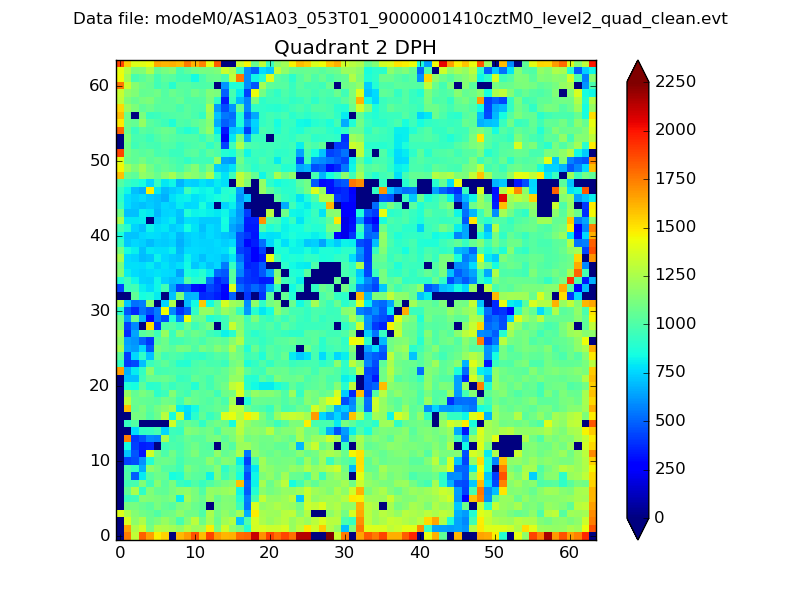
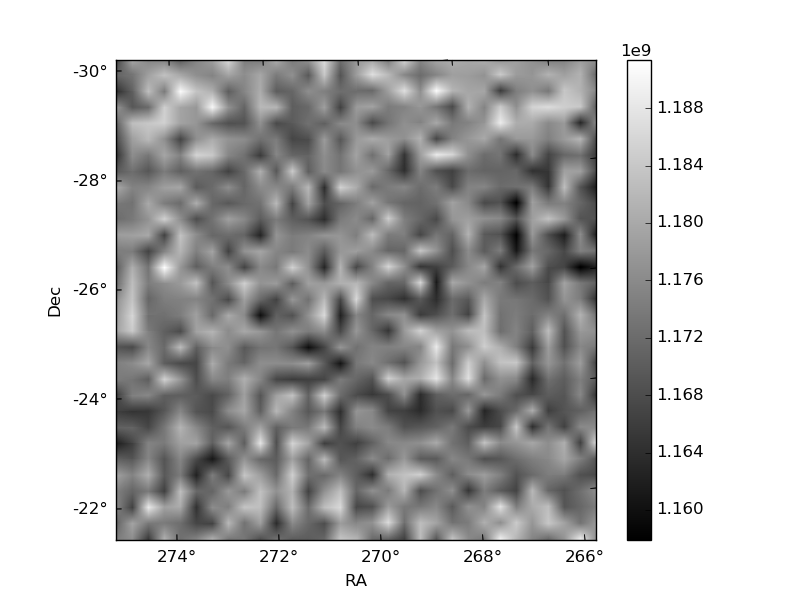
Histogram calculated using DETX and DETY for each event in the final _common_clean file
| Quadrant A |  |
 |
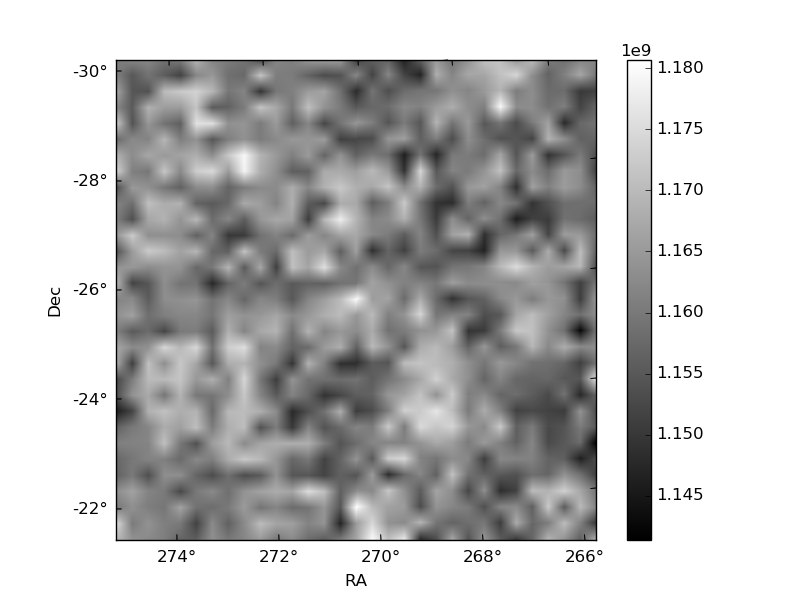
Quadrant B |
|---|---|---|---|
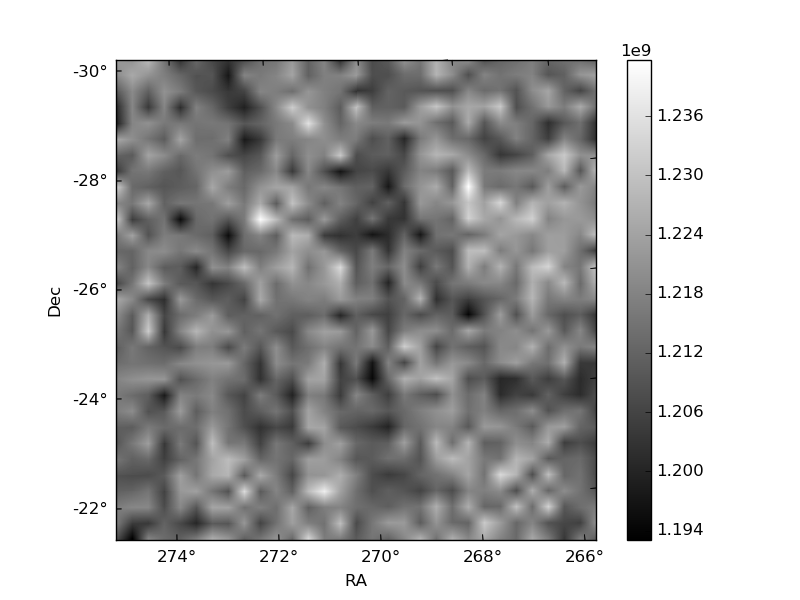
| Quadrant D |  |
 |
Quadrant C |
| Plot type | Count rate plots | Images |
|---|---|---|
| Comparison with Poisson distribution Blue bars denote a histogram of data divided into 1 sec bins. Red curve is a Poisson curve with rate = median count rate of data. |
 |
 |
| Quadrant-wise count rates Data is divided into 100 sec bins |
 |
|
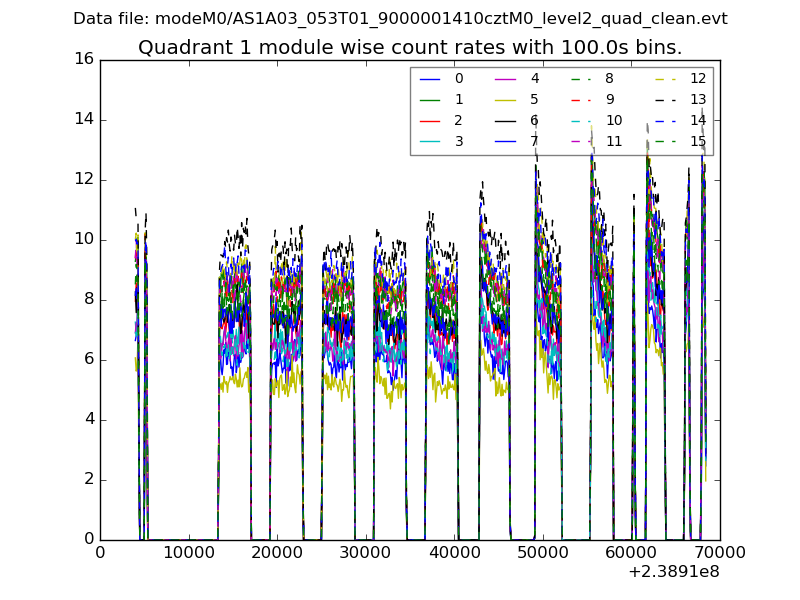
| Module-wise count rates for Quadrant A Data is divided into 100 sec bins |
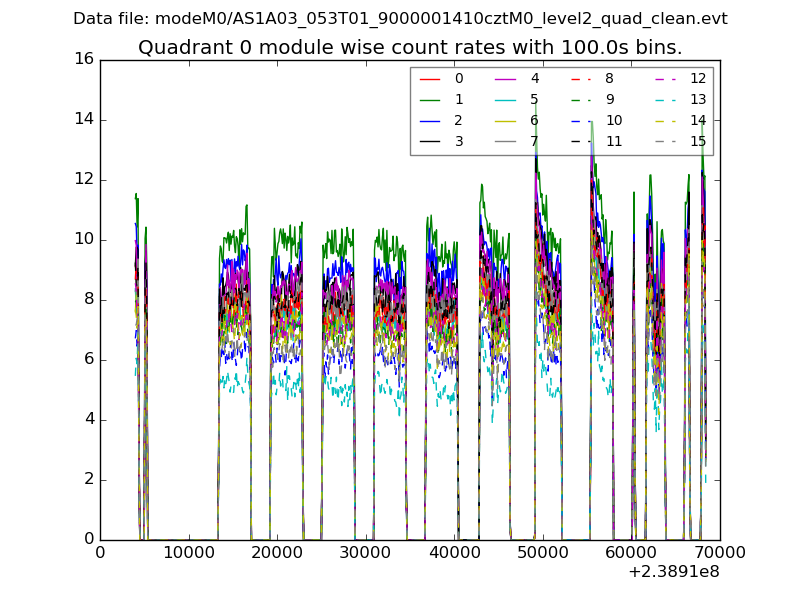 |
 |
| Module-wise count rates for Quadrant B Data is divided into 100 sec bins |
 |
 |
| Module-wise count rates for Quadrant C Data is divided into 100 sec bins |
 |
 |
| Module-wise count rates for Quadrant D Data is divided into 100 sec bins |
 |
 |
| Parameter | Plot |
|---|---|
| CZT HV Monitor |  |
| D_VDD | 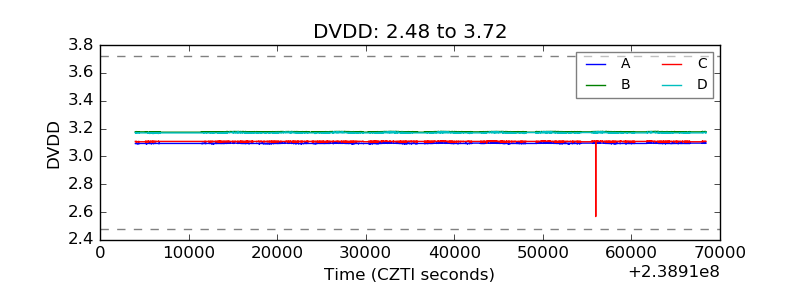 |
| Temperature 1 |  |
| Veto HV Monitor | 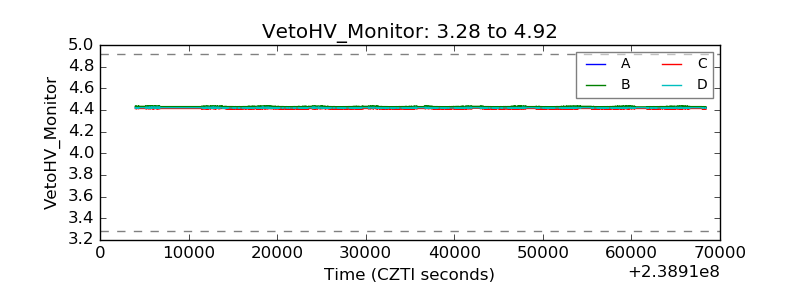 |
| Veto LLD | 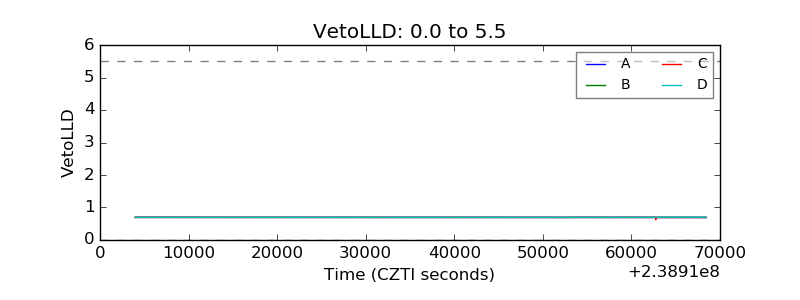 |
| Alpha Counter | 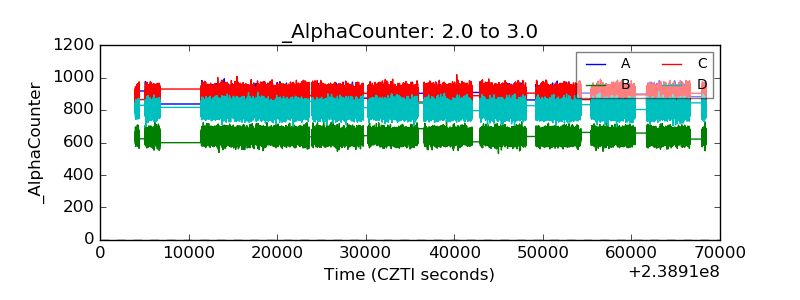 |
| _CPM_Rate |  |
| CZT Counter |  |
| +2.5 Volts monitor |  |
| +5 Volts monitor |  |
| _ROLL_ROT | 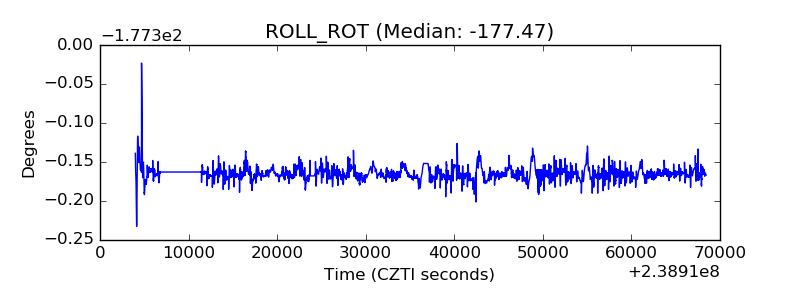 |
| _Roll_DEC |  |
| _Roll_RA |  |
| Veto Counter |  |