| Param | Original file | Final file |
|---|---|---|
| Filename | modeM0/AS1A03_008T01_9000001442cztM0_level2.evt | modeM0/AS1A03_008T01_9000001442cztM0_level2_quad_clean.evt |
| Size (bytes) | 1,718,326,080 | 316,840,320 |
| Size | 1.6 GB | 302.2 MB |
| Events in quadrant A | 12,409,057 | 1,957,247 |
| Events in quadrant B | 12,426,271 | 1,991,258 |
| Events in quadrant C | 11,947,338 | 1,938,374 |
| Events in quadrant D | 13,446,388 | 1,868,299 |
| Mode M9 | |||
|---|---|---|---|
| Quadrant | BADHDUFLAG | Total packets | Discarded packets |
| A | 0 | 15 | 0 |
| B | 0 | 15 | 0 |
| C | 0 | 15 | 0 |
| D | 0 | 15 | 0 |
| Mode M0 | |||
|---|---|---|---|
| Quadrant | BADHDUFLAG | Total packets | Discarded packets |
| A | 0 | 55314 | 0 |
| B | 0 | 55186 | 0 |
| C | 0 | 54789 | 0 |
| D | 0 | 59129 | 0 |
| Mode SS | |||
|---|---|---|---|
| Quadrant | BADHDUFLAG | Total packets | Discarded packets |
| A | 0 | 546 | 0 |
| B | 0 | 546 | 0 |
| C | 0 | 546 | 0 |
| D | 0 | 546 | 0 |
| Quadrant | Total seconds | Saturated seconds | Saturation percentage |
|---|---|---|---|
| A | 26764 | 233 | 0.870572% |
| B | 26764 | 293 | 1.094754% |
| C | 26764 | 112 | 0.418473% |
| D | 26764 | 353 | 1.318936% |
Noise dominated data is calculated using 1-second bins in cleaned event files. If a bin has >2000 counts, and if more than 50% of those come from <1% of pixels, then it is considered to be noise-dominated and hence unusable.
| Quadrant | # 1 sec bins | Bins with >0 counts | Bins with >2000 counts | High rate bins dominated by noise | Noise dominated (total time) | Noise dominated (detector-on time) | Marked lightcurve |
|---|---|---|---|---|---|---|---|
| A | 28345 | 26766 | 19 | 19 | 0.07% | 0.07% |  |
| B | 28345 | 26766 | 17 | 17 | 0.06% | 0.06% | 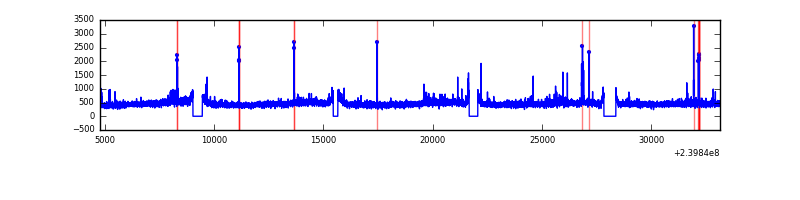 |
| C | 28345 | 26767 | 14 | 14 | 0.05% | 0.05% | 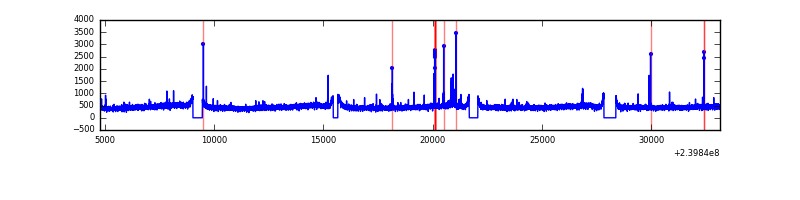 |
| D | 28345 | 26767 | 206 | 206 | 0.73% | 0.77% |  |
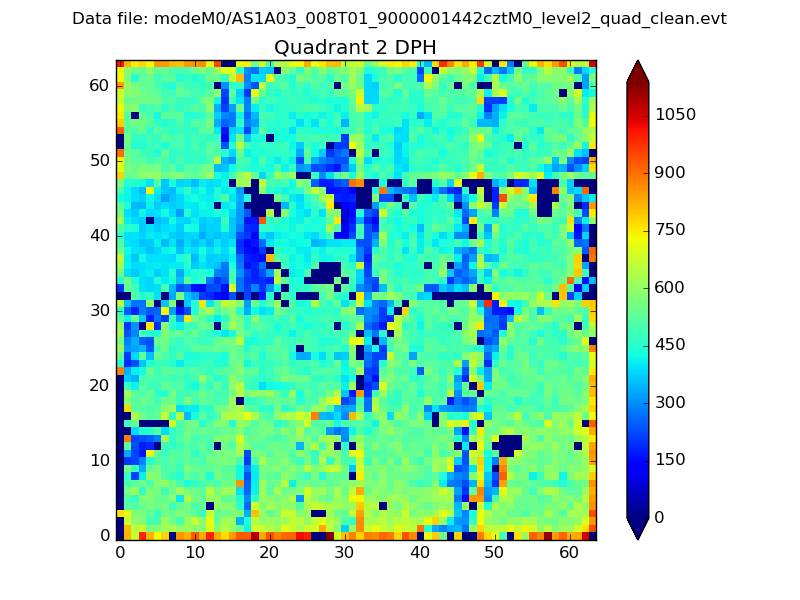
Top three noisy pixels from each quadrant. If the there are fewer than three noisy pixels in the level2.evt file, extra rows are filled as -1
| Pixel properties | Quadrant properties | ||||||
|---|---|---|---|---|---|---|---|
| Quadrant | DetID | PixID | Counts | Sigma | Mean | Median | Sigma |
| A | 8 | 5 | 349967 | 552.36 | 3090 | 3017 | 628.1 |
| A | 0 | 8 | 76851 | 117.55 | 3090 | 3017 | 628.1 |
| A | 15 | 239 | 62406 | 94.55 | 3090 | 3017 | 628.1 |
| B | 0 | 214 | 232493 | 385.91 | 3107 | 3029 | 594.6 |
| B | 12 | 111 | 67850 | 109.02 | 3107 | 3029 | 594.6 |
| B | 4 | 239 | 62051 | 99.26 | 3107 | 3029 | 594.6 |
| C | 7 | 247 | 91077 | 127.25 | 3007 | 3018 | 692.0 |
| C | 14 | 234 | 62028 | 85.27 | 3007 | 3018 | 692.0 |
| C | 14 | 67 | 37840 | 50.32 | 3007 | 3018 | 692.0 |
| D | 1 | 52 | 708281 | 929.52 | 2975 | 2902 | 758.9 |
| D | 2 | 16 | 437077 | 572.14 | 2975 | 2902 | 758.9 |
| D | 10 | 199 | 221088 | 287.51 | 2975 | 2902 | 758.9 |
Histogram calculated using DETX and DETY for each event in the final _common_clean file
| Quadrant A | 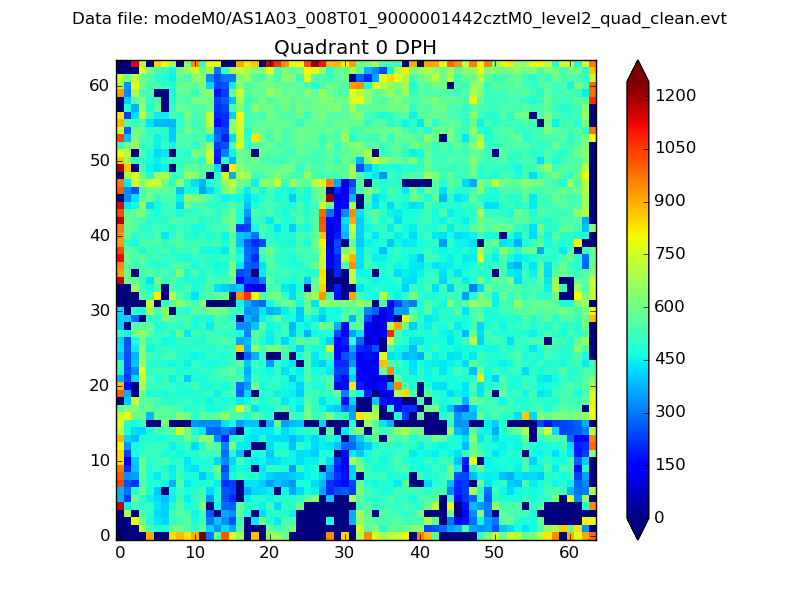 |
 |
Quadrant B |
|---|---|---|---|
| Quadrant D |  |
 |
Quadrant C |
| Plot type | Count rate plots | Images |
|---|---|---|
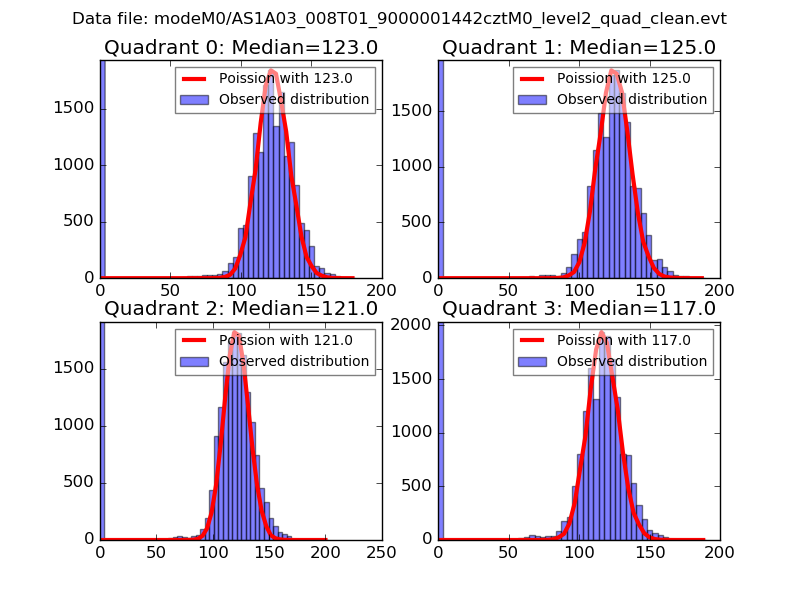
| Comparison with Poisson distribution Blue bars denote a histogram of data divided into 1 sec bins. Red curve is a Poisson curve with rate = median count rate of data. |
 |
 |
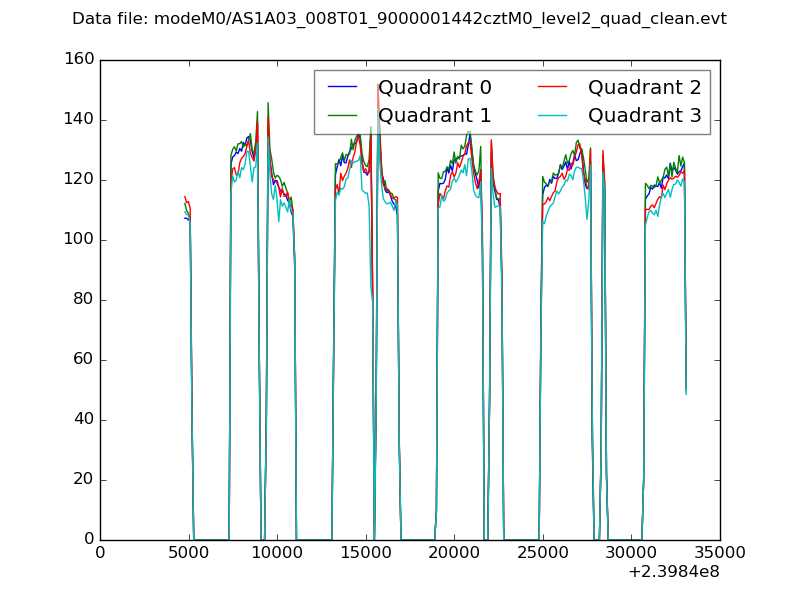
| Quadrant-wise count rates Data is divided into 100 sec bins |
 |
|
| Module-wise count rates for Quadrant A Data is divided into 100 sec bins |
 |
 |
| Module-wise count rates for Quadrant B Data is divided into 100 sec bins |
 |
 |
| Module-wise count rates for Quadrant C Data is divided into 100 sec bins |
 |
 |
| Module-wise count rates for Quadrant D Data is divided into 100 sec bins |
 |
 |
| Parameter | Plot |
|---|---|
| CZT HV Monitor |  |
| D_VDD | 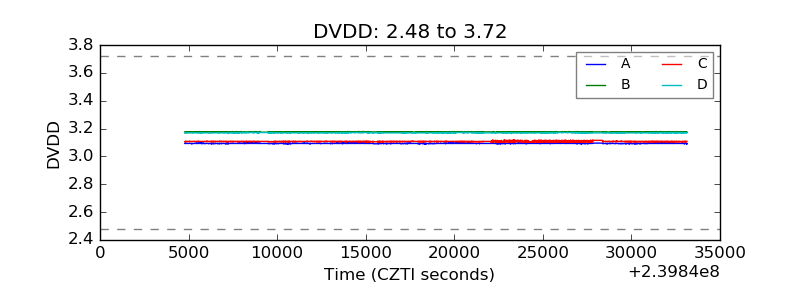 |
| Temperature 1 |  |
| Veto HV Monitor |  |
| Veto LLD |  |
| Alpha Counter | 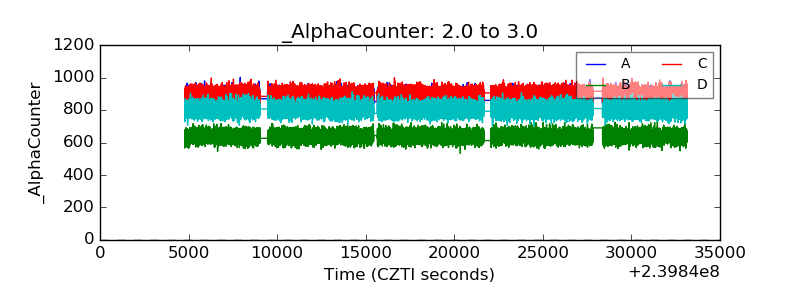 |
| _CPM_Rate | 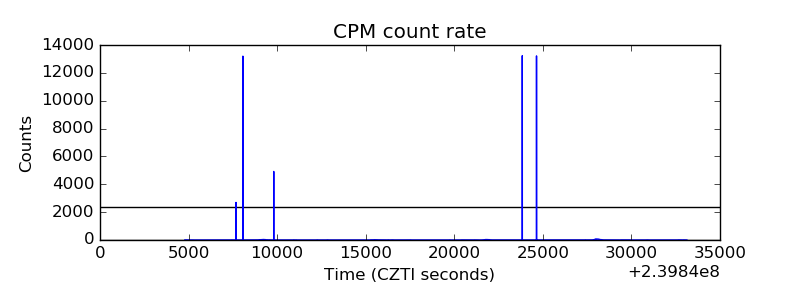 |
| CZT Counter |  |
| +2.5 Volts monitor |  |
| +5 Volts monitor | 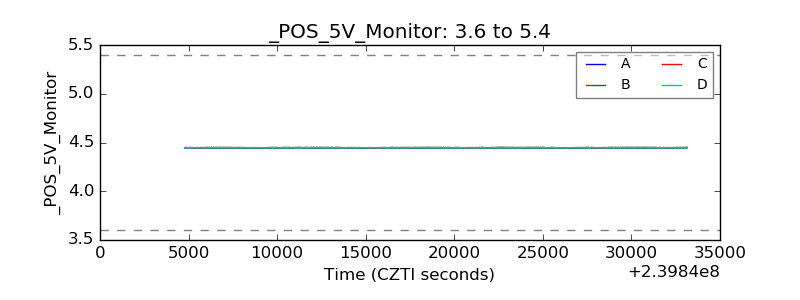 |
| _ROLL_ROT |  |
| _Roll_DEC |  |
| _Roll_RA |  |
| Veto Counter | 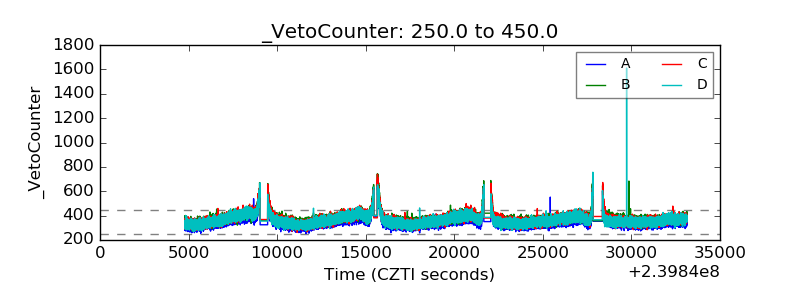 |