| Param | Original file | Final file |
|---|---|---|
| Filename | modeM0/AS1A03_044T03_9000001446cztM0_level2.evt | modeM0/AS1A03_044T03_9000001446cztM0_level2_quad_clean.evt |
| Size (bytes) | 541,742,400 | 107,124,480 |
| Size | 516.6 MB | 102.2 MB |
| Events in quadrant A | 3,505,581 | 684,987 |
| Events in quadrant B | 3,645,028 | 698,590 |
| Events in quadrant C | 3,357,941 | 684,556 |
| Events in quadrant D | 5,381,870 | 647,394 |
| Mode SS | |||
|---|---|---|---|
| Quadrant | BADHDUFLAG | Total packets | Discarded packets |
| A | 0 | 150 | 0 |
| B | 0 | 154 | 0 |
| C | 0 | 152 | 0 |
| D | 0 | 154 | 0 |
| Mode M9 | |||
|---|---|---|---|
| Quadrant | BADHDUFLAG | Total packets | Discarded packets |
| A | 0 | 14 | 0 |
| B | 0 | 16 | 0 |
| C | 0 | 15 | 0 |
| D | 0 | 14 | 0 |
| Mode M0 | |||
|---|---|---|---|
| Quadrant | BADHDUFLAG | Total packets | Discarded packets |
| A | 0 | 15747 | 0 |
| B | 0 | 16098 | 0 |
| C | 0 | 15554 | 0 |
| D | 0 | 21077 | 0 |
| Quadrant | Total seconds | Saturated seconds | Saturation percentage |
|---|---|---|---|
| A | 7615 | 64 | 0.840446% |
| B | 7633 | 67 | 0.877768% |
| C | 7621 | 45 | 0.590474% |
| D | 7562 | 191 | 2.525787% |
Noise dominated data is calculated using 1-second bins in cleaned event files. If a bin has >2000 counts, and if more than 50% of those come from <1% of pixels, then it is considered to be noise-dominated and hence unusable.
| Quadrant | # 1 sec bins | Bins with >0 counts | Bins with >2000 counts | High rate bins dominated by noise | Noise dominated (total time) | Noise dominated (detector-on time) | Marked lightcurve |
|---|---|---|---|---|---|---|---|
| A | 10985 | 7761 | 0 | 0 | 0.00% | 0.00% | 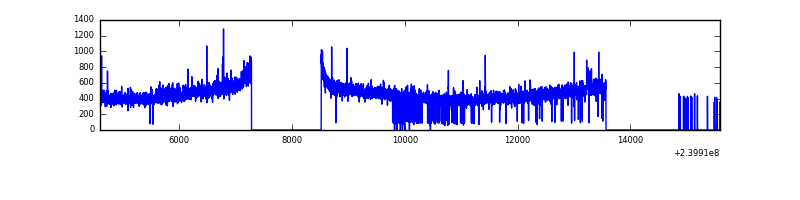 |
| B | 10987 | 7775 | 8 | 8 | 0.07% | 0.10% |  |
| C | 10985 | 7764 | 0 | 0 | 0.00% | 0.00% | 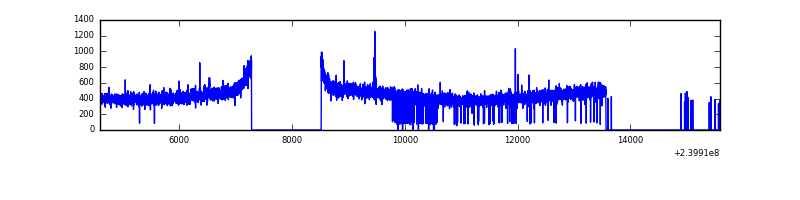 |
| D | 10985 | 7715 | 106 | 106 | 0.96% | 1.37% |  |
Top three noisy pixels from each quadrant. If the there are fewer than three noisy pixels in the level2.evt file, extra rows are filled as -1
| Pixel properties | Quadrant properties | ||||||
|---|---|---|---|---|---|---|---|
| Quadrant | DetID | PixID | Counts | Sigma | Mean | Median | Sigma |
| A | 8 | 15 | 69903 | 387.68 | 881 | 863 | 178.1 |
| A | 0 | 8 | 24901 | 134.98 | 881 | 863 | 178.1 |
| A | 8 | 5 | 17468 | 93.24 | 881 | 863 | 178.1 |
| B | 4 | 81 | 74905 | 438.74 | 888 | 868 | 168.7 |
| B | 4 | 239 | 37974 | 219.89 | 888 | 868 | 168.7 |
| B | 0 | 214 | 37394 | 216.45 | 888 | 868 | 168.7 |
| C | 4 | 239 | 8833 | 40.34 | 854 | 858 | 197.7 |
| C | 14 | 67 | 7323 | 32.7 | 854 | 858 | 197.7 |
| C | 14 | 234 | 7263 | 32.4 | 854 | 858 | 197.7 |
| D | 2 | 16 | 887114 | 3972.96 | 834 | 816 | 223.1 |
| D | 8 | 195 | 620639 | 2778.45 | 834 | 816 | 223.1 |
| D | 2 | 152 | 162900 | 726.56 | 834 | 816 | 223.1 |
Histogram calculated using DETX and DETY for each event in the final _common_clean file
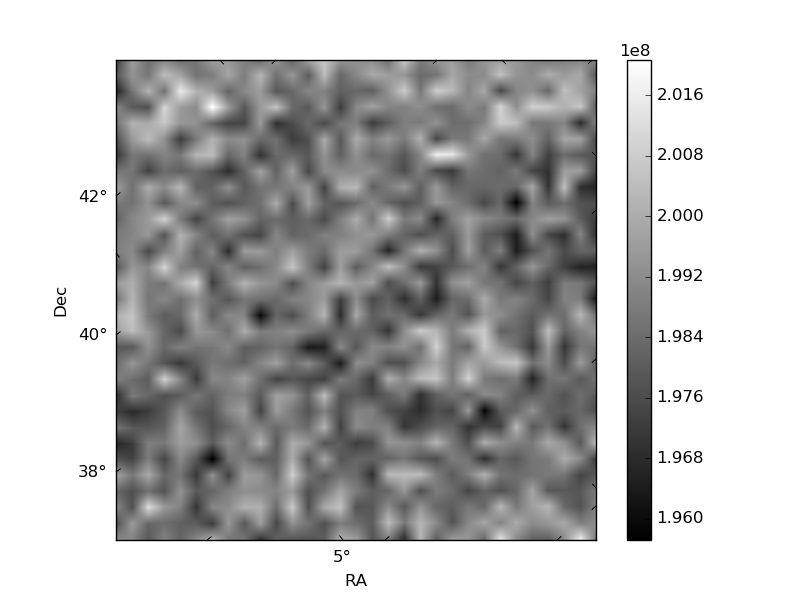
| Quadrant A | 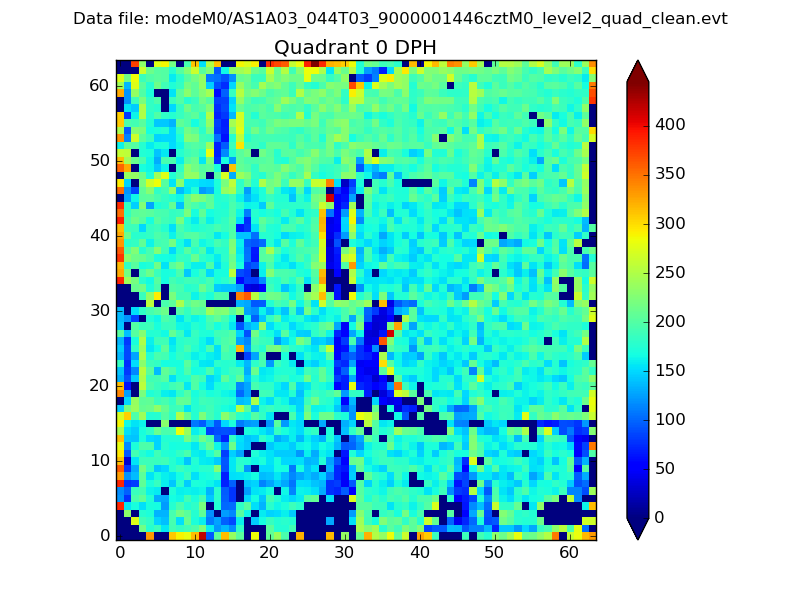 |
 |
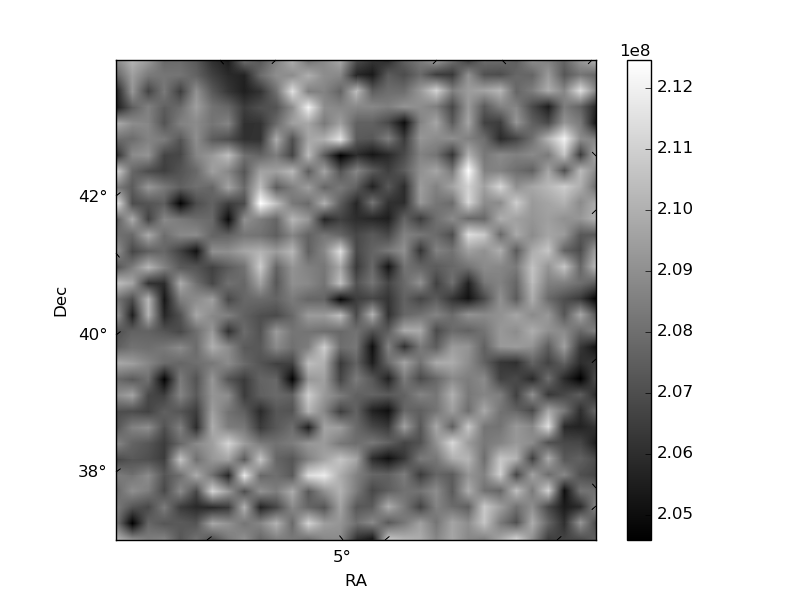
Quadrant B |
|---|---|---|---|
| Quadrant D |  |
 |
Quadrant C |
| Plot type | Count rate plots | Images |
|---|---|---|
| Comparison with Poisson distribution Blue bars denote a histogram of data divided into 1 sec bins. Red curve is a Poisson curve with rate = median count rate of data. |
 |
 |
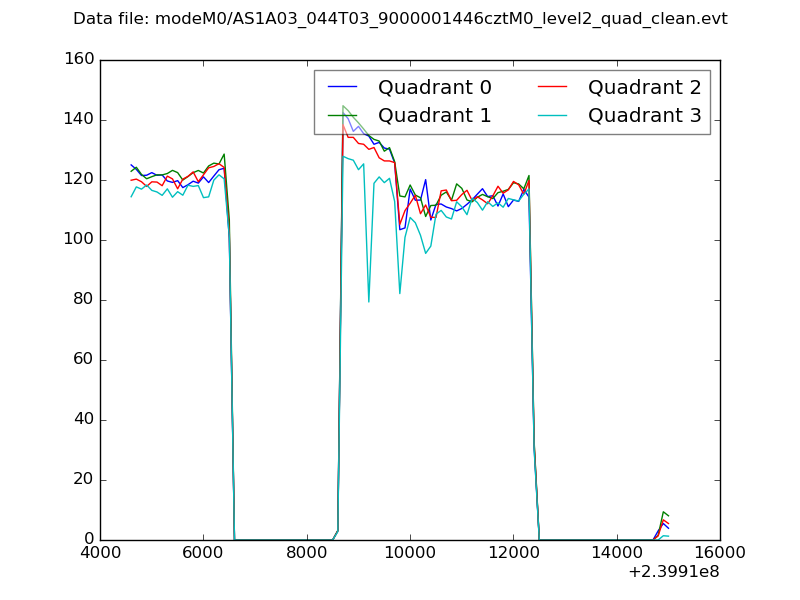
| Quadrant-wise count rates Data is divided into 100 sec bins |
 |
|
| Module-wise count rates for Quadrant A Data is divided into 100 sec bins |
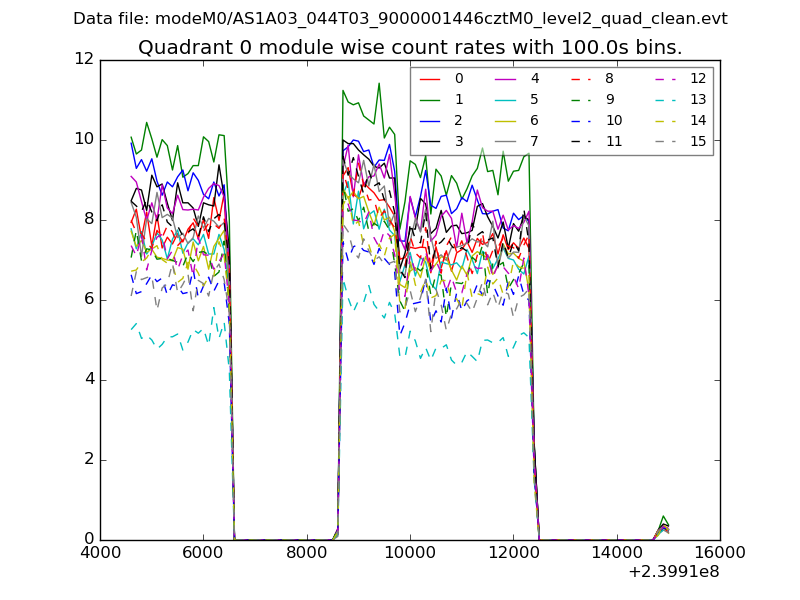 |
 |
| Module-wise count rates for Quadrant B Data is divided into 100 sec bins |
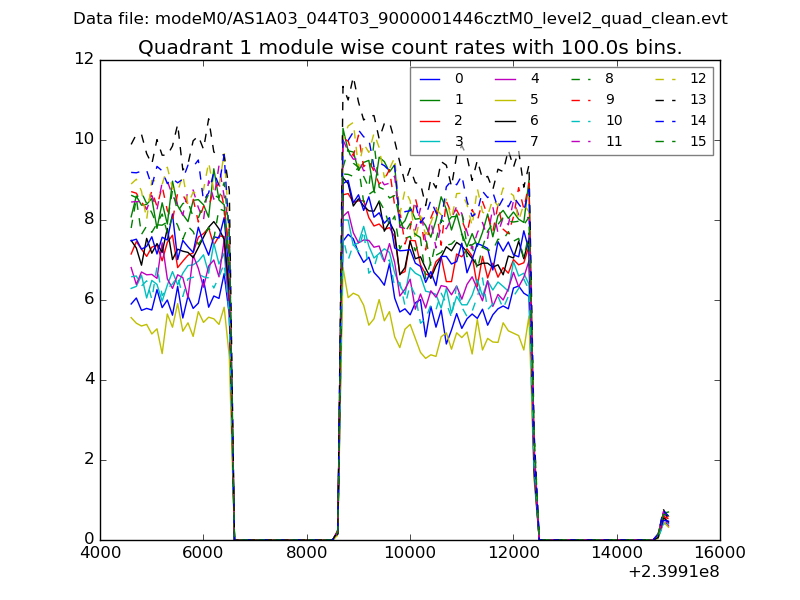 |
 |
| Module-wise count rates for Quadrant C Data is divided into 100 sec bins |
 |
 |
| Module-wise count rates for Quadrant D Data is divided into 100 sec bins |
 |
 |
| Parameter | Plot |
|---|---|
| CZT HV Monitor |  |
| D_VDD |  |
| Temperature 1 |  |
| Veto HV Monitor |  |
| Veto LLD | 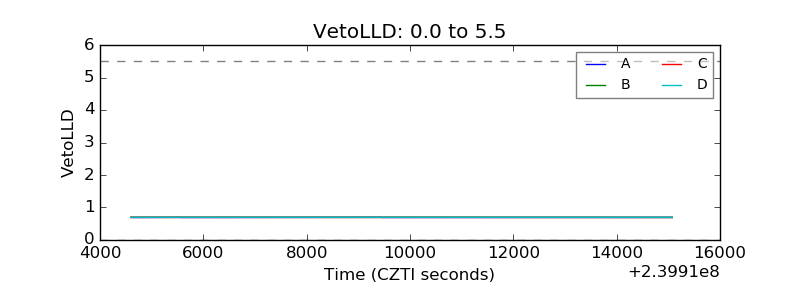 |
| Alpha Counter |  |
| _CPM_Rate | 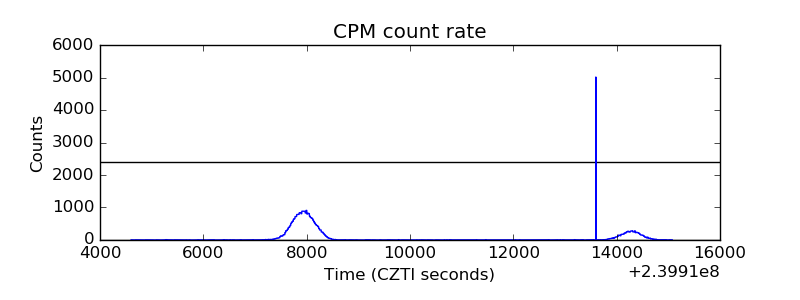 |
| CZT Counter |  |
| +2.5 Volts monitor |  |
| +5 Volts monitor |  |
| _ROLL_ROT |  |
| _Roll_DEC |  |
| _Roll_RA |  |
| Veto Counter | 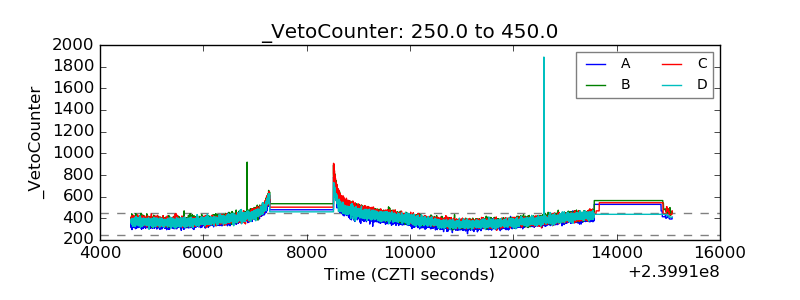 |