| Param | Original file | Final file |
|---|---|---|
| Filename | modeM0/AS1G07_039T01_9000001444cztM0_level2.evt | modeM0/AS1G07_039T01_9000001444cztM0_level2_quad_clean.evt |
| Size (bytes) | 866,842,560 | 186,952,320 |
| Size | 826.7 MB | 178.3 MB |
| Events in quadrant A | 5,800,596 | 1,242,705 |
| Events in quadrant B | 6,296,668 | 1,252,193 |
| Events in quadrant C | 5,486,768 | 1,220,012 |
| Events in quadrant D | 7,885,673 | 1,147,517 |
| Mode M9 | |||
|---|---|---|---|
| Quadrant | BADHDUFLAG | Total packets | Discarded packets |
| A | 0 | 66 | 0 |
| B | 0 | 70 | 0 |
| C | 0 | 69 | 0 |
| D | 0 | 69 | 0 |
| Mode M0 | |||
|---|---|---|---|
| Quadrant | BADHDUFLAG | Total packets | Discarded packets |
| A | 0 | 24877 | 0 |
| B | 0 | 26340 | 0 |
| C | 0 | 24065 | 0 |
| D | 0 | 31186 | 0 |
| Mode SS | |||
|---|---|---|---|
| Quadrant | BADHDUFLAG | Total packets | Discarded packets |
| A | 0 | 234 | 0 |
| B | 0 | 234 | 0 |
| C | 0 | 238 | 0 |
| D | 0 | 232 | 0 |
| Quadrant | Total seconds | Saturated seconds | Saturation percentage |
|---|---|---|---|
| A | 11567 | 134 | 1.158468% |
| B | 11598 | 161 | 1.388170% |
| C | 11590 | 80 | 0.690250% |
| D | 11515 | 242 | 2.101607% |
Noise dominated data is calculated using 1-second bins in cleaned event files. If a bin has >2000 counts, and if more than 50% of those come from <1% of pixels, then it is considered to be noise-dominated and hence unusable.
| Quadrant | # 1 sec bins | Bins with >0 counts | Bins with >2000 counts | High rate bins dominated by noise | Noise dominated (total time) | Noise dominated (detector-on time) | Marked lightcurve |
|---|---|---|---|---|---|---|---|
| A | 19017 | 11798 | 0 | 0 | 0.00% | 0.00% | 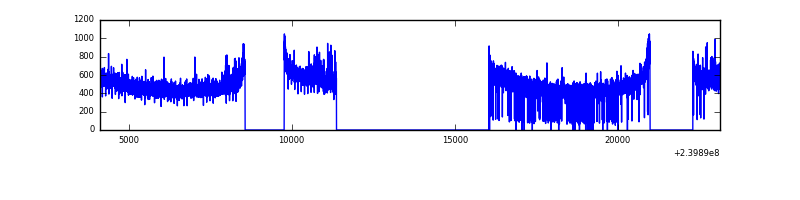 |
| B | 19017 | 11799 | 22 | 22 | 0.12% | 0.19% |  |
| C | 19017 | 11808 | 0 | 0 | 0.00% | 0.00% |  |
| D | 19017 | 11793 | 136 | 136 | 0.72% | 1.15% | 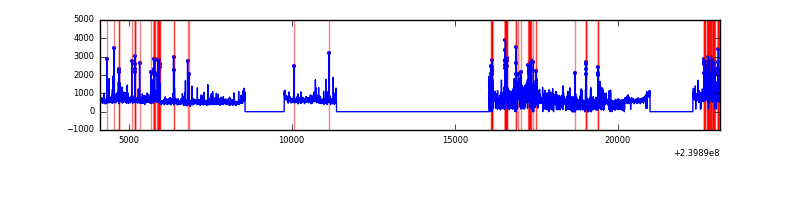 |
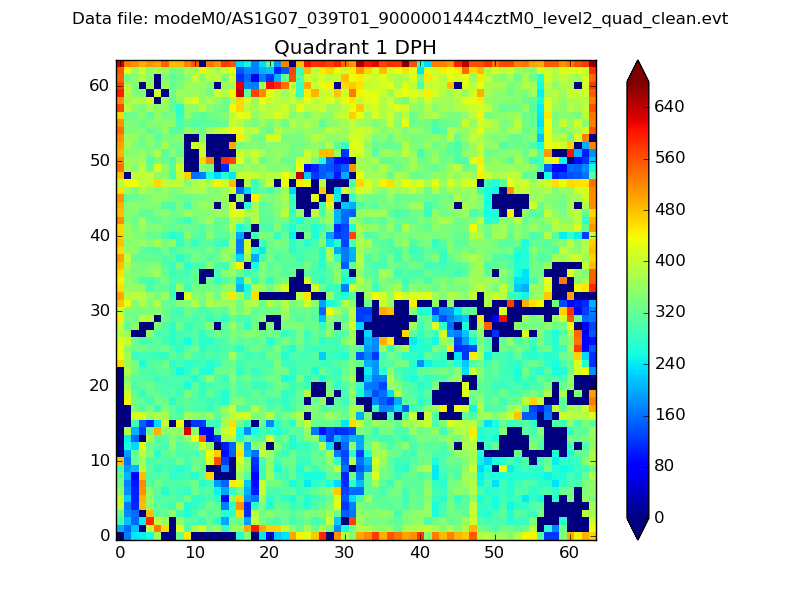
Top three noisy pixels from each quadrant. If the there are fewer than three noisy pixels in the level2.evt file, extra rows are filled as -1
| Pixel properties | Quadrant properties | ||||||
|---|---|---|---|---|---|---|---|
| Quadrant | DetID | PixID | Counts | Sigma | Mean | Median | Sigma |
| A | 8 | 15 | 132954 | 446.98 | 1469 | 1443 | 294.2 |
| A | 0 | 226 | 13781 | 41.93 | 1469 | 1443 | 294.2 |
| A | 0 | 8 | 12908 | 38.97 | 1469 | 1443 | 294.2 |
| B | 0 | 214 | 151281 | 542.99 | 1467 | 1439 | 276.0 |
| B | 4 | 81 | 144598 | 518.77 | 1467 | 1439 | 276.0 |
| B | 10 | 245 | 77457 | 275.47 | 1467 | 1439 | 276.0 |
| C | 13 | 61 | 10719 | 28.89 | 1401 | 1410 | 322.2 |
| C | 8 | 222 | 8768 | 22.84 | 1401 | 1410 | 322.2 |
| C | 14 | 67 | 6574 | 16.03 | 1401 | 1410 | 322.2 |
| D | 2 | 16 | 927532 | 2497.87 | 1383 | 1359 | 370.8 |
| D | 8 | 195 | 718110 | 1933.06 | 1383 | 1359 | 370.8 |
| D | 2 | 152 | 201456 | 539.66 | 1383 | 1359 | 370.8 |
Histogram calculated using DETX and DETY for each event in the final _common_clean file
| Quadrant A |  |
 |
Quadrant B |
|---|---|---|---|
| Quadrant D |  |
 |
Quadrant C |
| Plot type | Count rate plots | Images |
|---|---|---|
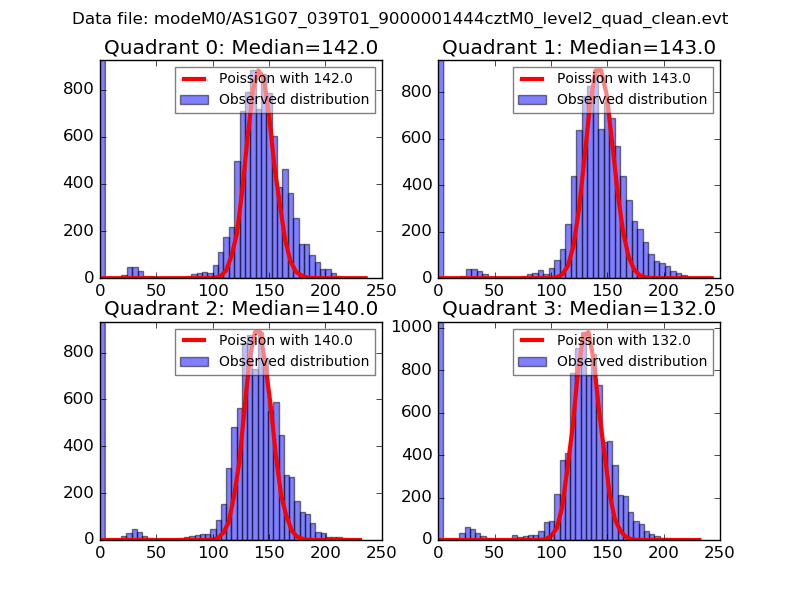
| Comparison with Poisson distribution Blue bars denote a histogram of data divided into 1 sec bins. Red curve is a Poisson curve with rate = median count rate of data. |
 |
 |
| Quadrant-wise count rates Data is divided into 100 sec bins |
 |
|
| Module-wise count rates for Quadrant A Data is divided into 100 sec bins |
 |
 |
| Module-wise count rates for Quadrant B Data is divided into 100 sec bins |
 |
 |
| Module-wise count rates for Quadrant C Data is divided into 100 sec bins |
 |
 |
| Module-wise count rates for Quadrant D Data is divided into 100 sec bins |
 |
 |
| Parameter | Plot |
|---|---|
| CZT HV Monitor |  |
| D_VDD | 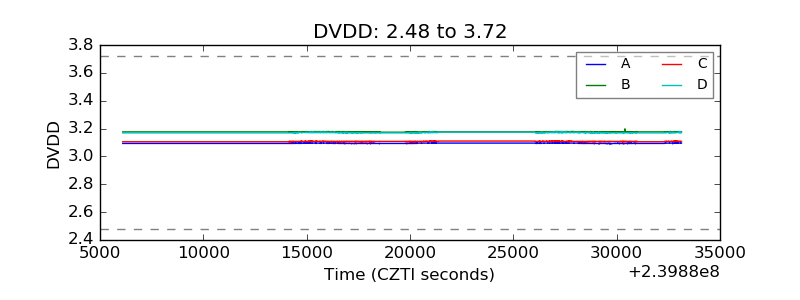 |
| Temperature 1 |  |
| Veto HV Monitor |  |
| Veto LLD | 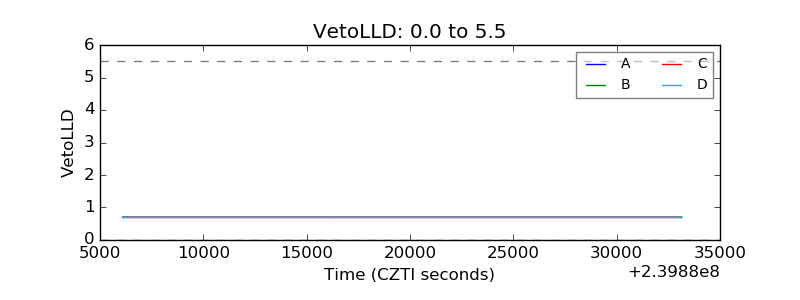 |
| Alpha Counter |  |
| _CPM_Rate |  |
| CZT Counter | 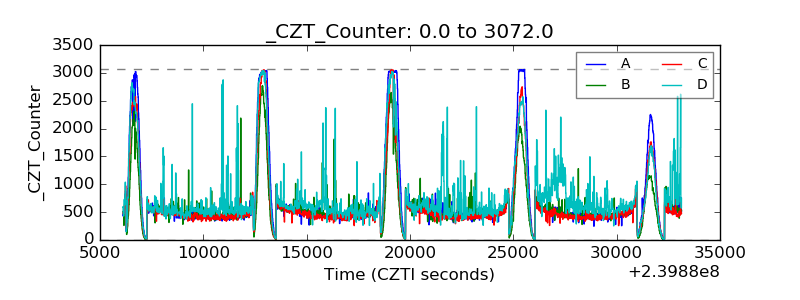 |
| +2.5 Volts monitor | 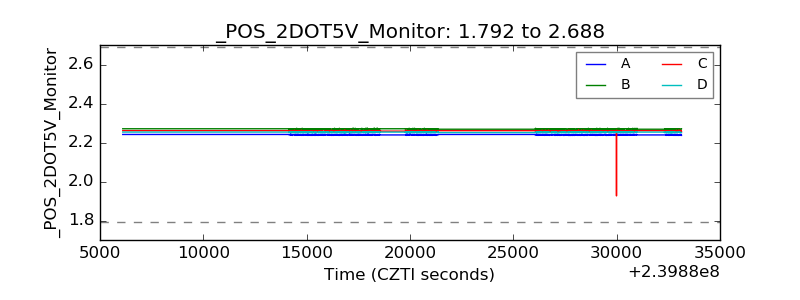 |
| +5 Volts monitor |  |
| _ROLL_ROT |  |
| _Roll_DEC | 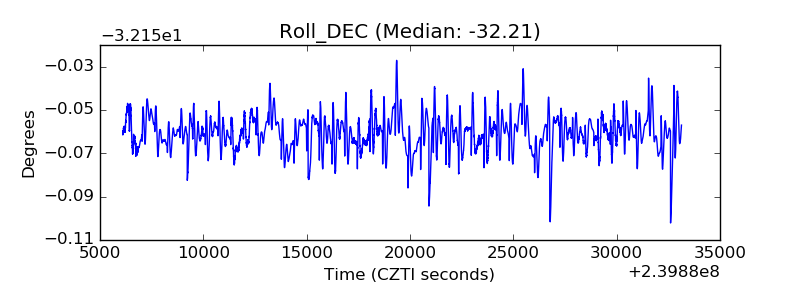 |
| _Roll_RA |  |
| Veto Counter |  |