| Param | Original file | Final file |
|---|---|---|
| Filename | modeM0/AS1G07_014T01_9000001450cztM0_level2.evt | modeM0/AS1G07_014T01_9000001450cztM0_level2_quad_clean.evt |
| Size (bytes) | 1,901,664,000 | 385,110,720 |
| Size | 1.8 GB | 367.3 MB |
| Events in quadrant A | 12,209,435 | 2,517,266 |
| Events in quadrant B | 13,547,706 | 2,538,611 |
| Events in quadrant C | 11,677,100 | 2,538,683 |
| Events in quadrant D | 18,423,972 | 2,304,848 |
| Mode SS | |||
|---|---|---|---|
| Quadrant | BADHDUFLAG | Total packets | Discarded packets |
| A | 0 | 528 | 0 |
| B | 0 | 521 | 0 |
| C | 0 | 524 | 0 |
| D | 0 | 530 | 0 |
| Mode M9 | |||
|---|---|---|---|
| Quadrant | BADHDUFLAG | Total packets | Discarded packets |
| A | 0 | 42 | 0 |
| B | 0 | 45 | 0 |
| C | 0 | 44 | 0 |
| D | 0 | 45 | 0 |
| Mode M0 | |||
|---|---|---|---|
| Quadrant | BADHDUFLAG | Total packets | Discarded packets |
| A | 0 | 53742 | 0 |
| B | 0 | 57619 | 0 |
| C | 0 | 52931 | 0 |
| D | 0 | 71344 | 0 |
| Quadrant | Total seconds | Saturated seconds | Saturation percentage |
|---|---|---|---|
| A | 25696 | 286 | 1.113014% |
| B | 25683 | 468 | 1.822217% |
| C | 25693 | 235 | 0.914646% |
| D | 25444 | 1686 | 6.626317% |
Noise dominated data is calculated using 1-second bins in cleaned event files. If a bin has >2000 counts, and if more than 50% of those come from <1% of pixels, then it is considered to be noise-dominated and hence unusable.
| Quadrant | # 1 sec bins | Bins with >0 counts | Bins with >2000 counts | High rate bins dominated by noise | Noise dominated (total time) | Noise dominated (detector-on time) | Marked lightcurve |
|---|---|---|---|---|---|---|---|
| A | 45628 | 26713 | 0 | 0 | 0.00% | 0.00% |  |
| B | 45628 | 26704 | 148 | 148 | 0.32% | 0.55% |  |
| C | 45628 | 26690 | 7 | 7 | 0.02% | 0.03% |  |
| D | 45628 | 26444 | 1381 | 1381 | 3.03% | 5.22% |  |
Top three noisy pixels from each quadrant. If the there are fewer than three noisy pixels in the level2.evt file, extra rows are filled as -1
| Pixel properties | Quadrant properties | ||||||
|---|---|---|---|---|---|---|---|
| Quadrant | DetID | PixID | Counts | Sigma | Mean | Median | Sigma |
| A | 8 | 15 | 319156 | 517.85 | 3058 | 2997 | 610.5 |
| A | 0 | 8 | 39220 | 59.33 | 3058 | 2997 | 610.5 |
| A | 8 | 5 | 32170 | 47.78 | 3058 | 2997 | 610.5 |
| B | 4 | 81 | 700123 | 1230.75 | 3056 | 2989 | 566.4 |
| B | 0 | 214 | 338087 | 591.6 | 3056 | 2989 | 566.4 |
| B | 4 | 174 | 239579 | 417.69 | 3056 | 2989 | 566.4 |
| C | 14 | 234 | 78760 | 112.68 | 2953 | 2972 | 672.6 |
| C | 10 | 22 | 32000 | 43.16 | 2953 | 2972 | 672.6 |
| C | 14 | 67 | 26222 | 34.57 | 2953 | 2972 | 672.6 |
| D | 1 | 52 | 3227281 | 4380.68 | 2839 | 2771 | 736.1 |
| D | 8 | 195 | 1177084 | 1595.37 | 2839 | 2771 | 736.1 |
| D | 12 | 110 | 1098126 | 1488.1 | 2839 | 2771 | 736.1 |
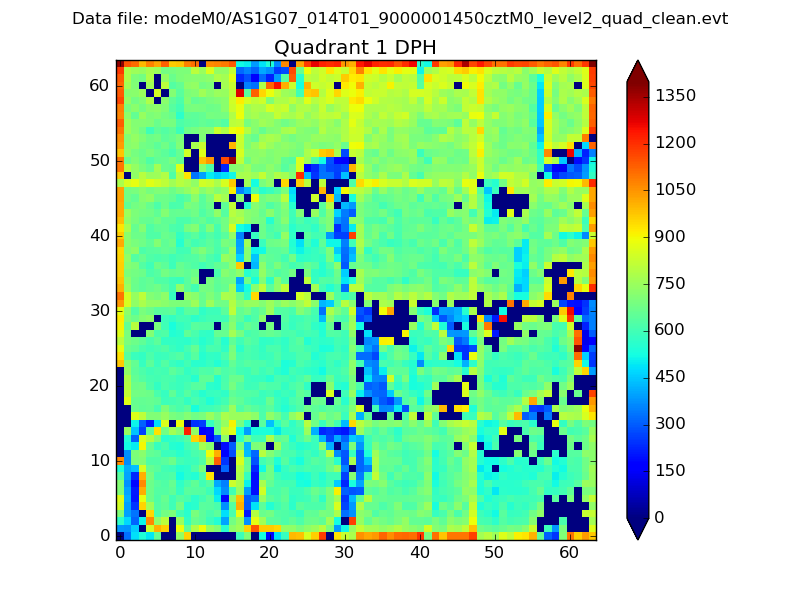
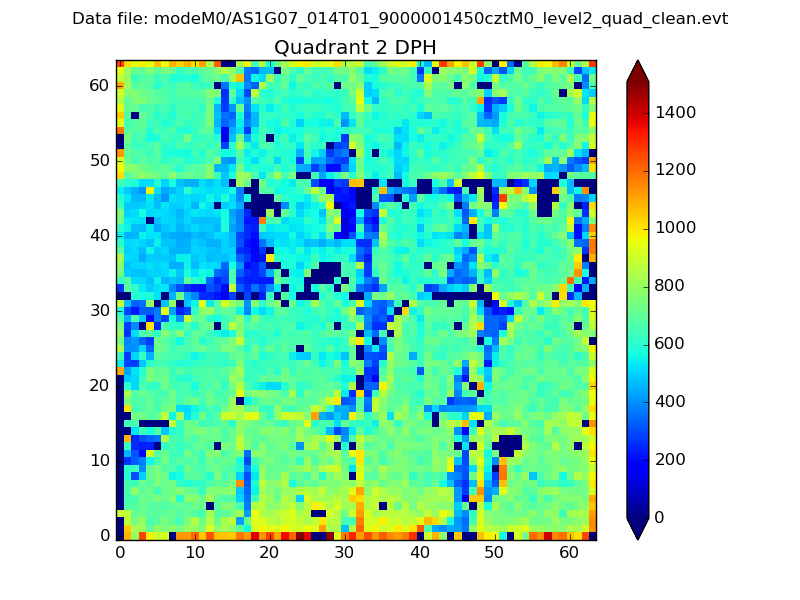
Histogram calculated using DETX and DETY for each event in the final _common_clean file
| Quadrant A |  |
 |
Quadrant B |
|---|---|---|---|
| Quadrant D | 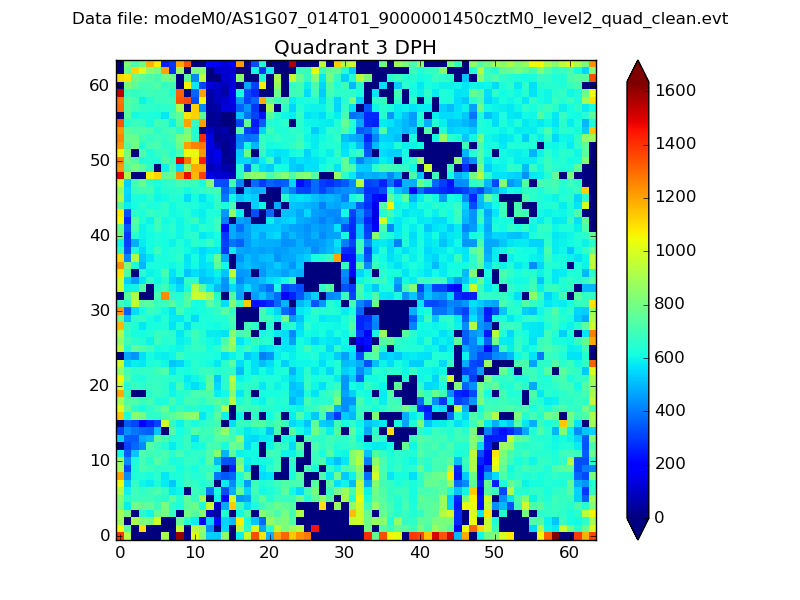 |
 |
Quadrant C |
| Plot type | Count rate plots | Images |
|---|---|---|
| Comparison with Poisson distribution Blue bars denote a histogram of data divided into 1 sec bins. Red curve is a Poisson curve with rate = median count rate of data. |
 |
 |
| Quadrant-wise count rates Data is divided into 100 sec bins |
 |
|
| Module-wise count rates for Quadrant A Data is divided into 100 sec bins |
 |
 |
| Module-wise count rates for Quadrant B Data is divided into 100 sec bins |
 |
 |
| Module-wise count rates for Quadrant C Data is divided into 100 sec bins |
 |
 |
| Module-wise count rates for Quadrant D Data is divided into 100 sec bins |
 |
 |
| Parameter | Plot |
|---|---|
| CZT HV Monitor |  |
| D_VDD |  |
| Temperature 1 |  |
| Veto HV Monitor |  |
| Veto LLD |  |
| Alpha Counter |  |
| _CPM_Rate |  |
| CZT Counter |  |
| +2.5 Volts monitor |  |
| +5 Volts monitor |  |
| _ROLL_ROT |  |
| _Roll_DEC |  |
| _Roll_RA |  |
| Veto Counter |  |