| Param | Original file | Final file |
|---|---|---|
| Filename | modeM0/AS1C02_038T02_9000001490cztM0_level2.evt | modeM0/AS1C02_038T02_9000001490cztM0_level2_quad_clean.evt |
| Size (bytes) | 3,932,208,000 | 682,407,360 |
| Size | 3.7 GB | 650.8 MB |
| Events in quadrant A | 28,606,990 | 4,205,805 |
| Events in quadrant B | 28,934,653 | 4,206,518 |
| Events in quadrant C | 25,666,377 | 4,233,699 |
| Events in quadrant D | 32,115,408 | 4,199,564 |
| Mode M0 | |||
|---|---|---|---|
| Quadrant | BADHDUFLAG | Total packets | Discarded packets |
| A | 0 | 121308 | 0 |
| B | 0 | 121245 | 0 |
| C | 0 | 114093 | 0 |
| D | 0 | 132664 | 0 |
| Mode M9 | |||
|---|---|---|---|
| Quadrant | BADHDUFLAG | Total packets | Discarded packets |
| A | 0 | 84 | 0 |
| B | 0 | 84 | 0 |
| C | 0 | 84 | 0 |
| D | 0 | 86 | 0 |
| Mode SS | |||
|---|---|---|---|
| Quadrant | BADHDUFLAG | Total packets | Discarded packets |
| A | 0 | 1163 | 0 |
| B | 0 | 1147 | 0 |
| C | 0 | 1157 | 0 |
| D | 0 | 1158 | 0 |
| Quadrant | Total seconds | Saturated seconds | Saturation percentage |
|---|---|---|---|
| A | 55242 | 976 | 1.766772% |
| B | 54893 | 1537 | 2.799993% |
| C | 55469 | 597 | 1.076277% |
| D | 57287 | 1119 | 1.953323% |
Noise dominated data is calculated using 1-second bins in cleaned event files. If a bin has >2000 counts, and if more than 50% of those come from <1% of pixels, then it is considered to be noise-dominated and hence unusable.
| Quadrant | # 1 sec bins | Bins with >0 counts | Bins with >2000 counts | High rate bins dominated by noise | Noise dominated (total time) | Noise dominated (detector-on time) | Marked lightcurve |
|---|---|---|---|---|---|---|---|
| A | 101870 | 57909 | 2 | 2 | 0.00% | 0.00% |  |
| B | 101870 | 57640 | 404 | 404 | 0.40% | 0.70% | 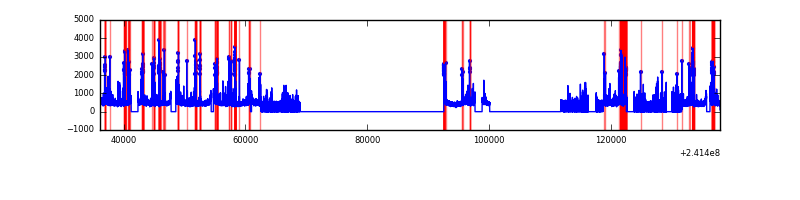 |
| C | 101870 | 58031 | 5 | 5 | 0.00% | 0.01% | 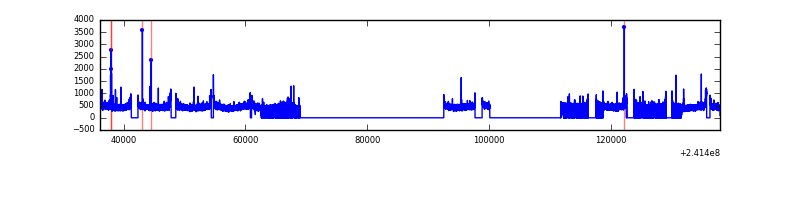 |
| D | 101870 | 58230 | 412 | 412 | 0.40% | 0.71% | 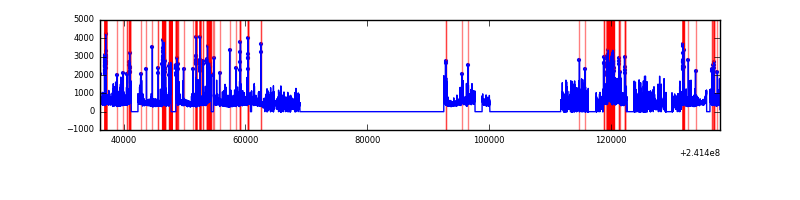 |
Top three noisy pixels from each quadrant. If the there are fewer than three noisy pixels in the level2.evt file, extra rows are filled as -1
| Pixel properties | Quadrant properties | ||||||
|---|---|---|---|---|---|---|---|
| Quadrant | DetID | PixID | Counts | Sigma | Mean | Median | Sigma |
| A | 8 | 15 | 2462510 | 1835.2 | 6653 | 6510 | 1338.3 |
| A | 13 | 251 | 430874 | 317.1 | 6653 | 6510 | 1338.3 |
| A | 0 | 226 | 60999 | 40.72 | 6653 | 6510 | 1338.3 |
| B | 4 | 239 | 2074611 | 1667.68 | 6594 | 6424 | 1240.2 |
| B | 11 | 51 | 487208 | 387.68 | 6594 | 6424 | 1240.2 |
| B | 0 | 219 | 384889 | 305.17 | 6594 | 6424 | 1240.2 |
| C | 14 | 234 | 89982 | 55.28 | 6553 | 6583 | 1508.6 |
| C | 13 | 61 | 48855 | 28.02 | 6553 | 6583 | 1508.6 |
| C | 4 | 175 | 43306 | 24.34 | 6553 | 6583 | 1508.6 |
| D | 8 | 195 | 2102939 | 1315.15 | 6706 | 6522 | 1594.1 |
| D | 1 | 52 | 1277850 | 797.55 | 6706 | 6522 | 1594.1 |
| D | 2 | 33 | 1146110 | 714.9 | 6706 | 6522 | 1594.1 |
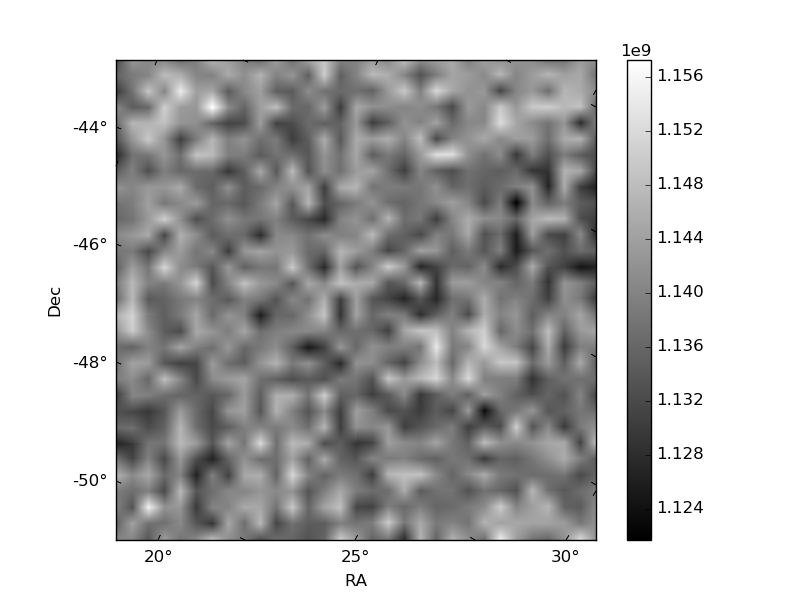
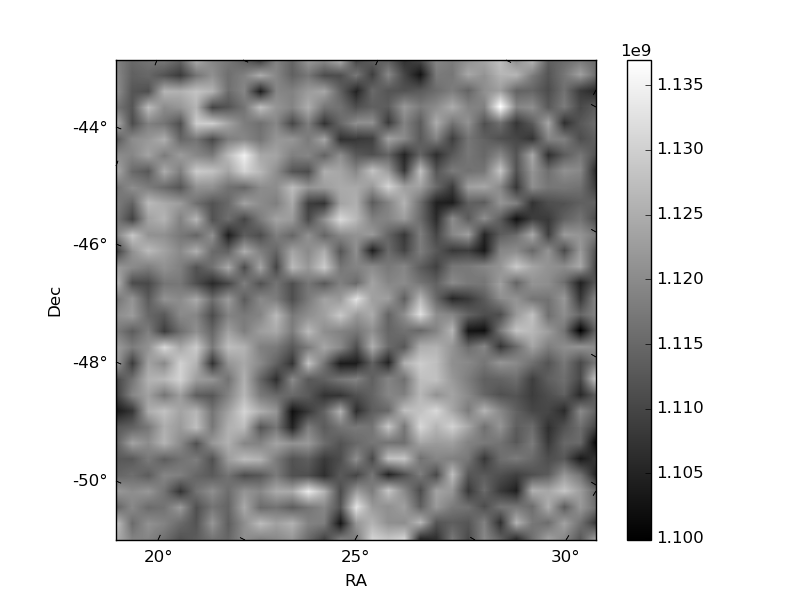
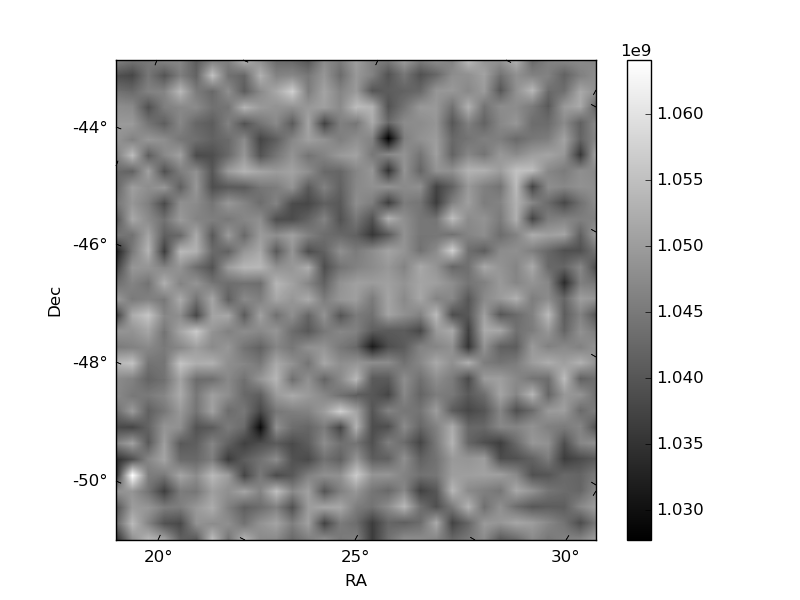
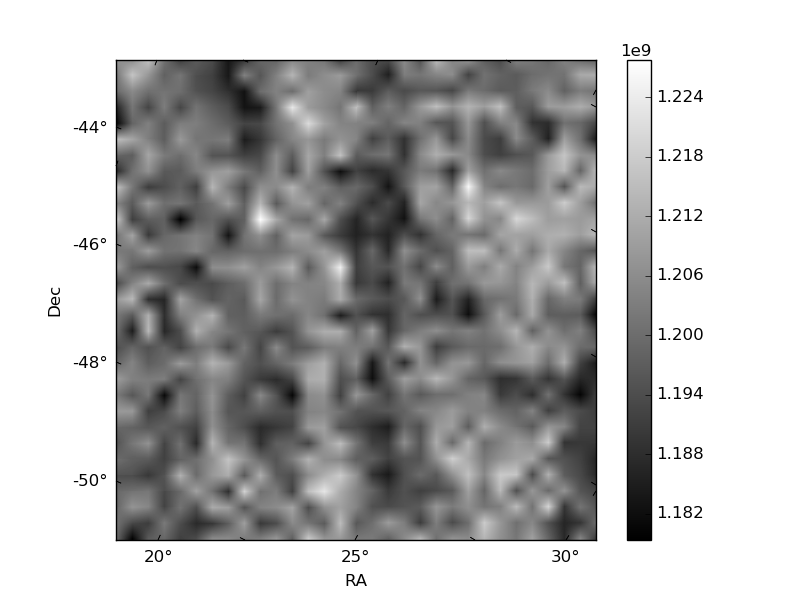
Histogram calculated using DETX and DETY for each event in the final _common_clean file
| Quadrant A | 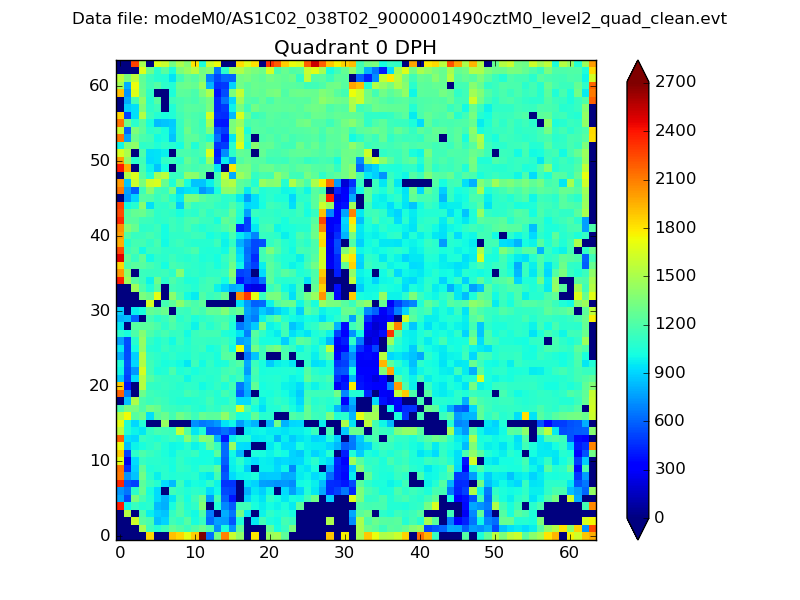 |
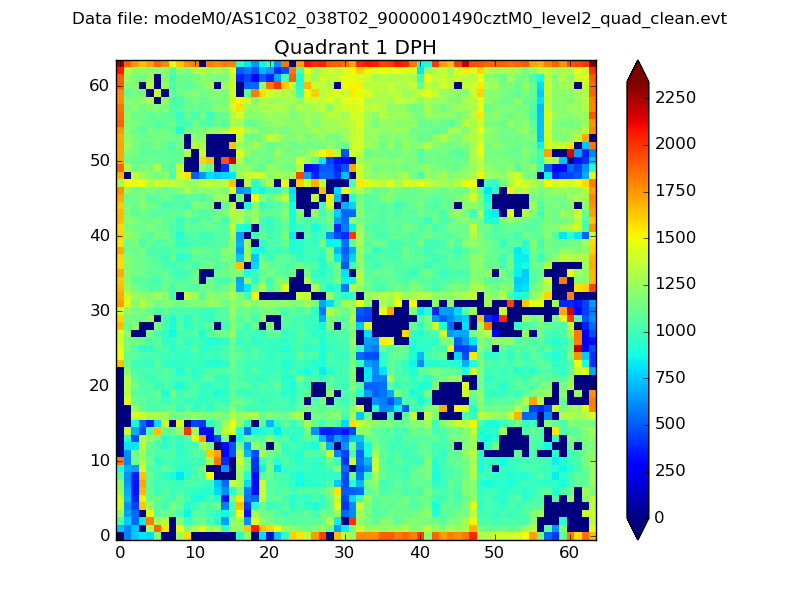 |
Quadrant B |
|---|---|---|---|
| Quadrant D | 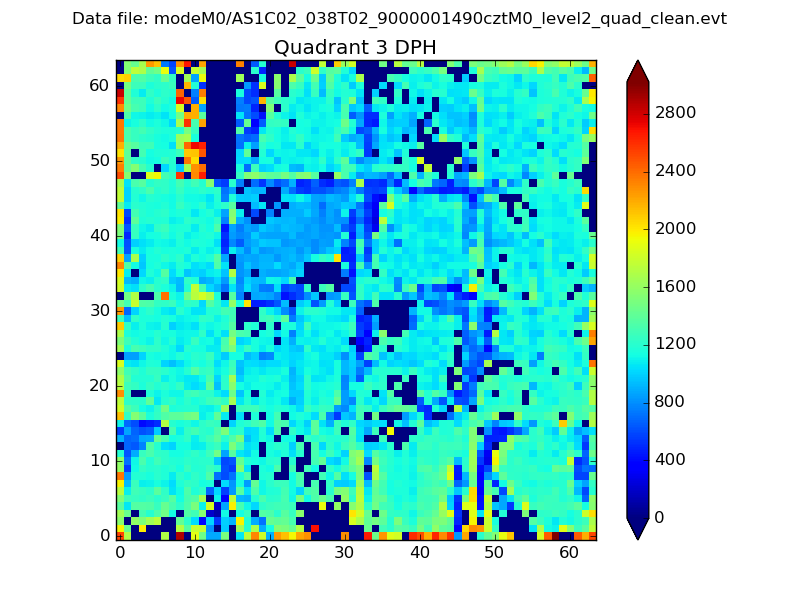 |
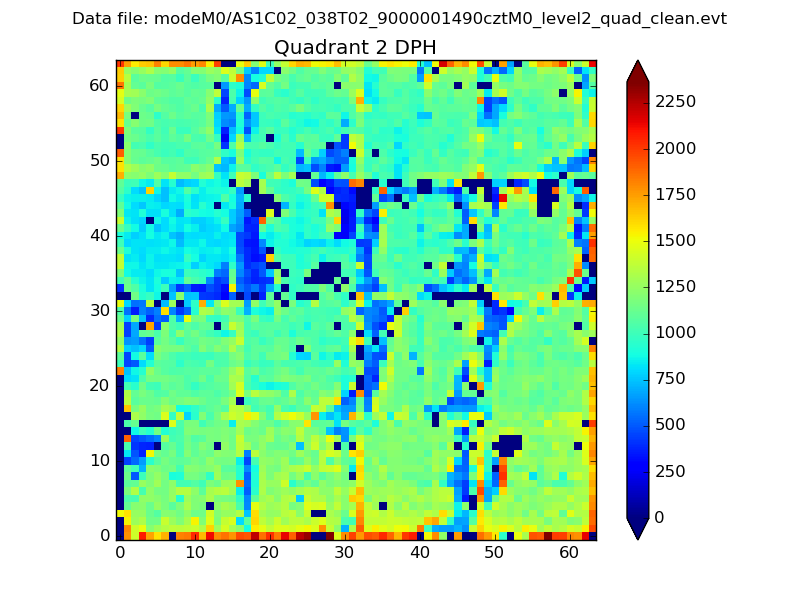 |
Quadrant C |
| Plot type | Count rate plots | Images |
|---|---|---|
| Comparison with Poisson distribution Blue bars denote a histogram of data divided into 1 sec bins. Red curve is a Poisson curve with rate = median count rate of data. |
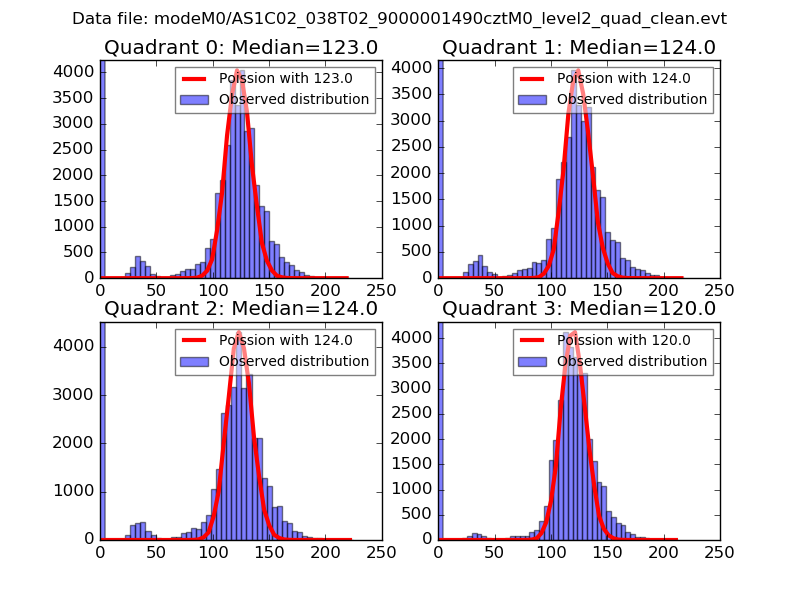 |
 |
| Quadrant-wise count rates Data is divided into 100 sec bins |
 |
|
| Module-wise count rates for Quadrant A Data is divided into 100 sec bins |
 |
 |
| Module-wise count rates for Quadrant B Data is divided into 100 sec bins |
 |
 |
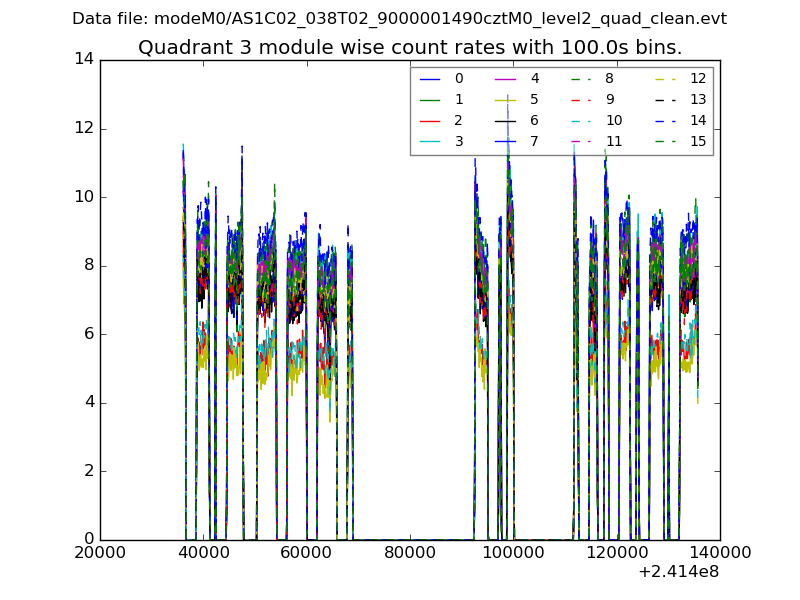
| Module-wise count rates for Quadrant C Data is divided into 100 sec bins |
 |
 |
| Module-wise count rates for Quadrant D Data is divided into 100 sec bins |
 |
 |
| Parameter | Plot |
|---|---|
| CZT HV Monitor |  |
| D_VDD | 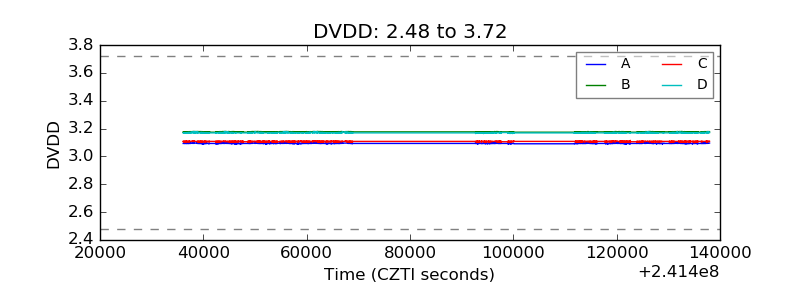 |
| Temperature 1 | 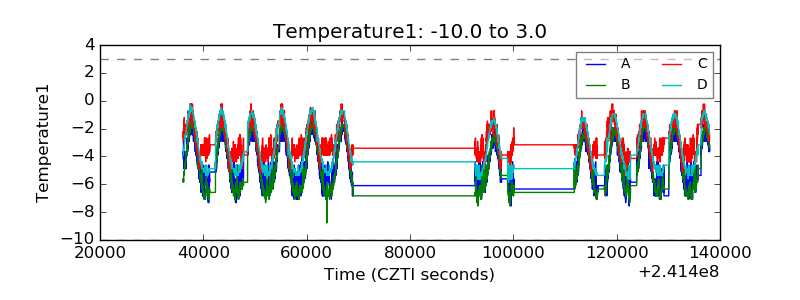 |
| Veto HV Monitor |  |
| Veto LLD | 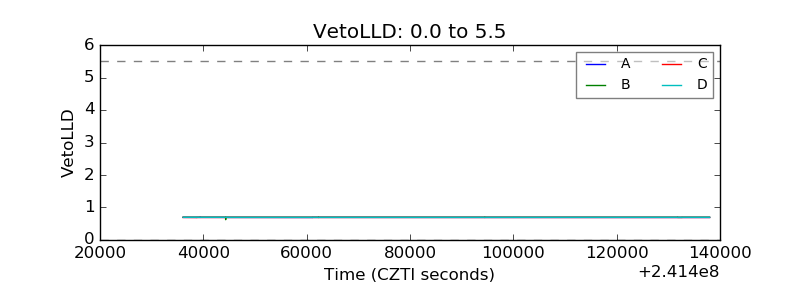 |
| Alpha Counter | 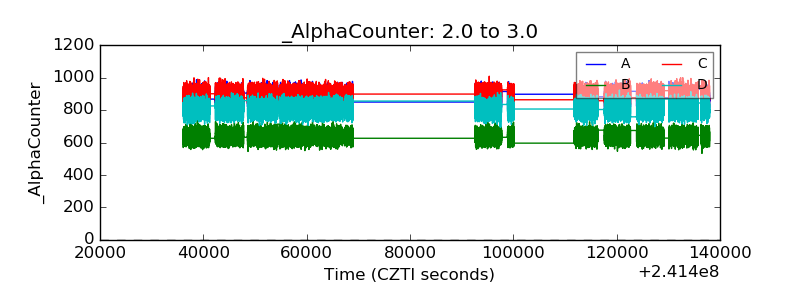 |
| _CPM_Rate |  |
| CZT Counter |  |
| +2.5 Volts monitor |  |
| +5 Volts monitor |  |
| _ROLL_ROT |  |
| _Roll_DEC | 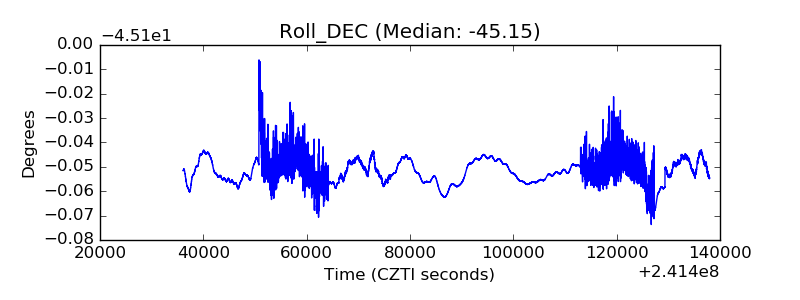 |
| _Roll_RA | 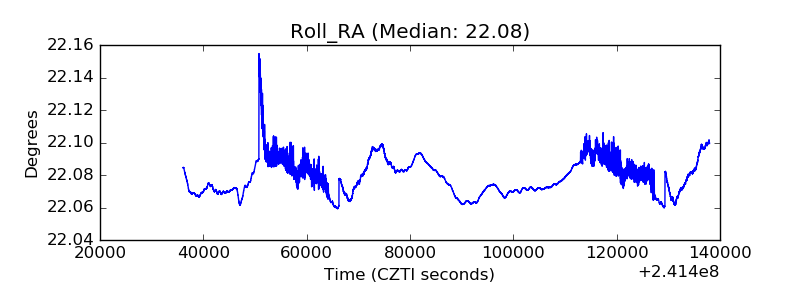 |
| Veto Counter | 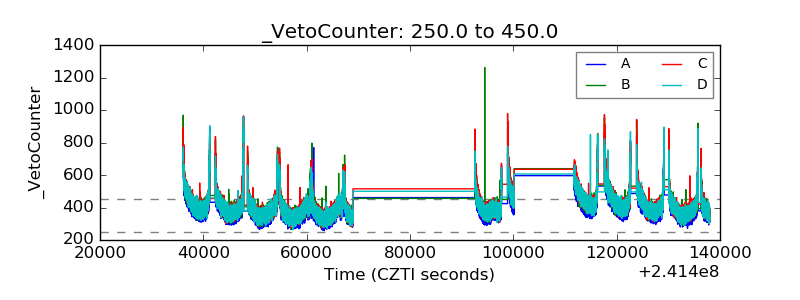 |