| Param | Original file | Final file |
|---|---|---|
| Filename | modeM0/AS1C02_045T02_9000001492cztM0_level2_bc.evt | modeM0/AS1C02_045T02_9000001492cztM0_level2_quad_clean.evt |
| Size (bytes) | 227,496,960 | 104,921,280 |
| Size | 217.0 MB | 100.1 MB |
| Events in quadrant A | 1,338,159 | 664,107 |
| Events in quadrant B | 1,537,083 | 655,262 |
| Events in quadrant C | 1,330,888 | 674,666 |
| Events in quadrant D | 2,220,452 | 719,128 |
| Mode M0 | |||
|---|---|---|---|
| Quadrant | BADHDUFLAG | Total packets | Discarded packets |
| A | 0 | 14343 | 0 |
| B | 0 | 14449 | 0 |
| C | 0 | 14330 | 0 |
| D | 0 | 17190 | 0 |
| Mode M9 | |||
|---|---|---|---|
| Quadrant | BADHDUFLAG | Total packets | Discarded packets |
| A | 0 | 5 | 0 |
| B | 0 | 5 | 0 |
| C | 0 | 5 | 0 |
| D | 0 | 5 | 0 |
| Mode SS | |||
|---|---|---|---|
| Quadrant | BADHDUFLAG | Total packets | Discarded packets |
| A | 0 | 86 | 0 |
| B | 0 | 82 | 0 |
| C | 0 | 84 | 0 |
| D | 0 | 87 | 0 |
| Quadrant | Total seconds | Saturated seconds | Saturation percentage |
|---|---|---|---|
| A | 6978 | 87 | 1.246776% |
| B | 6695 | 142 | 2.120986% |
| C | 7005 | 36 | 0.513919% |
| D | 7729 | 103 | 1.332643% |
Noise dominated data is calculated using 1-second bins in cleaned event files. If a bin has >2000 counts, and if more than 50% of those come from <1% of pixels, then it is considered to be noise-dominated and hence unusable.
| Quadrant | # 1 sec bins | Bins with >0 counts | Bins with >2000 counts | High rate bins dominated by noise | Noise dominated (total time) | Noise dominated (detector-on time) | Marked lightcurve |
|---|---|---|---|---|---|---|---|
| A | 9315 | 8350 | 0 | 0 | 0.00% | 0.00% | 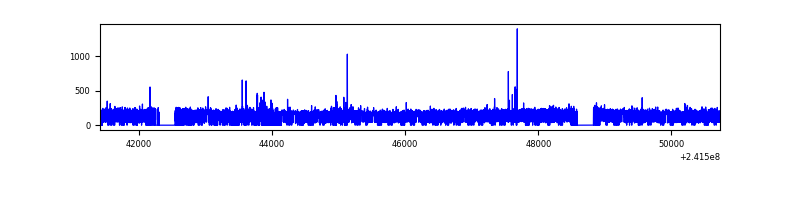 |
| B | 9317 | 8093 | 0 | 0 | 0.00% | 0.00% |  |
| C | 9317 | 8344 | 0 | 0 | 0.00% | 0.00% | 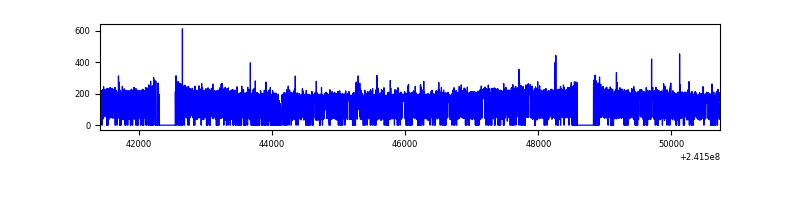 |
| D | 9317 | 8336 | 0 | 0 | 0.00% | 0.00% | 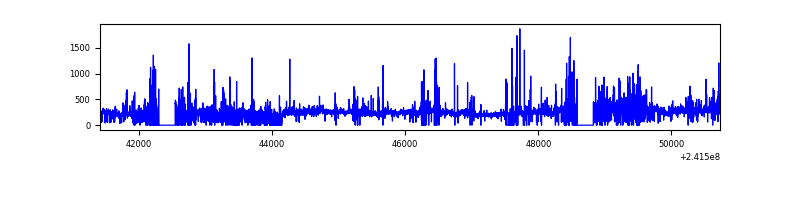 |
Top three noisy pixels from each quadrant. If the there are fewer than three noisy pixels in the level2.evt file, extra rows are filled as -1
| Pixel properties | Quadrant properties | ||||||
|---|---|---|---|---|---|---|---|
| Quadrant | DetID | PixID | Counts | Sigma | Mean | Median | Sigma |
| A | 15 | 174 | 13707 | 177.69 | 335 | 327 | 75.3 |
| A | 13 | 251 | 9725 | 124.81 | 335 | 327 | 75.3 |
| A | 8 | 5 | 8740 | 111.73 | 335 | 327 | 75.3 |
| B | 4 | 239 | 132374 | 2031.36 | 324 | 316 | 65.0 |
| B | 11 | 51 | 65966 | 1009.85 | 324 | 316 | 65.0 |
| B | 3 | 208 | 44332 | 677.07 | 324 | 316 | 65.0 |
| C | 14 | 67 | 3628 | 42.69 | 338 | 333 | 77.2 |
| C | 14 | 234 | 3530 | 41.42 | 338 | 333 | 77.2 |
| C | 4 | 175 | 2233 | 24.62 | 338 | 333 | 77.2 |
| D | 8 | 195 | 429846 | 4883.04 | 370 | 356 | 88.0 |
| D | 1 | 20 | 103044 | 1167.5 | 370 | 356 | 88.0 |
| D | 2 | 33 | 66053 | 746.94 | 370 | 356 | 88.0 |
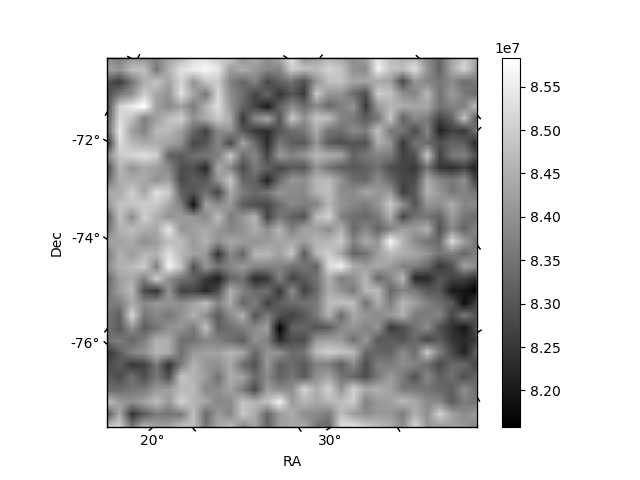
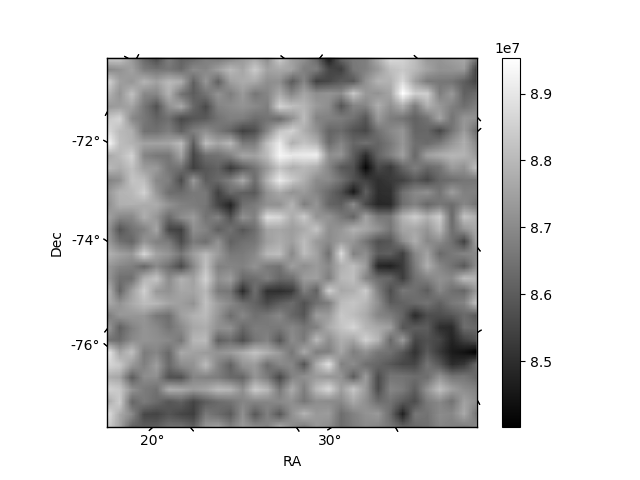
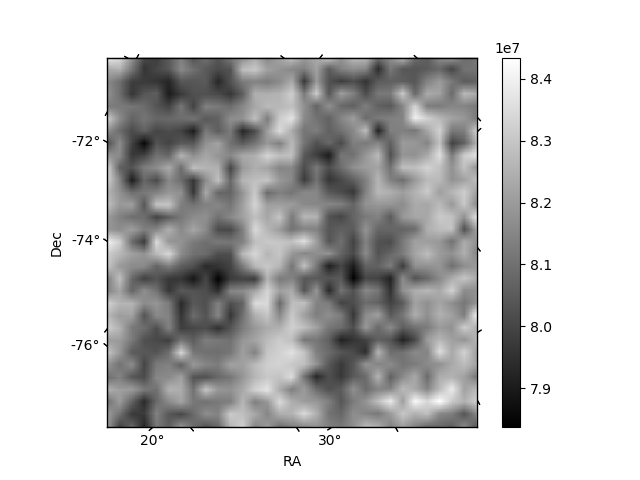
Histogram calculated using DETX and DETY for each event in the final _common_clean file
| Quadrant A | 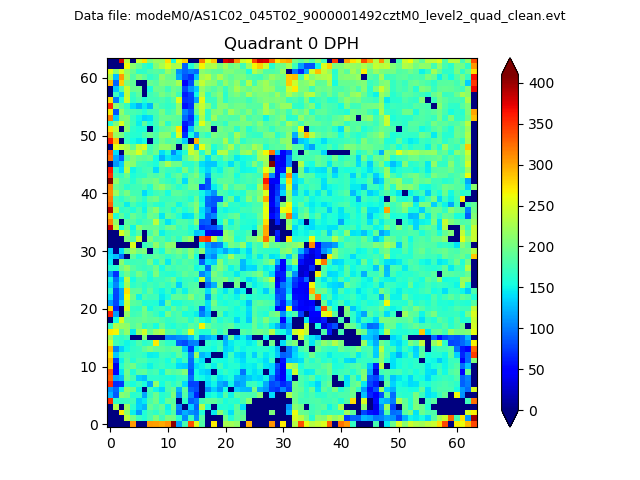 |
 |
Quadrant B |
|---|---|---|---|
| Quadrant D |  |
 |
Quadrant C |
| Plot type | Count rate plots | Images |
|---|---|---|
| Comparison with Poisson distribution Blue bars denote a histogram of data divided into 1 sec bins. Red curve is a Poisson curve with rate = median count rate of data. |
 |
 |
| Quadrant-wise count rates Data is divided into 100 sec bins |
 |
|
| Module-wise count rates for Quadrant A Data is divided into 100 sec bins |
 |
 |
| Module-wise count rates for Quadrant B Data is divided into 100 sec bins |
 |
 |
| Module-wise count rates for Quadrant C Data is divided into 100 sec bins |
 |
 |
| Module-wise count rates for Quadrant D Data is divided into 100 sec bins |
 |
 |
| Parameter | Plot |
|---|---|
| CZT HV Monitor | 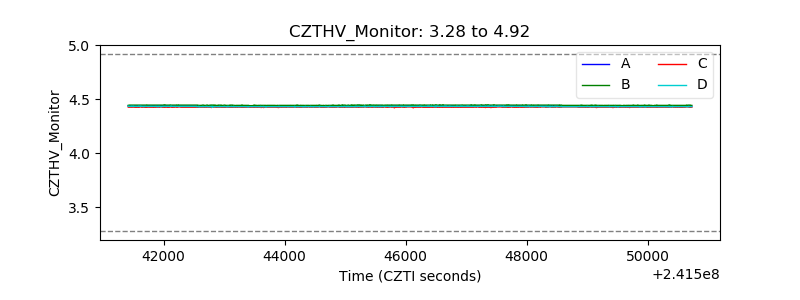 |
| D_VDD |  |
| Temperature 1 |  |
| Veto HV Monitor |  |
| Veto LLD | 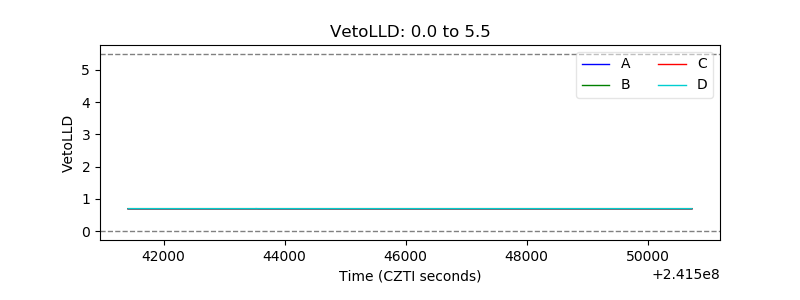 |
| Alpha Counter |  |
| _CPM_Rate | 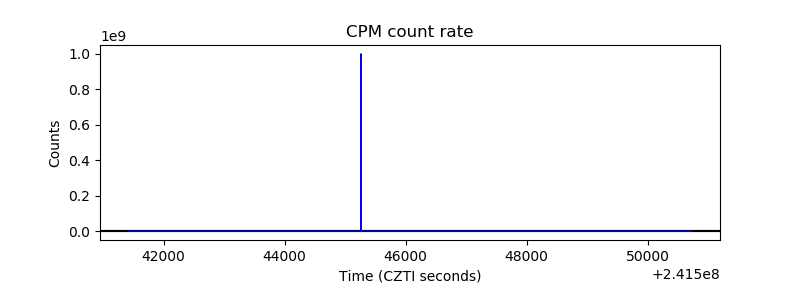 |
| CZT Counter |  |
| +2.5 Volts monitor |  |
| +5 Volts monitor |  |
| _ROLL_ROT | 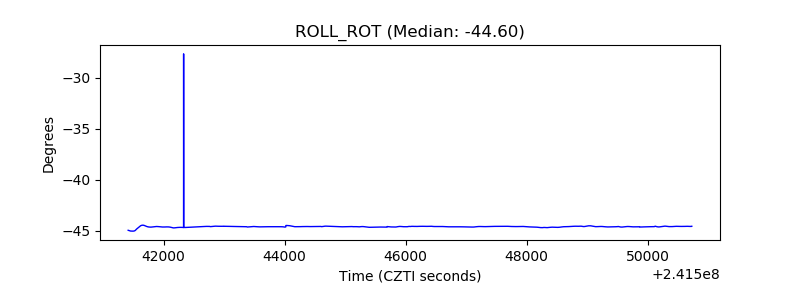 |
| _Roll_DEC |  |
| _Roll_RA | 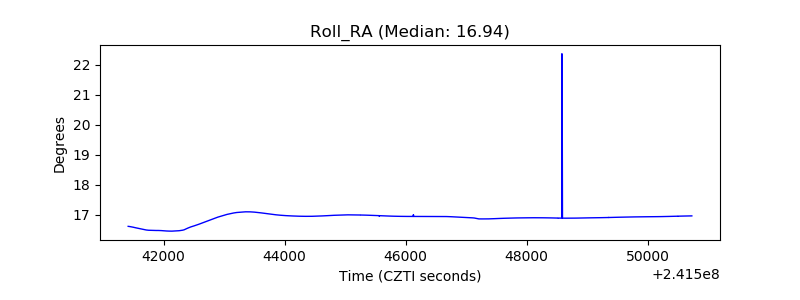 |
| Veto Counter |  |