| Param | Original file | Final file |
|---|---|---|
| Filename | modeM0/AS1A03_119T02_9000001496cztM0_level2.evt | modeM0/AS1A03_119T02_9000001496cztM0_level2_quad_clean.evt |
| Size (bytes) | 985,772,160 | 253,238,400 |
| Size | 940.1 MB | 241.5 MB |
| Events in quadrant A | 6,724,336 | 1,680,559 |
| Events in quadrant B | 7,118,520 | 1,668,233 |
| Events in quadrant C | 6,639,400 | 1,709,402 |
| Events in quadrant D | 8,354,641 | 1,576,109 |
| Mode SS | |||
|---|---|---|---|
| Quadrant | BADHDUFLAG | Total packets | Discarded packets |
| A | 0 | 318 | 0 |
| B | 0 | 323 | 0 |
| C | 0 | 315 | 0 |
| D | 0 | 321 | 0 |
| Mode M9 | |||
|---|---|---|---|
| Quadrant | BADHDUFLAG | Total packets | Discarded packets |
| A | 0 | 26 | 0 |
| B | 0 | 26 | 0 |
| C | 0 | 25 | 0 |
| D | 0 | 26 | 0 |
| Mode M0 | |||
|---|---|---|---|
| Quadrant | BADHDUFLAG | Total packets | Discarded packets |
| A | 0 | 30713 | 0 |
| B | 0 | 31219 | 0 |
| C | 0 | 30509 | 0 |
| D | 0 | 34374 | 0 |
| Quadrant | Total seconds | Saturated seconds | Saturation percentage |
|---|---|---|---|
| A | 15145 | 68 | 0.448993% |
| B | 14835 | 127 | 0.856084% |
| C | 15143 | 35 | 0.231130% |
| D | 14801 | 181 | 1.222890% |
Noise dominated data is calculated using 1-second bins in cleaned event files. If a bin has >2000 counts, and if more than 50% of those come from <1% of pixels, then it is considered to be noise-dominated and hence unusable.
| Quadrant | # 1 sec bins | Bins with >0 counts | Bins with >2000 counts | High rate bins dominated by noise | Noise dominated (total time) | Noise dominated (detector-on time) | Marked lightcurve |
|---|---|---|---|---|---|---|---|
| A | 18579 | 15810 | 1 | 1 | 0.01% | 0.01% |  |
| B | 18579 | 15543 | 31 | 31 | 0.17% | 0.20% | 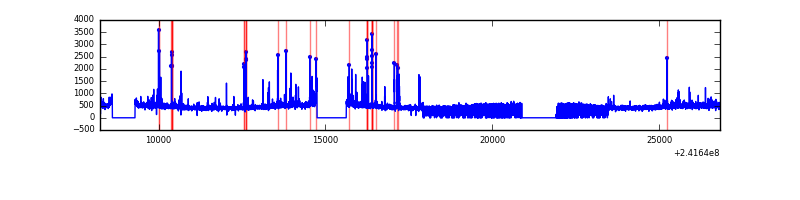 |
| C | 18579 | 15806 | 1 | 1 | 0.01% | 0.01% | 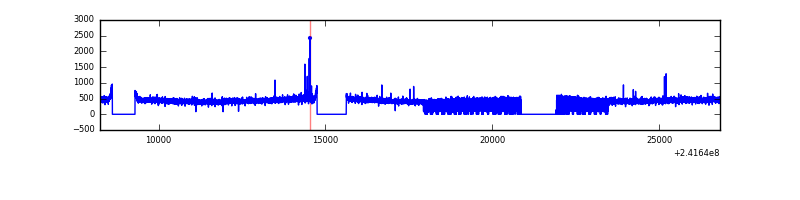 |
| D | 18579 | 15298 | 132 | 132 | 0.71% | 0.86% | 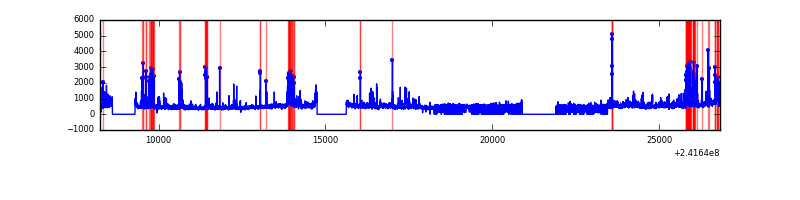 |
Top three noisy pixels from each quadrant. If the there are fewer than three noisy pixels in the level2.evt file, extra rows are filled as -1
| Pixel properties | Quadrant properties | ||||||
|---|---|---|---|---|---|---|---|
| Quadrant | DetID | PixID | Counts | Sigma | Mean | Median | Sigma |
| A | 13 | 251 | 43366 | 120.16 | 1717 | 1676 | 347.0 |
| A | 15 | 174 | 35732 | 98.16 | 1717 | 1676 | 347.0 |
| A | 3 | 1 | 19419 | 51.14 | 1717 | 1676 | 347.0 |
| B | 4 | 239 | 263664 | 826.35 | 1684 | 1643 | 317.1 |
| B | 0 | 214 | 163150 | 509.35 | 1684 | 1643 | 317.1 |
| B | 0 | 219 | 50106 | 152.84 | 1684 | 1643 | 317.1 |
| C | 15 | 48 | 20389 | 48.25 | 1691 | 1699 | 387.4 |
| C | 14 | 234 | 19582 | 46.16 | 1691 | 1699 | 387.4 |
| C | 13 | 61 | 12634 | 28.23 | 1691 | 1699 | 387.4 |
| D | 8 | 195 | 555617 | 1439.89 | 1628 | 1581 | 384.8 |
| D | 1 | 52 | 457654 | 1185.29 | 1628 | 1581 | 384.8 |
| D | 1 | 20 | 457476 | 1184.83 | 1628 | 1581 | 384.8 |
Histogram calculated using DETX and DETY for each event in the final _common_clean file
| Quadrant A |  |
 |
Quadrant B |
|---|---|---|---|
| Quadrant D | 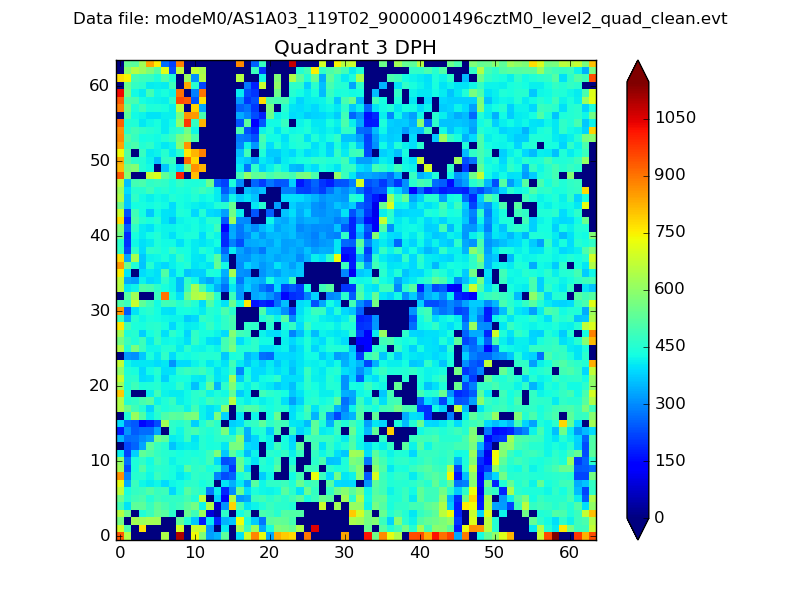 |
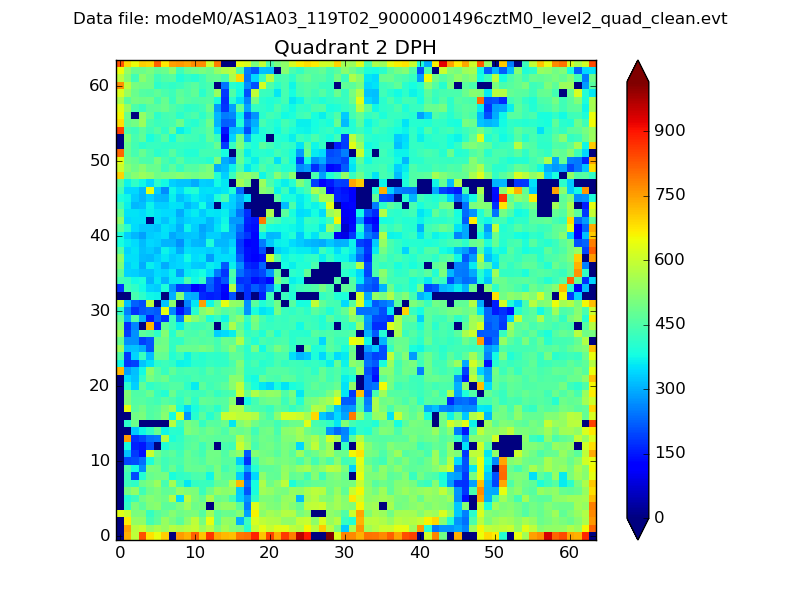 |
Quadrant C |
| Plot type | Count rate plots | Images |
|---|---|---|
| Comparison with Poisson distribution Blue bars denote a histogram of data divided into 1 sec bins. Red curve is a Poisson curve with rate = median count rate of data. |
 |
 |
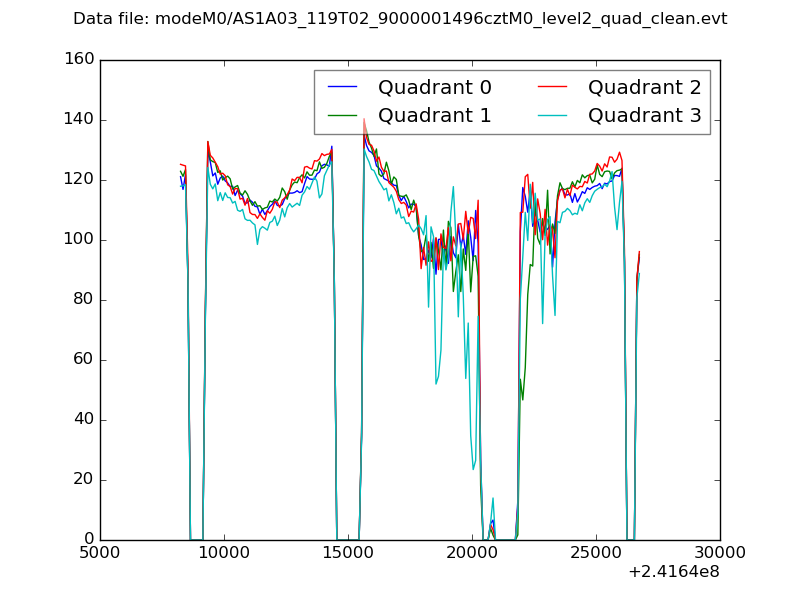
| Quadrant-wise count rates Data is divided into 100 sec bins |
 |
|
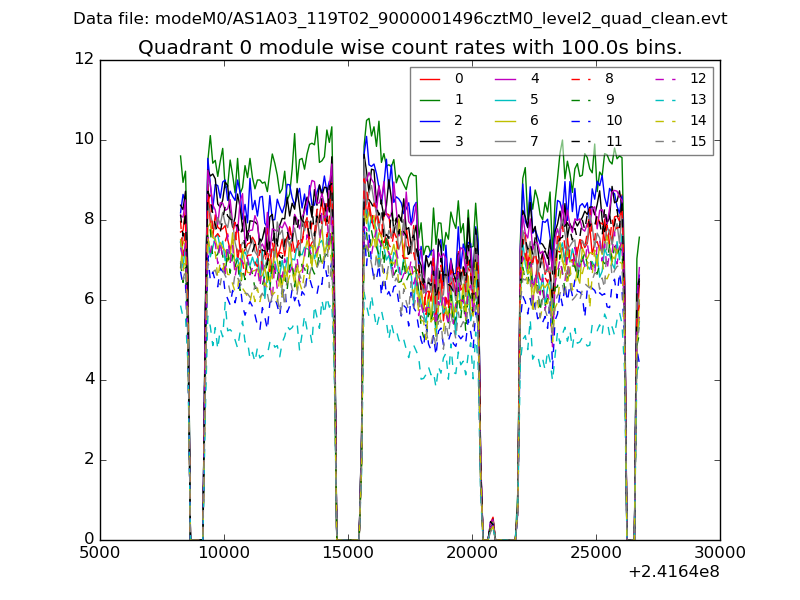
| Module-wise count rates for Quadrant A Data is divided into 100 sec bins |
 |
 |
| Module-wise count rates for Quadrant B Data is divided into 100 sec bins |
 |
 |
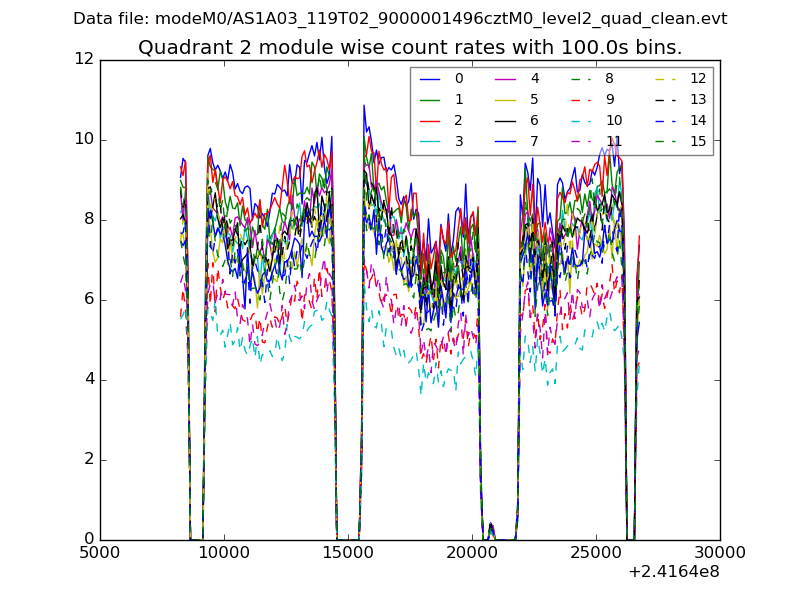
| Module-wise count rates for Quadrant C Data is divided into 100 sec bins |
 |
 |
| Module-wise count rates for Quadrant D Data is divided into 100 sec bins |
 |
 |
| Parameter | Plot |
|---|---|
| CZT HV Monitor |  |
| D_VDD |  |
| Temperature 1 |  |
| Veto HV Monitor |  |
| Veto LLD | 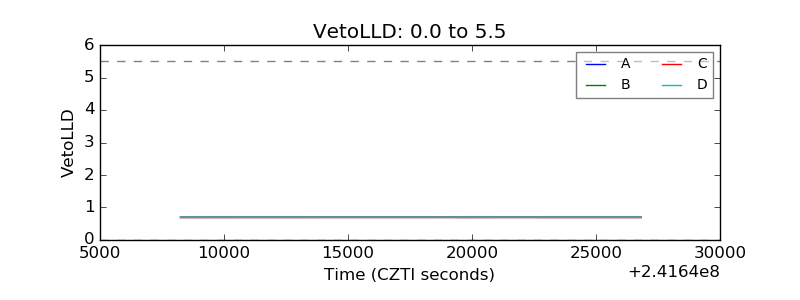 |
| Alpha Counter | 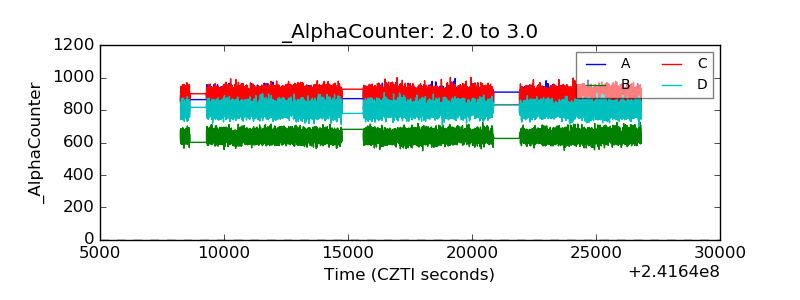 |
| _CPM_Rate | 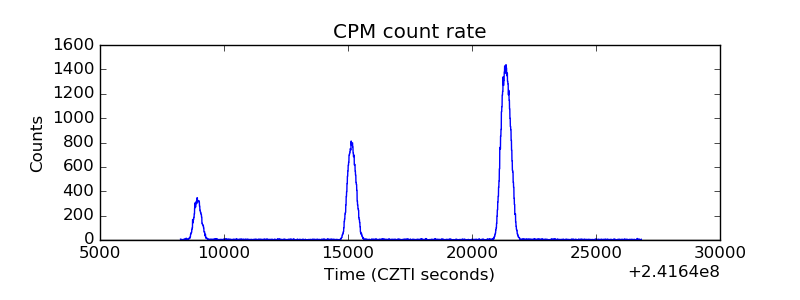 |
| CZT Counter |  |
| +2.5 Volts monitor |  |
| +5 Volts monitor | 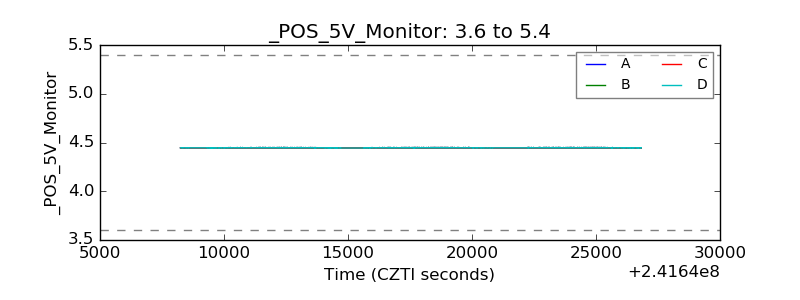 |
| _ROLL_ROT |  |
| _Roll_DEC |  |
| _Roll_RA |  |
| Veto Counter |  |