| Param | Original file | Final file |
|---|---|---|
| Filename | modeM0/AS1G07_068T01_9000001502cztM0_level2.evt | modeM0/AS1G07_068T01_9000001502cztM0_level2_quad_clean.evt |
| Size (bytes) | 1,102,639,680 | 191,491,200 |
| Size | 1.0 GB | 182.6 MB |
| Events in quadrant A | 7,036,623 | 1,199,372 |
| Events in quadrant B | 8,491,810 | 1,186,991 |
| Events in quadrant C | 7,006,708 | 1,207,467 |
| Events in quadrant D | 9,843,147 | 1,170,769 |
| Mode M0 | |||
|---|---|---|---|
| Quadrant | BADHDUFLAG | Total packets | Discarded packets |
| A | 0 | 31342 | 0 |
| B | 0 | 34830 | 0 |
| C | 0 | 31549 | 0 |
| D | 0 | 39068 | 0 |
| Mode M9 | |||
|---|---|---|---|
| Quadrant | BADHDUFLAG | Total packets | Discarded packets |
| A | 0 | 12 | 0 |
| B | 0 | 12 | 0 |
| C | 0 | 12 | 0 |
| D | 0 | 12 | 0 |
| Mode SS | |||
|---|---|---|---|
| Quadrant | BADHDUFLAG | Total packets | Discarded packets |
| A | 0 | 252 | 0 |
| B | 0 | 275 | 0 |
| C | 0 | 276 | 0 |
| D | 0 | 264 | 0 |
| Quadrant | Total seconds | Saturated seconds | Saturation percentage |
|---|---|---|---|
| A | 15155 | 377 | 2.487628% |
| B | 14980 | 671 | 4.479306% |
| C | 15162 | 292 | 1.925867% |
| D | 15252 | 412 | 2.701285% |
Noise dominated data is calculated using 1-second bins in cleaned event files. If a bin has >2000 counts, and if more than 50% of those come from <1% of pixels, then it is considered to be noise-dominated and hence unusable.
| Quadrant | # 1 sec bins | Bins with >0 counts | Bins with >2000 counts | High rate bins dominated by noise | Noise dominated (total time) | Noise dominated (detector-on time) | Marked lightcurve |
|---|---|---|---|---|---|---|---|
| A | 17850 | 16176 | 0 | 0 | 0.00% | 0.00% |  |
| B | 17850 | 16079 | 177 | 177 | 0.99% | 1.10% |  |
| C | 17850 | 16200 | 7 | 7 | 0.04% | 0.04% |  |
| D | 17848 | 16068 | 83 | 83 | 0.47% | 0.52% |  |
Top three noisy pixels from each quadrant. If the there are fewer than three noisy pixels in the level2.evt file, extra rows are filled as -1
| Pixel properties | Quadrant properties | ||||||
|---|---|---|---|---|---|---|---|
| Quadrant | DetID | PixID | Counts | Sigma | Mean | Median | Sigma |
| A | 1 | 162 | 19105 | 46.87 | 1810 | 1764 | 370.0 |
| A | 0 | 226 | 16470 | 39.75 | 1810 | 1764 | 370.0 |
| A | 12 | 194 | 14938 | 35.61 | 1810 | 1764 | 370.0 |
| B | 4 | 239 | 1022126 | 2974.96 | 1788 | 1746 | 343.0 |
| B | 11 | 51 | 143292 | 412.68 | 1788 | 1746 | 343.0 |
| B | 0 | 219 | 126728 | 364.39 | 1788 | 1746 | 343.0 |
| C | 14 | 234 | 76658 | 181.78 | 1773 | 1783 | 411.9 |
| C | 13 | 61 | 13316 | 28.0 | 1773 | 1783 | 411.9 |
| C | 14 | 67 | 8194 | 15.56 | 1773 | 1783 | 411.9 |
| D | 8 | 195 | 1358056 | 3207.63 | 1771 | 1722 | 422.8 |
| D | 1 | 20 | 775856 | 1830.77 | 1771 | 1722 | 422.8 |
| D | 1 | 52 | 462171 | 1088.93 | 1771 | 1722 | 422.8 |
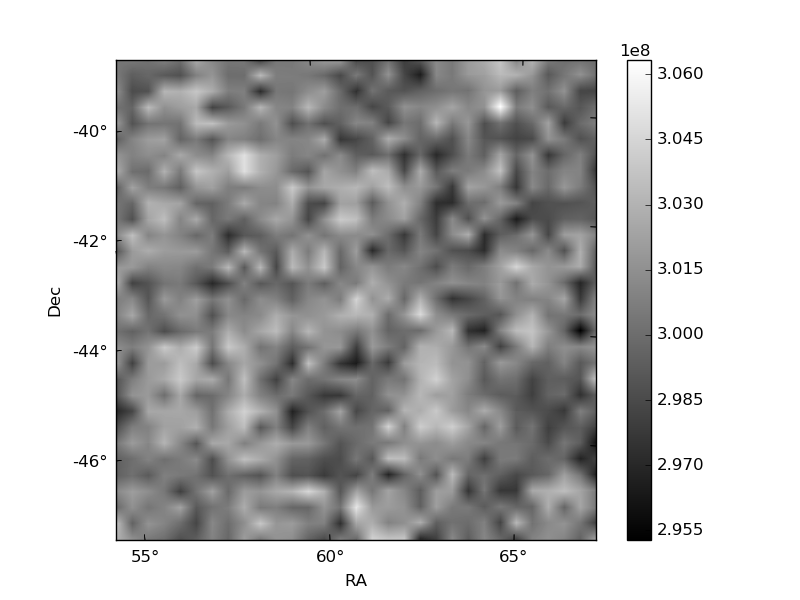
Histogram calculated using DETX and DETY for each event in the final _common_clean file
| Quadrant A | 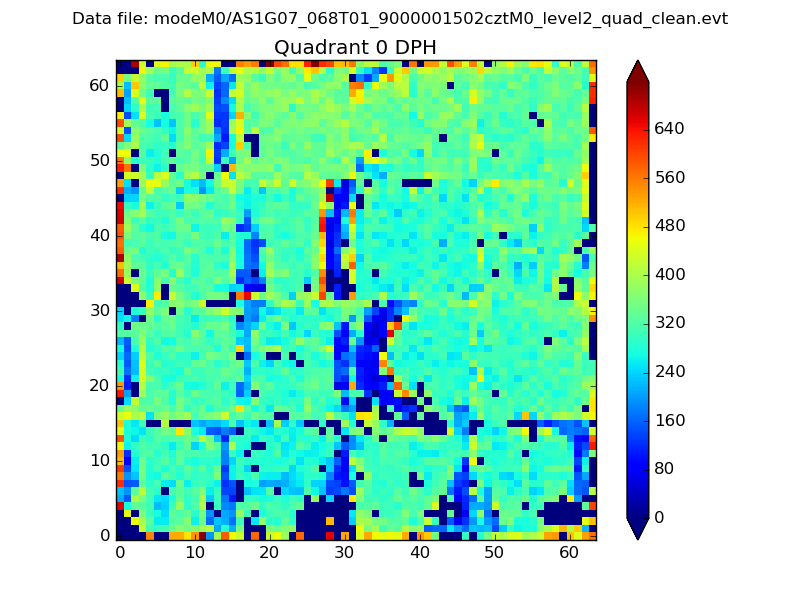 |
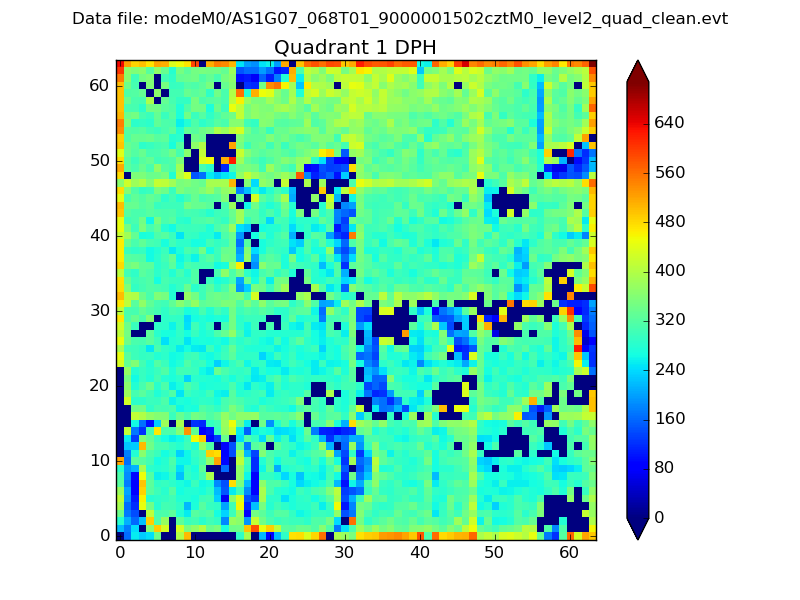 |
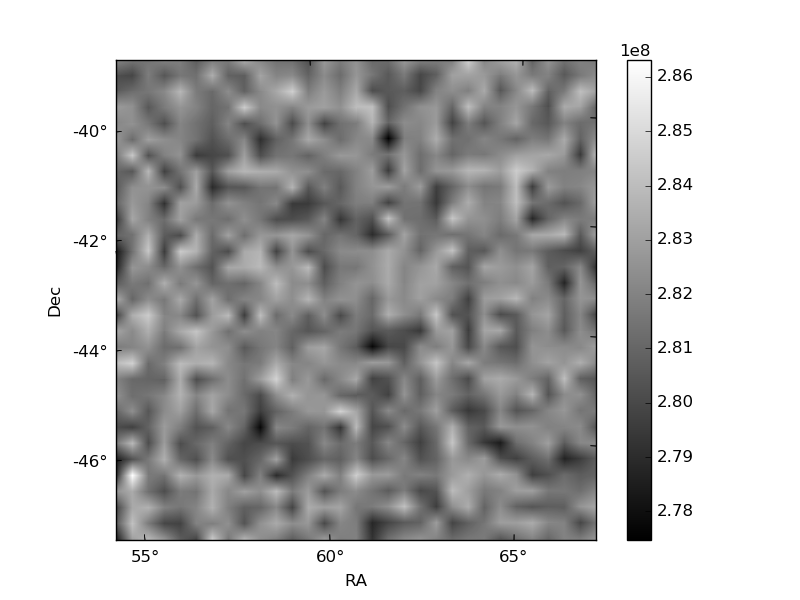
Quadrant B |
|---|---|---|---|
| Quadrant D |  |
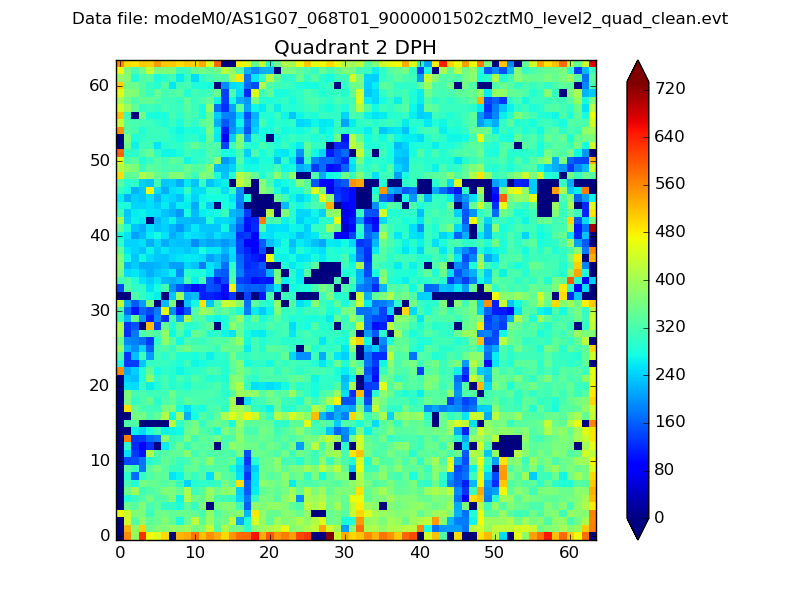 |
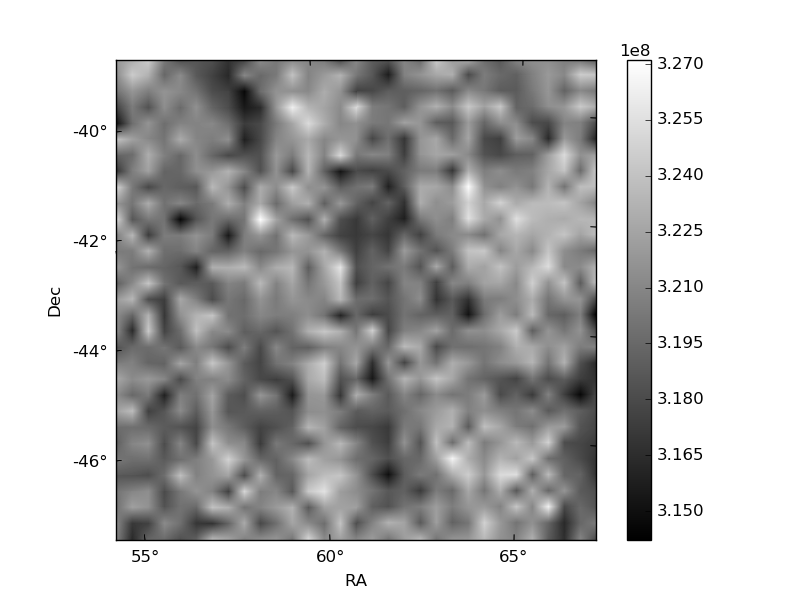
Quadrant C |
| Plot type | Count rate plots | Images |
|---|---|---|
| Comparison with Poisson distribution Blue bars denote a histogram of data divided into 1 sec bins. Red curve is a Poisson curve with rate = median count rate of data. |
 |
 |
| Quadrant-wise count rates Data is divided into 100 sec bins |
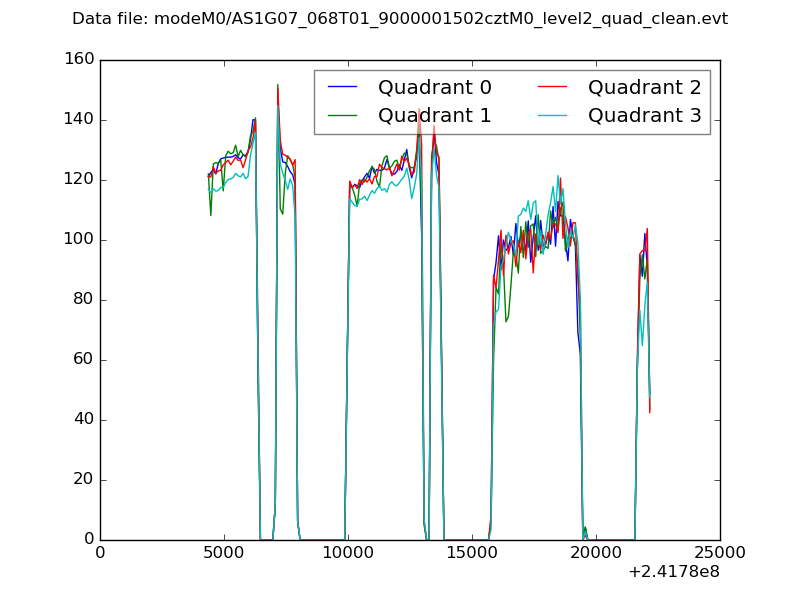 |
|
| Module-wise count rates for Quadrant A Data is divided into 100 sec bins |
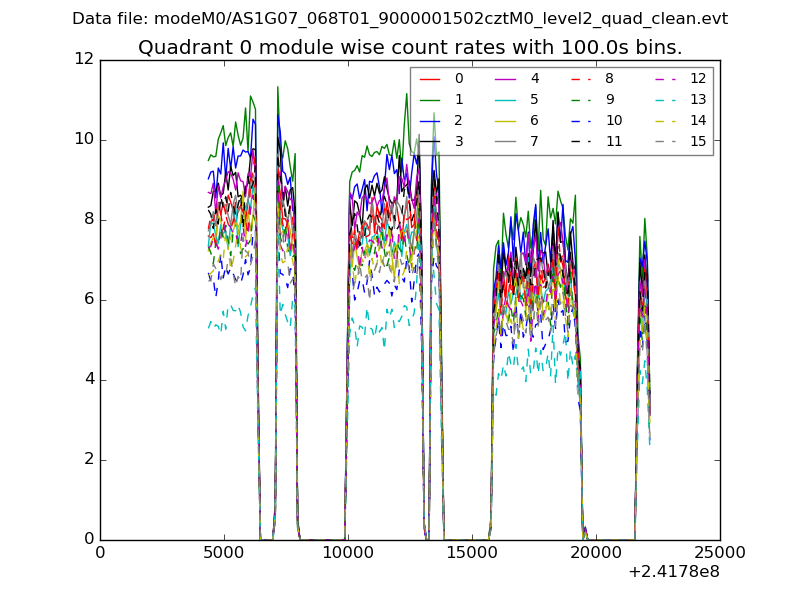 |
 |
| Module-wise count rates for Quadrant B Data is divided into 100 sec bins |
 |
 |
| Module-wise count rates for Quadrant C Data is divided into 100 sec bins |
 |
 |
| Module-wise count rates for Quadrant D Data is divided into 100 sec bins |
 |
 |
| Parameter | Plot |
|---|---|
| CZT HV Monitor | 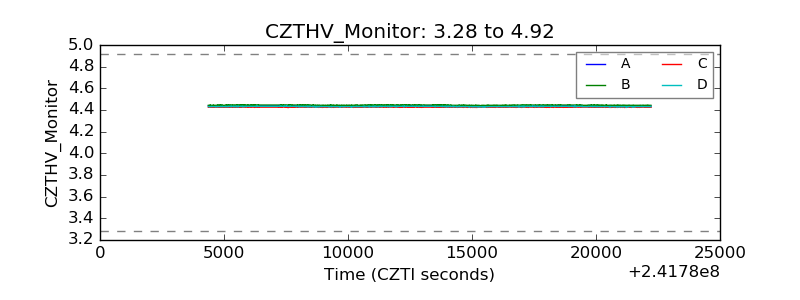 |
| D_VDD | 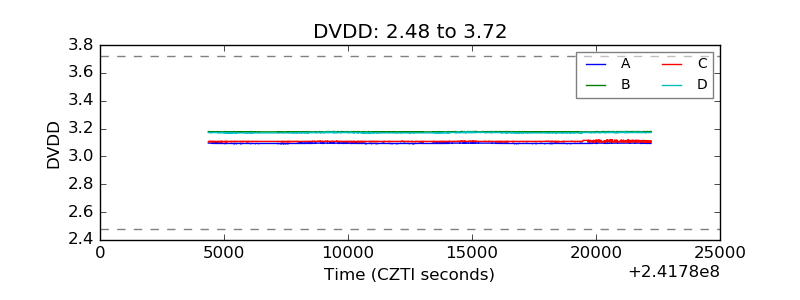 |
| Temperature 1 |  |
| Veto HV Monitor | 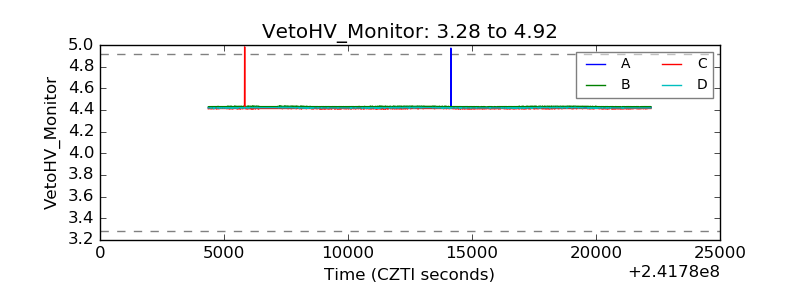 |
| Veto LLD |  |
| Alpha Counter |  |
| _CPM_Rate | 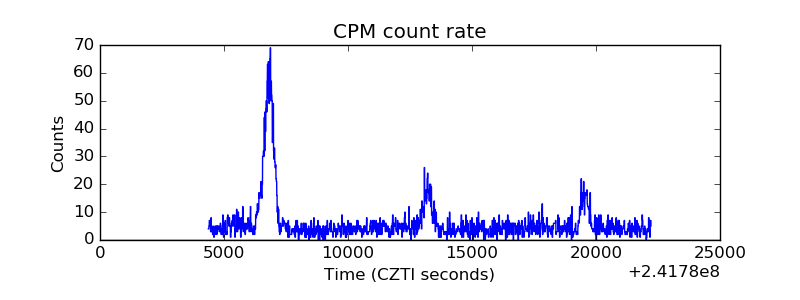 |
| CZT Counter |  |
| +2.5 Volts monitor | 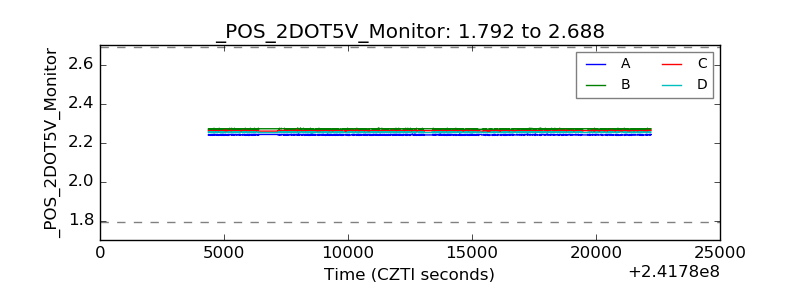 |
| +5 Volts monitor |  |
| _ROLL_ROT |  |
| _Roll_DEC | 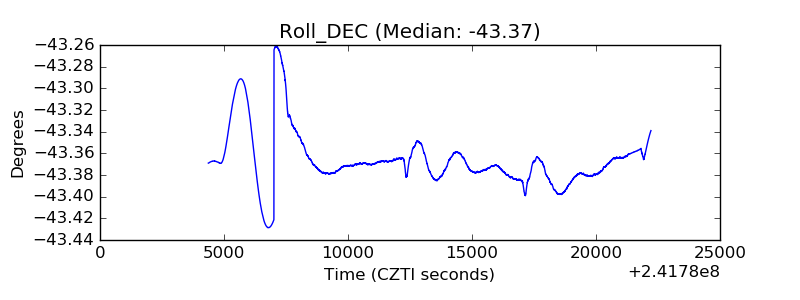 |
| _Roll_RA |  |
| Veto Counter |  |