| Param | Original file | Final file |
|---|---|---|
| Filename | modeM0/AS1G07_066T01_9000001510cztM0_level2.evt | modeM0/AS1G07_066T01_9000001510cztM0_level2_quad_clean.evt |
| Size (bytes) | 3,311,058,240 | 512,000,640 |
| Size | 3.1 GB | 488.3 MB |
| Events in quadrant A | 29,577,151 | 2,981,482 |
| Events in quadrant B | 24,023,127 | 3,280,679 |
| Events in quadrant C | 17,938,125 | 3,391,719 |
| Events in quadrant D | 26,170,930 | 3,234,865 |
| Mode SS | |||
|---|---|---|---|
| Quadrant | BADHDUFLAG | Total packets | Discarded packets |
| A | 0 | 845 | 0 |
| B | 0 | 849 | 0 |
| C | 0 | 849 | 0 |
| D | 0 | 61 | 0 |
| Mode M0 | |||
|---|---|---|---|
| Quadrant | BADHDUFLAG | Total packets | Discarded packets |
| A | 0 | 111964 | 0 |
| B | 0 | 97342 | 0 |
| C | 0 | 81735 | 0 |
| D | 0 | 103893 | 0 |
| Mode M9 | |||
|---|---|---|---|
| Quadrant | BADHDUFLAG | Total packets | Discarded packets |
| A | 0 | 47 | 0 |
| B | 0 | 47 | 0 |
| C | 0 | 47 | 0 |
| D | 0 | 47 | 0 |
| Quadrant | Total seconds | Saturated seconds | Saturation percentage |
|---|---|---|---|
| A | 36212 | 2453 | 6.773998% |
| B | 38959 | 1787 | 4.586873% |
| C | 40033 | 288 | 0.719406% |
| D | 40028 | 777 | 1.941141% |
Noise dominated data is calculated using 1-second bins in cleaned event files. If a bin has >2000 counts, and if more than 50% of those come from <1% of pixels, then it is considered to be noise-dominated and hence unusable.
| Quadrant | # 1 sec bins | Bins with >0 counts | Bins with >2000 counts | High rate bins dominated by noise | Noise dominated (total time) | Noise dominated (detector-on time) | Marked lightcurve |
|---|---|---|---|---|---|---|---|
| A | 47023 | 37624 | 1501 | 1501 | 3.19% | 3.99% | 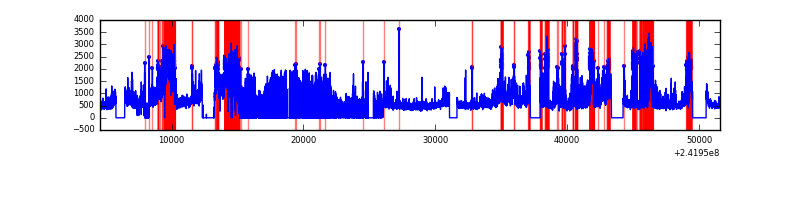 |
| B | 47023 | 40633 | 946 | 946 | 2.01% | 2.33% |  |
| C | 47023 | 41575 | 20 | 20 | 0.04% | 0.05% |  |
| D | 47023 | 41118 | 389 | 389 | 0.83% | 0.95% |  |
Top three noisy pixels from each quadrant. If the there are fewer than three noisy pixels in the level2.evt file, extra rows are filled as -1
| Pixel properties | Quadrant properties | ||||||
|---|---|---|---|---|---|---|---|
| Quadrant | DetID | PixID | Counts | Sigma | Mean | Median | Sigma |
| A | 13 | 251 | 12823578 | 15351.88 | 4119 | 4028 | 835.0 |
| A | 3 | 80 | 731555 | 871.24 | 4119 | 4028 | 835.0 |
| A | 15 | 174 | 97456 | 111.88 | 4119 | 4028 | 835.0 |
| B | 4 | 239 | 5720861 | 6745.3 | 4472 | 4352 | 847.5 |
| B | 4 | 81 | 254353 | 294.99 | 4472 | 4352 | 847.5 |
| B | 0 | 214 | 245949 | 285.08 | 4472 | 4352 | 847.5 |
| C | 14 | 234 | 126247 | 116.03 | 4554 | 4576 | 1048.7 |
| C | 13 | 61 | 34264 | 28.31 | 4554 | 4576 | 1048.7 |
| C | 14 | 67 | 26932 | 21.32 | 4554 | 4576 | 1048.7 |
| D | 8 | 195 | 3734837 | 3466.42 | 4485 | 4367 | 1076.2 |
| D | 1 | 20 | 1096137 | 1014.49 | 4485 | 4367 | 1076.2 |
| D | 5 | 222 | 1035633 | 958.27 | 4485 | 4367 | 1076.2 |
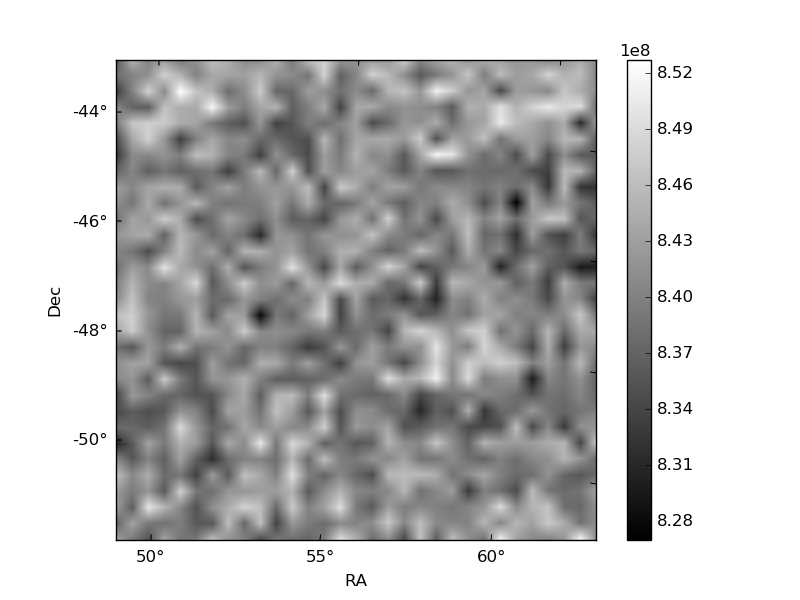
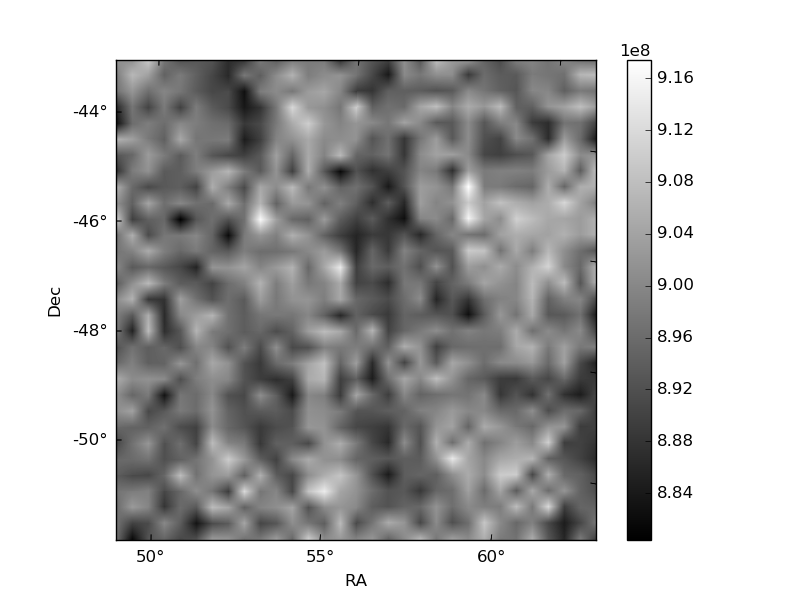
Histogram calculated using DETX and DETY for each event in the final _common_clean file
| Quadrant A | 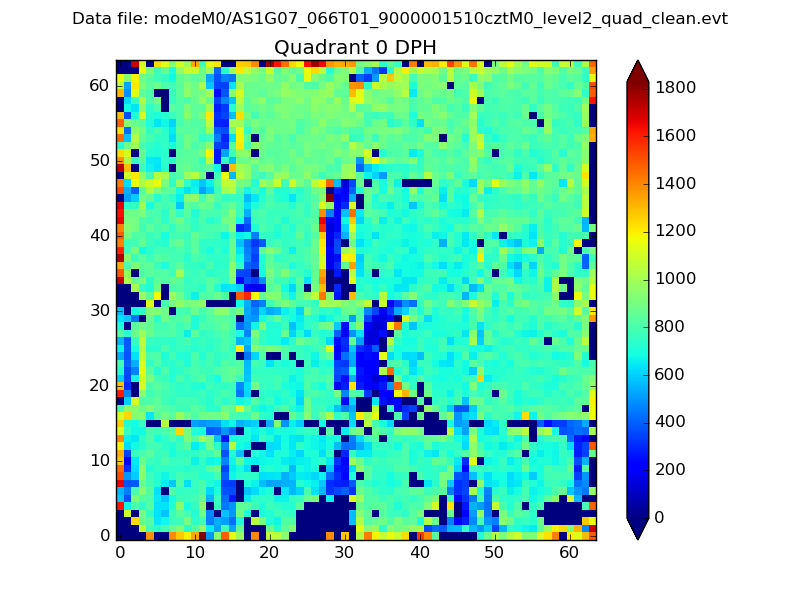 |
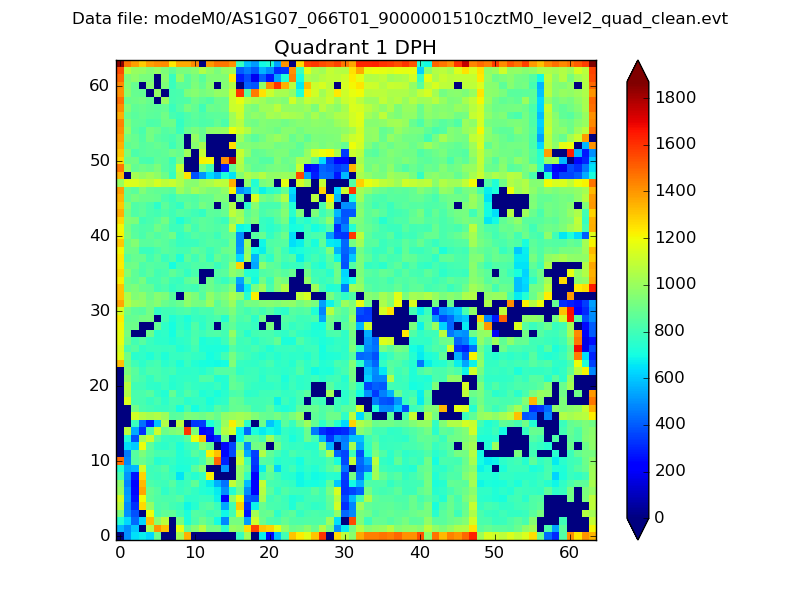 |
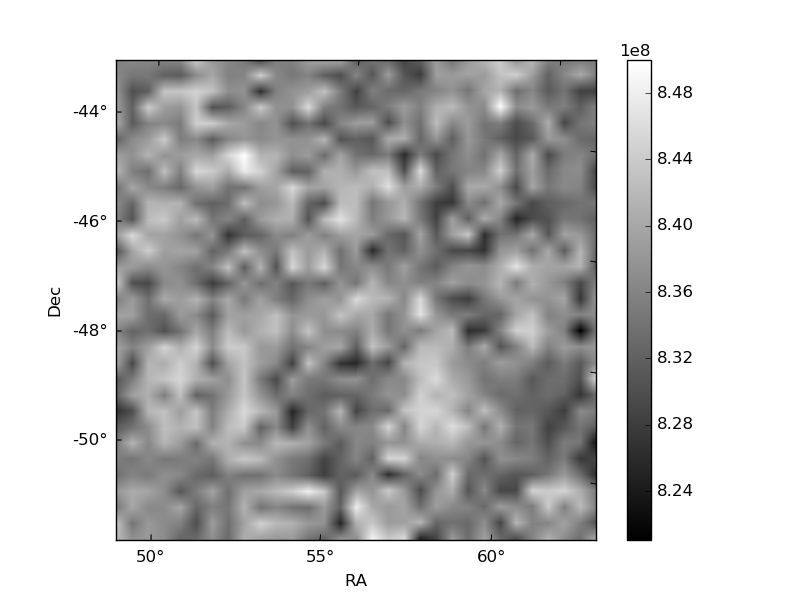
Quadrant B |
|---|---|---|---|
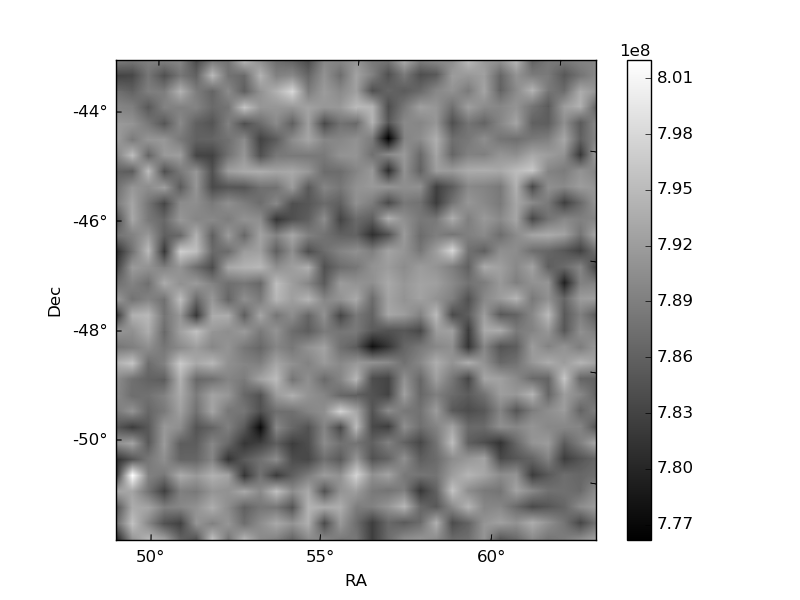
| Quadrant D | 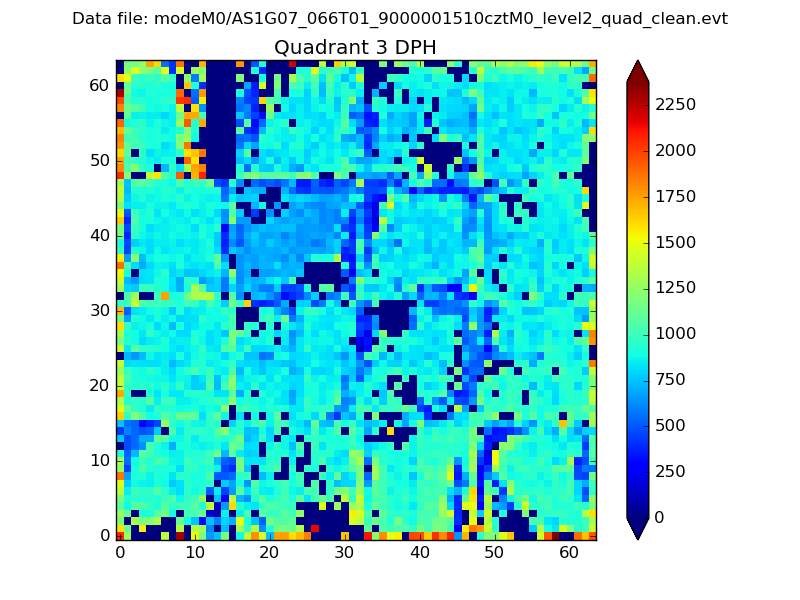 |
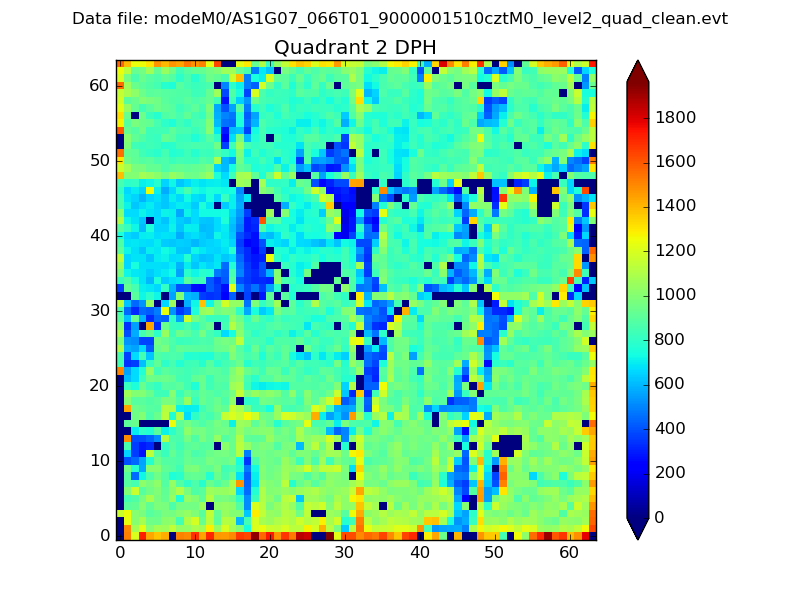 |
Quadrant C |
| Plot type | Count rate plots | Images |
|---|---|---|
| Comparison with Poisson distribution Blue bars denote a histogram of data divided into 1 sec bins. Red curve is a Poisson curve with rate = median count rate of data. |
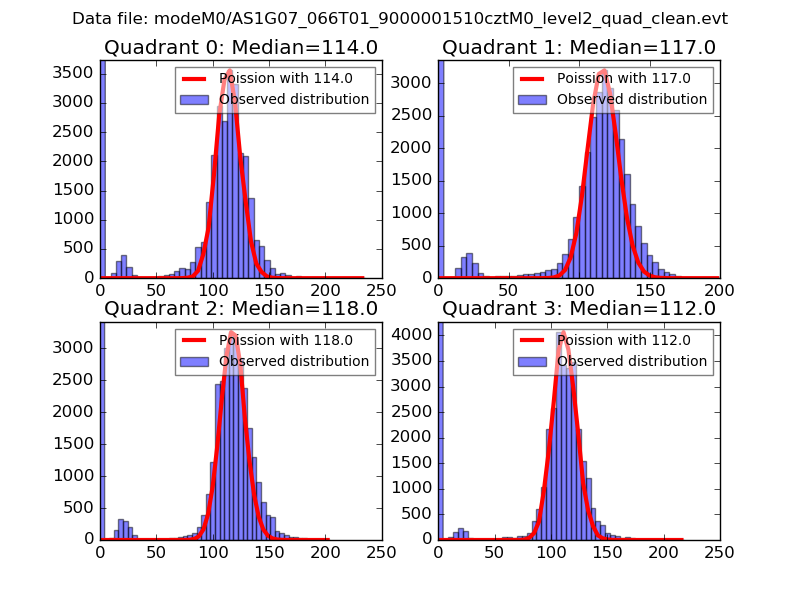 |
 |
| Quadrant-wise count rates Data is divided into 100 sec bins |
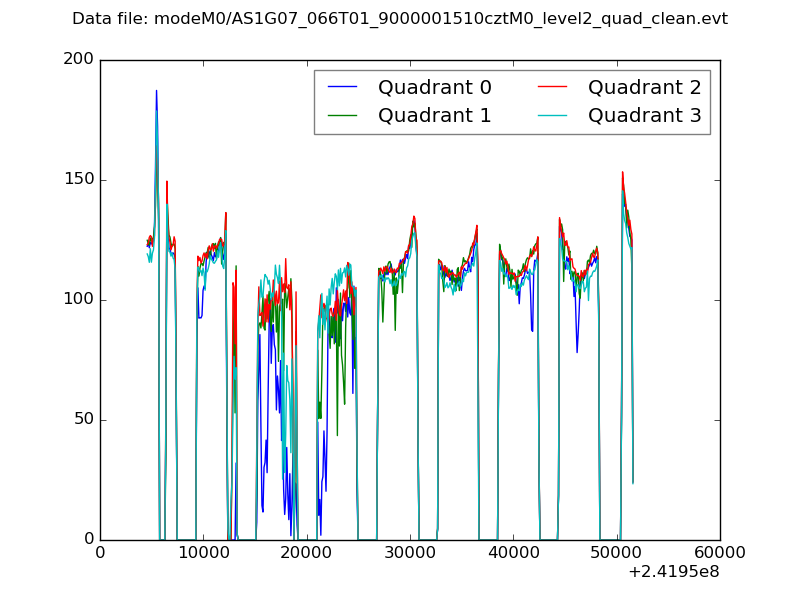 |
|
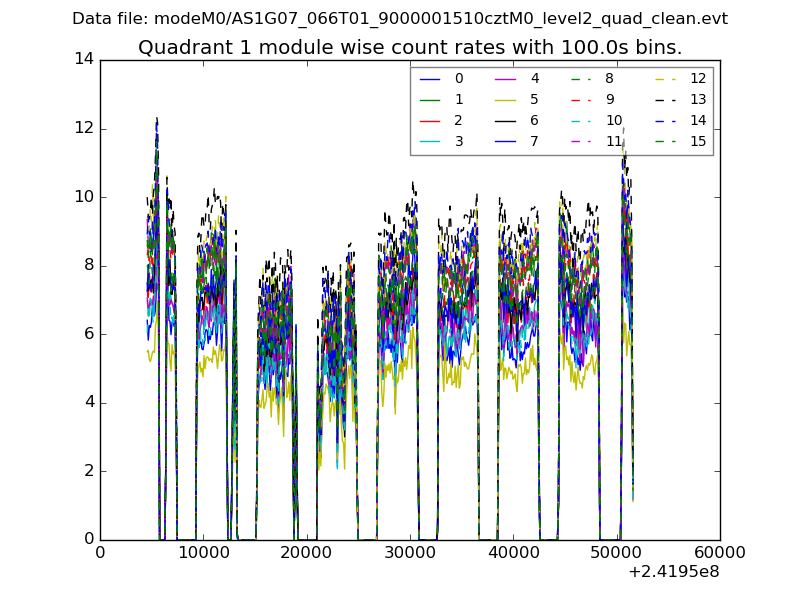
| Module-wise count rates for Quadrant A Data is divided into 100 sec bins |
 |
 |
| Module-wise count rates for Quadrant B Data is divided into 100 sec bins |
 |
 |
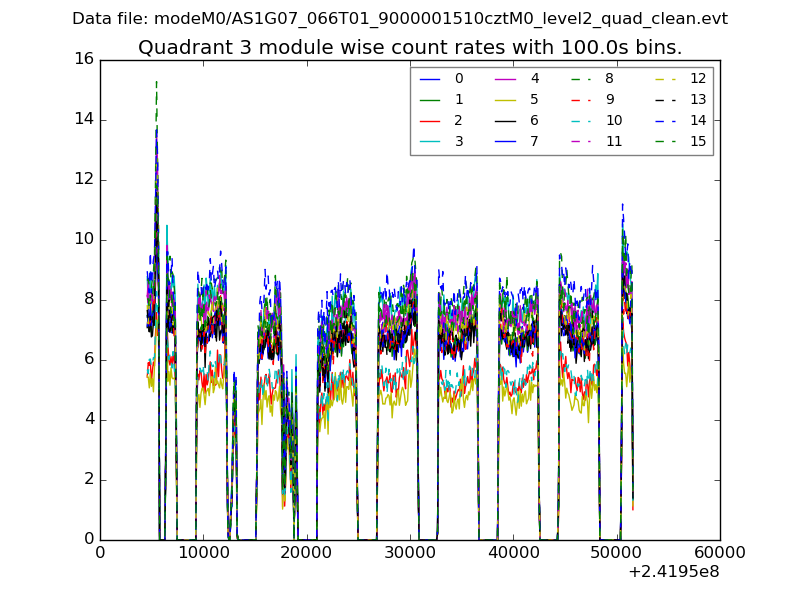
| Module-wise count rates for Quadrant C Data is divided into 100 sec bins |
 |
 |
| Module-wise count rates for Quadrant D Data is divided into 100 sec bins |
 |
 |
| Parameter | Plot |
|---|---|
| CZT HV Monitor |  |
| D_VDD | 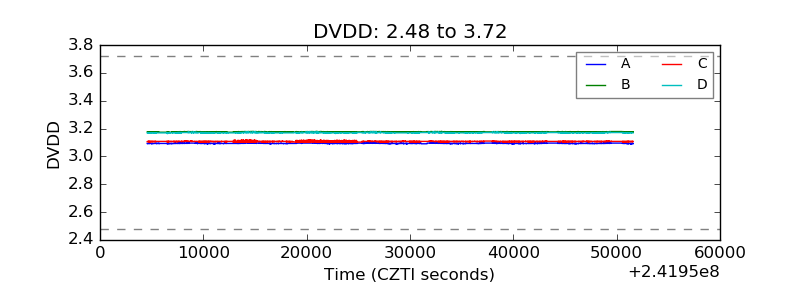 |
| Temperature 1 | 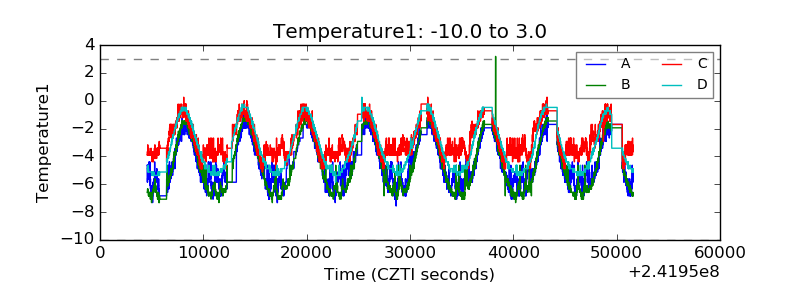 |
| Veto HV Monitor | 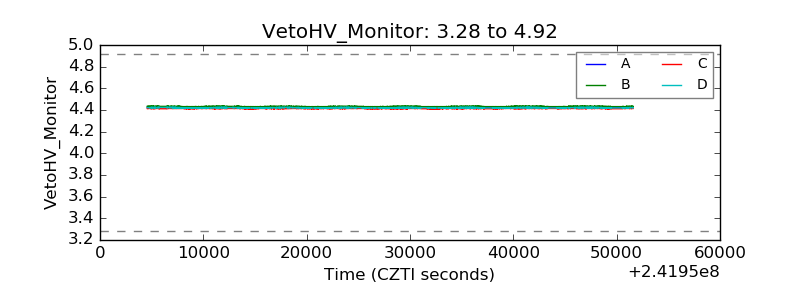 |
| Veto LLD | 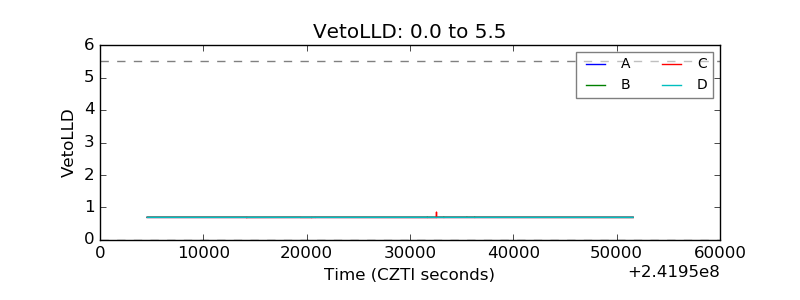 |
| Alpha Counter |  |
| _CPM_Rate | 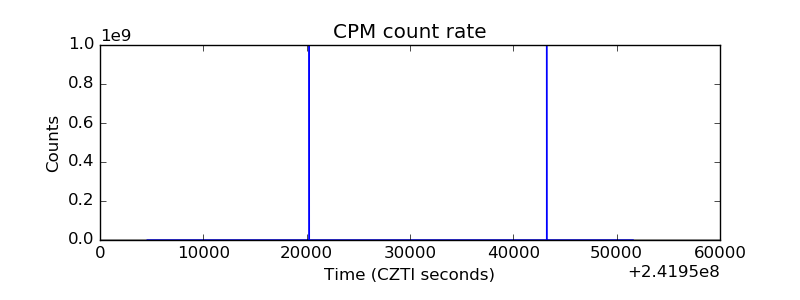 |
| CZT Counter | 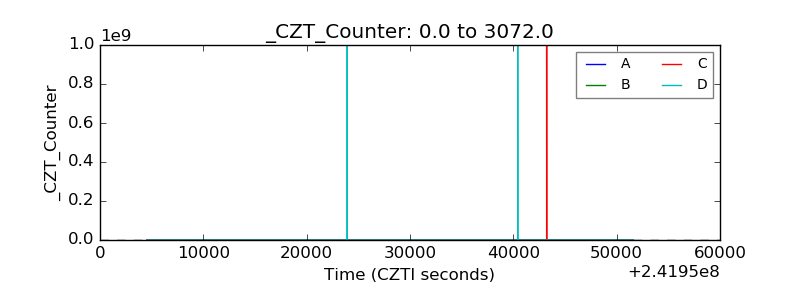 |
| +2.5 Volts monitor |  |
| +5 Volts monitor |  |
| _ROLL_ROT |  |
| _Roll_DEC | 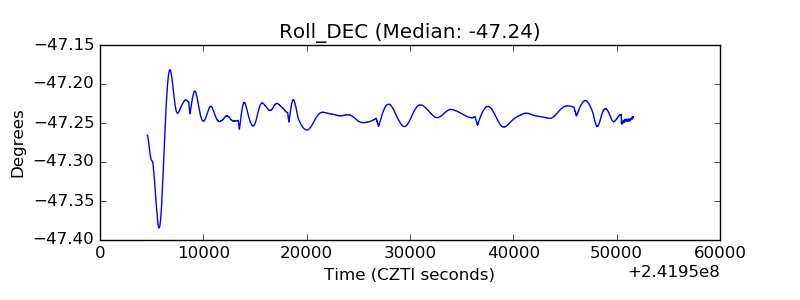 |
| _Roll_RA |  |
| Veto Counter | 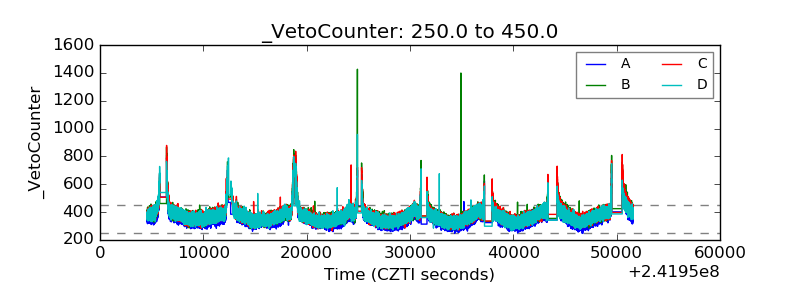 |