| Param | Original file | Final file |
|---|---|---|
| Filename | modeM0/AS1A03_127T02_9000001522cztM0_level2.evt | modeM0/AS1A03_127T02_9000001522cztM0_level2_quad_clean.evt |
| Size (bytes) | 3,803,181,120 | 940,052,160 |
| Size | 3.5 GB | 896.5 MB |
| Events in quadrant A | 24,799,514 | 6,052,324 |
| Events in quadrant B | 26,411,096 | 6,035,470 |
| Events in quadrant C | 23,347,527 | 6,686,779 |
| Events in quadrant D | 37,188,911 | 6,210,946 |
| Mode M0 | |||
|---|---|---|---|
| Quadrant | BADHDUFLAG | Total packets | Discarded packets |
| A | 0 | 106656 | 0 |
| B | 0 | 110498 | 0 |
| C | 0 | 105546 | 0 |
| D | 0 | 145058 | 0 |
| Mode SS | |||
|---|---|---|---|
| Quadrant | BADHDUFLAG | Total packets | Discarded packets |
| A | 0 | 1105 | 0 |
| B | 0 | 1120 | 0 |
| C | 0 | 1120 | 0 |
| D | 0 | 1088 | 0 |
| Mode M9 | |||
|---|---|---|---|
| Quadrant | BADHDUFLAG | Total packets | Discarded packets |
| A | 0 | 97 | 0 |
| B | 0 | 97 | 0 |
| C | 0 | 97 | 0 |
| D | 0 | 97 | 0 |
| Quadrant | Total seconds | Saturated seconds | Saturation percentage |
|---|---|---|---|
| A | 49550 | 637 | 1.285570% |
| B | 48316 | 1324 | 2.740293% |
| C | 51859 | 355 | 0.684548% |
| D | 52804 | 3169 | 6.001439% |
Noise dominated data is calculated using 1-second bins in cleaned event files. If a bin has >2000 counts, and if more than 50% of those come from <1% of pixels, then it is considered to be noise-dominated and hence unusable.
| Quadrant | # 1 sec bins | Bins with >0 counts | Bins with >2000 counts | High rate bins dominated by noise | Noise dominated (total time) | Noise dominated (detector-on time) | Marked lightcurve |
|---|---|---|---|---|---|---|---|
| A | 105327 | 54904 | 204 | 204 | 0.19% | 0.37% | 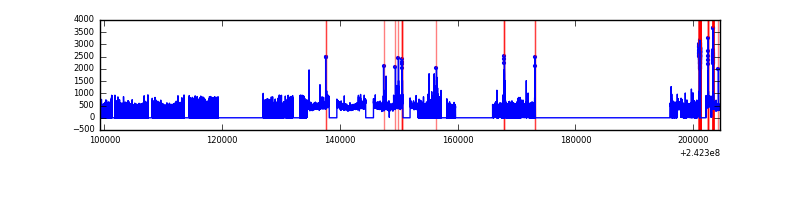 |
| B | 105327 | 53687 | 559 | 559 | 0.53% | 1.04% | 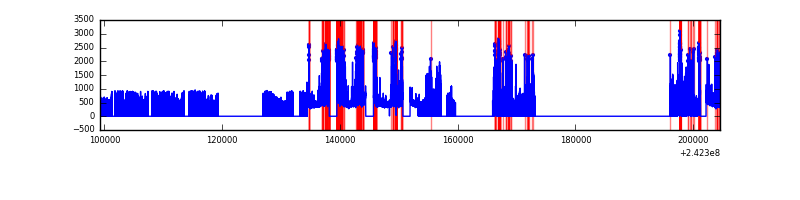 |
| C | 105327 | 57033 | 11 | 11 | 0.01% | 0.02% | 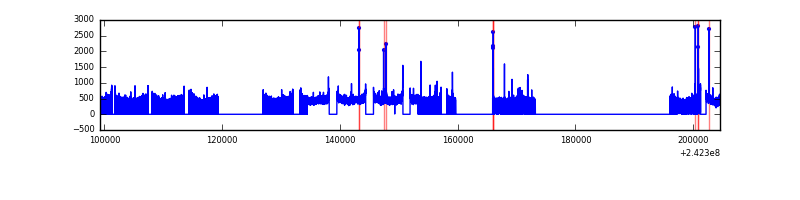 |
| D | 105327 | 55814 | 2662 | 2662 | 2.53% | 4.77% | 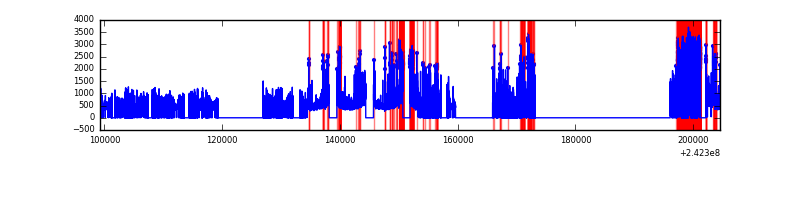 |
Top three noisy pixels from each quadrant. If the there are fewer than three noisy pixels in the level2.evt file, extra rows are filled as -1
| Pixel properties | Quadrant properties | ||||||
|---|---|---|---|---|---|---|---|
| Quadrant | DetID | PixID | Counts | Sigma | Mean | Median | Sigma |
| A | 15 | 239 | 1687189 | 1485.96 | 5670 | 5537 | 1131.7 |
| A | 3 | 80 | 475884 | 415.61 | 5670 | 5537 | 1131.7 |
| A | 13 | 251 | 338261 | 294.0 | 5670 | 5537 | 1131.7 |
| B | 4 | 239 | 3456697 | 3361.6 | 5569 | 5430 | 1026.7 |
| B | 11 | 51 | 443389 | 426.58 | 5569 | 5430 | 1026.7 |
| B | 0 | 214 | 416765 | 400.65 | 5569 | 5430 | 1026.7 |
| C | 14 | 234 | 134058 | 95.11 | 5945 | 5971 | 1346.7 |
| C | 13 | 61 | 44366 | 28.51 | 5945 | 5971 | 1346.7 |
| C | 4 | 175 | 18386 | 9.22 | 5945 | 5971 | 1346.7 |
| D | 2 | 16 | 7403938 | 5412.94 | 5807 | 5654 | 1366.8 |
| D | 1 | 52 | 2601669 | 1899.37 | 5807 | 5654 | 1366.8 |
| D | 1 | 20 | 2120964 | 1547.66 | 5807 | 5654 | 1366.8 |
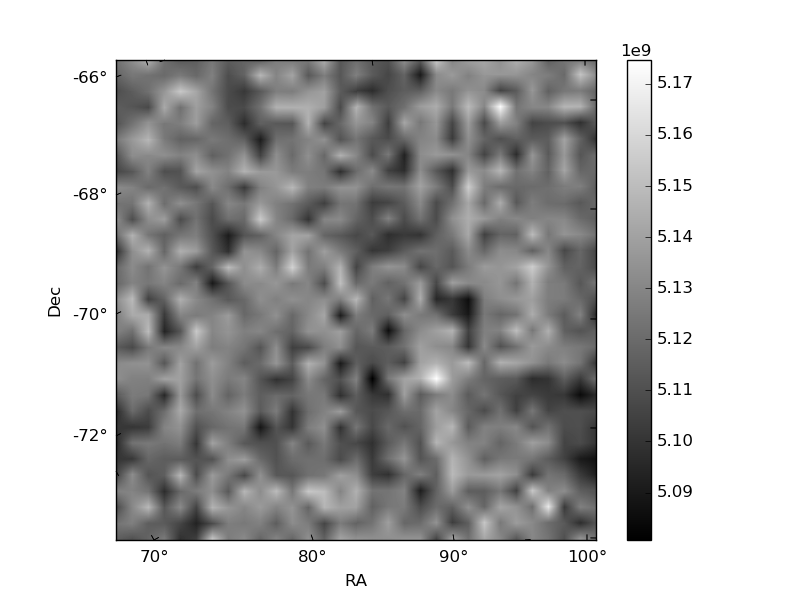
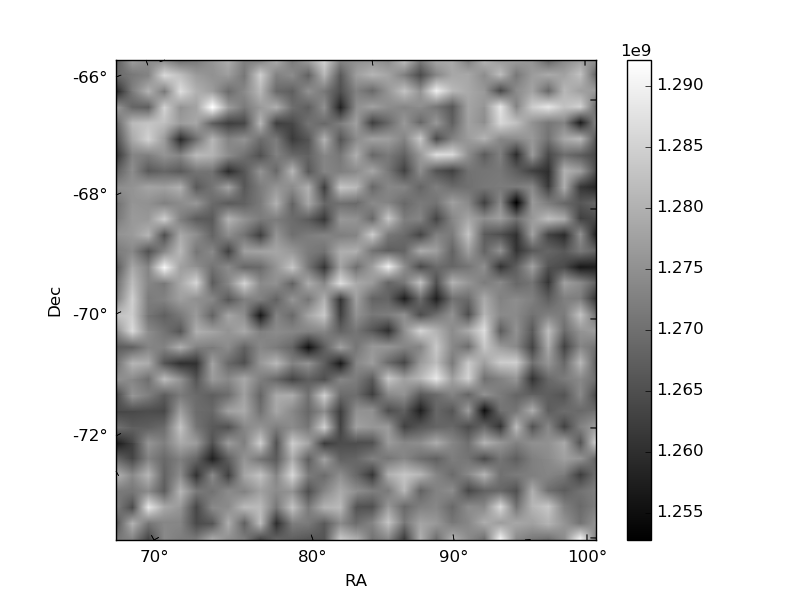
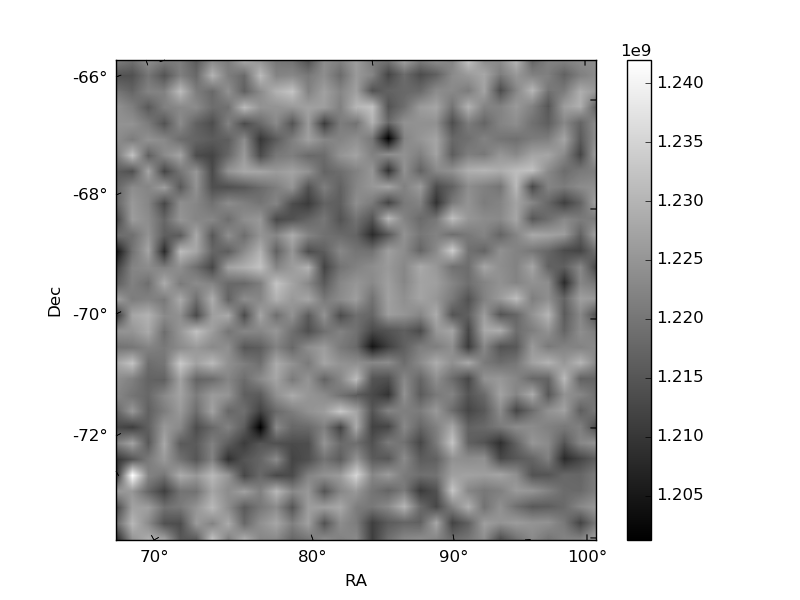
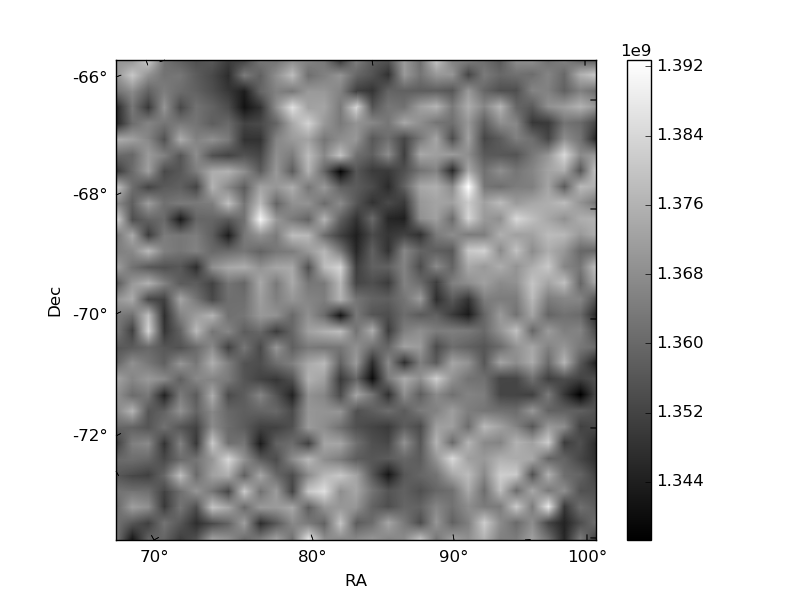
Histogram calculated using DETX and DETY for each event in the final _common_clean file
| Quadrant A | 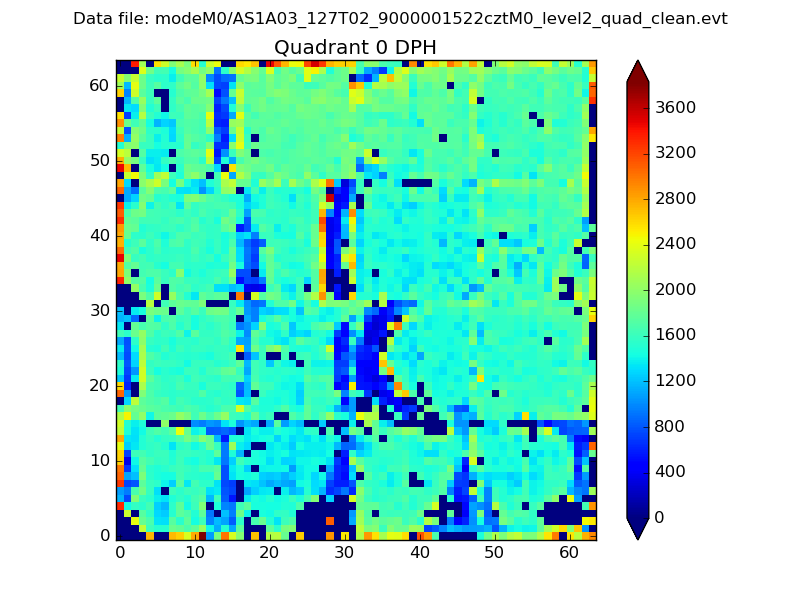 |
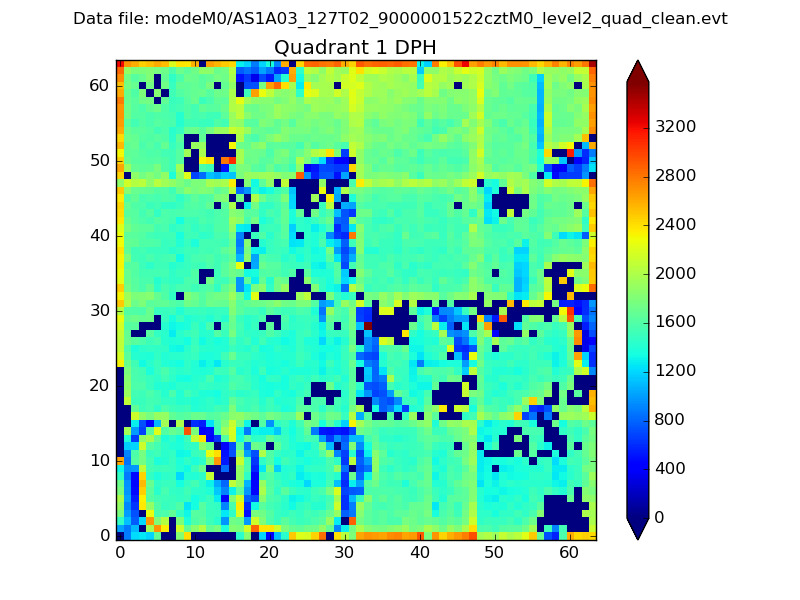 |
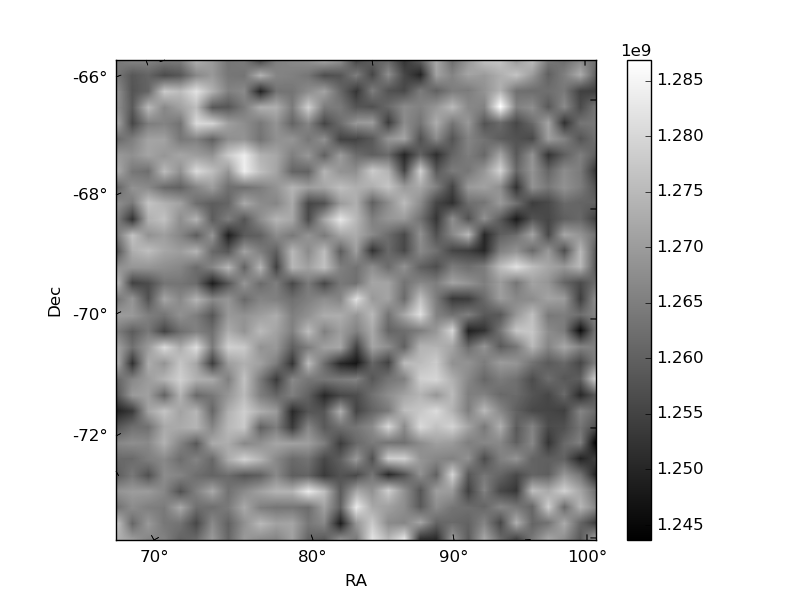
Quadrant B |
|---|---|---|---|
| Quadrant D | 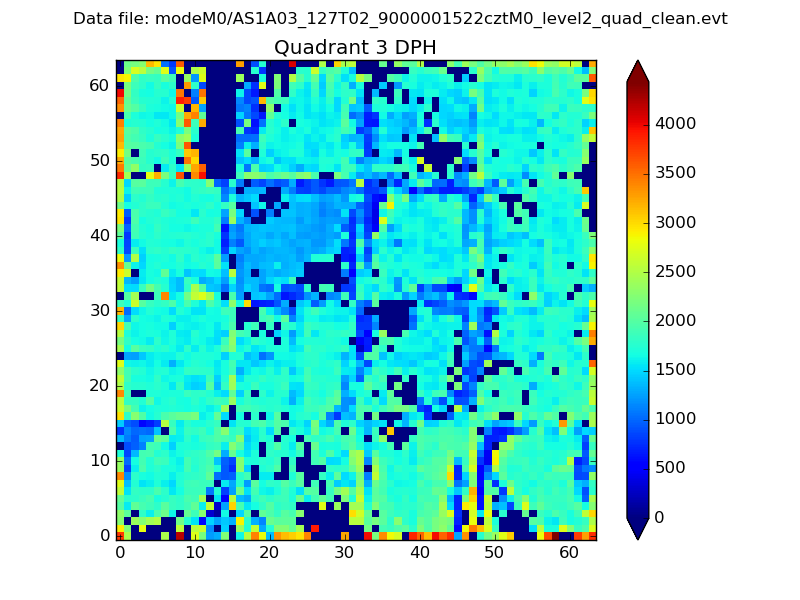 |
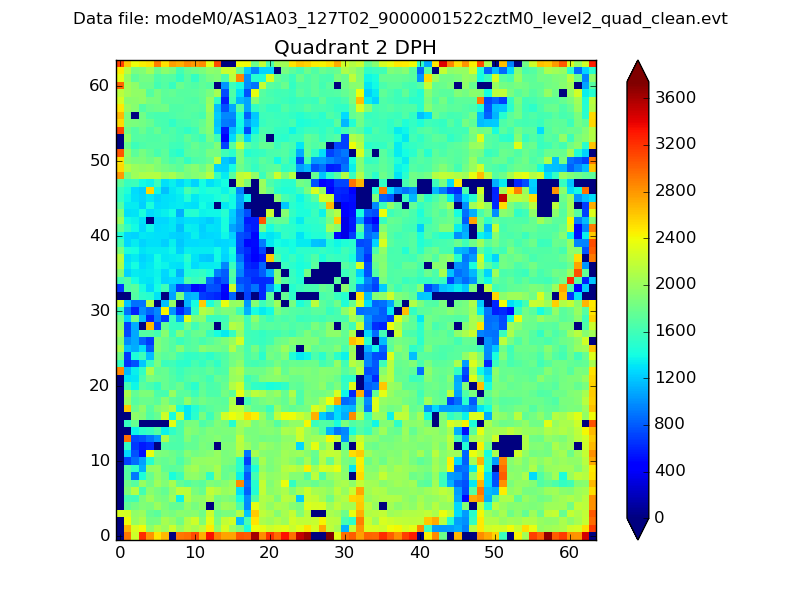 |
Quadrant C |
| Plot type | Count rate plots | Images |
|---|---|---|
| Comparison with Poisson distribution Blue bars denote a histogram of data divided into 1 sec bins. Red curve is a Poisson curve with rate = median count rate of data. |
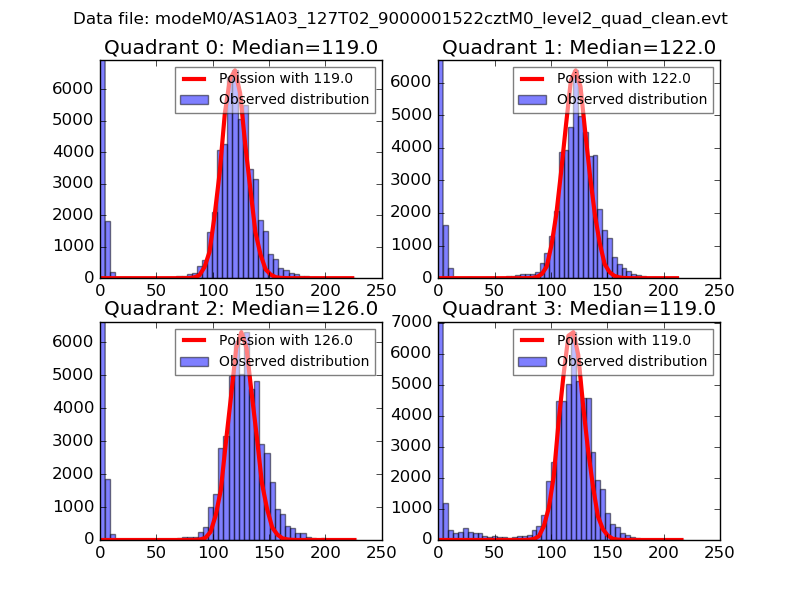 |
 |
| Quadrant-wise count rates Data is divided into 100 sec bins |
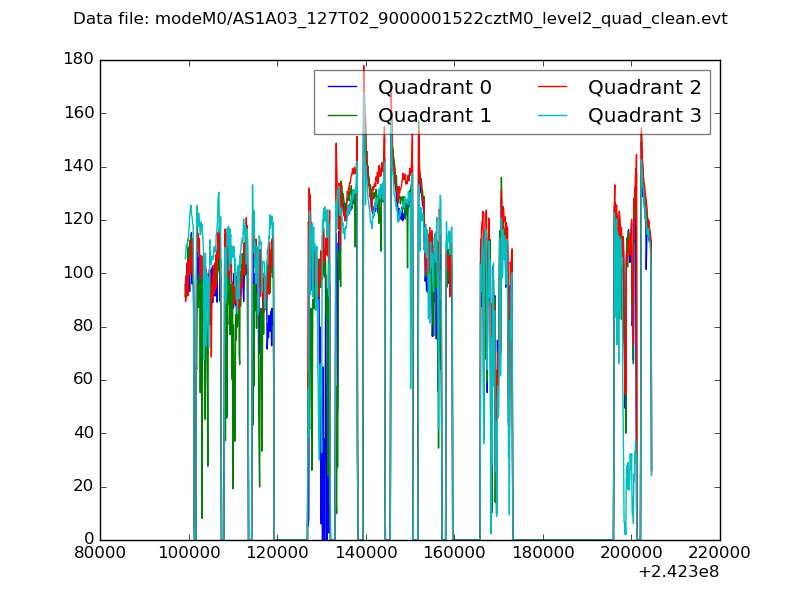 |
|
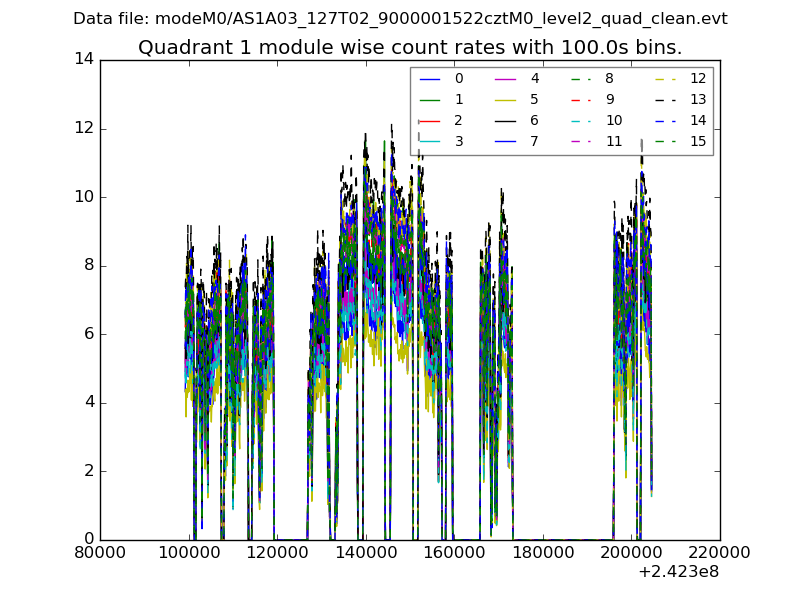
| Module-wise count rates for Quadrant A Data is divided into 100 sec bins |
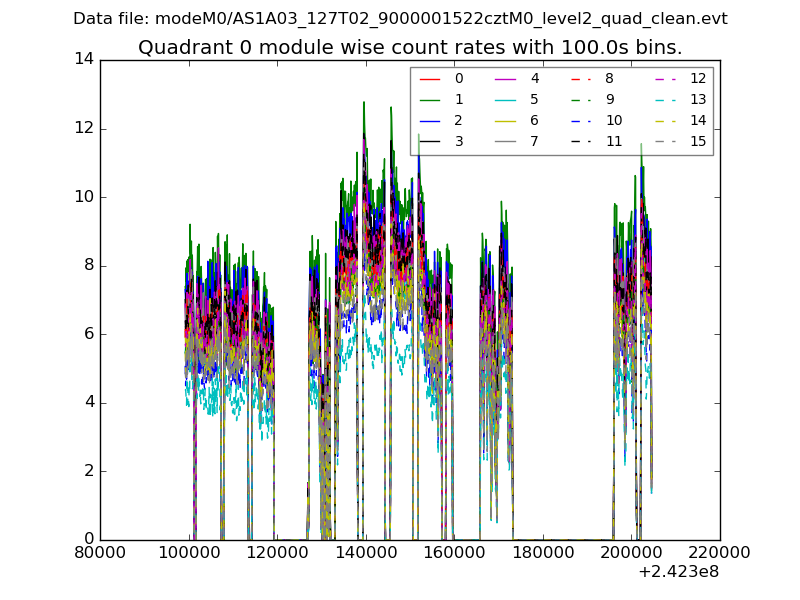 |
 |
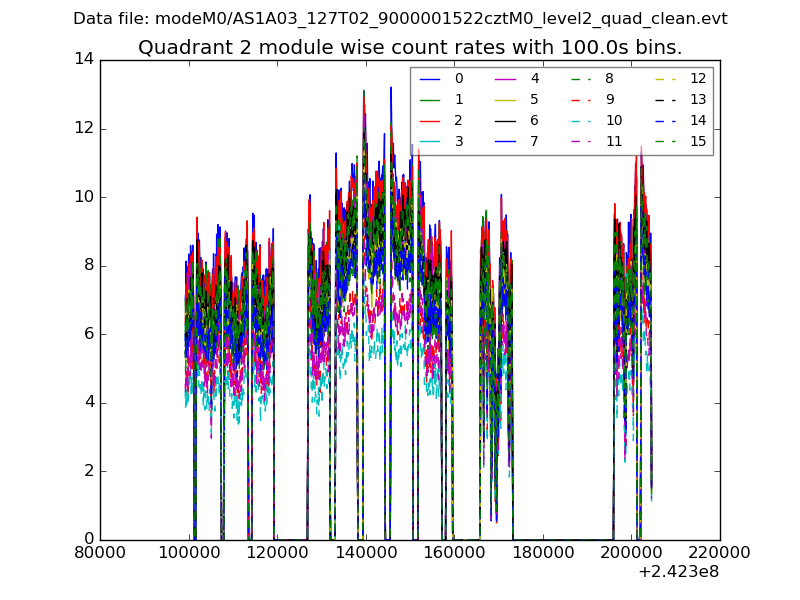
| Module-wise count rates for Quadrant B Data is divided into 100 sec bins |
 |
 |
| Module-wise count rates for Quadrant C Data is divided into 100 sec bins |
 |
 |
| Module-wise count rates for Quadrant D Data is divided into 100 sec bins |
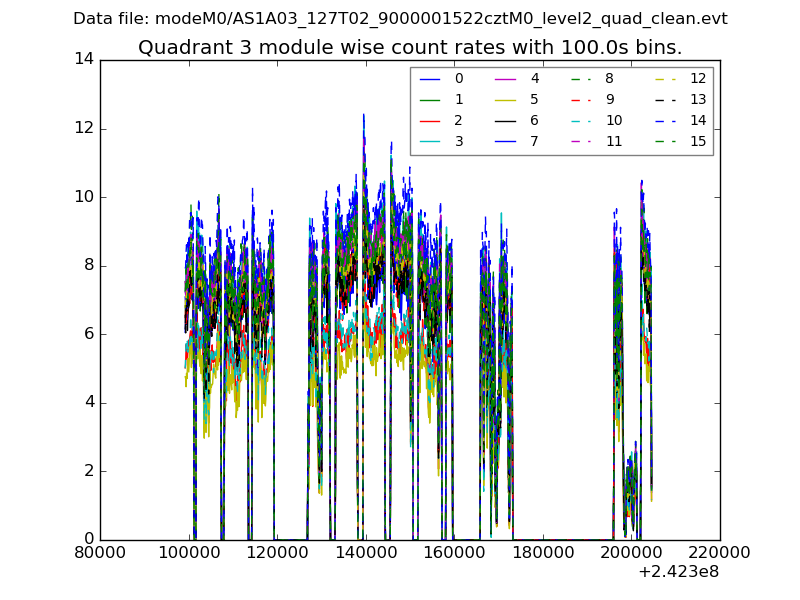 |
 |
| Parameter | Plot |
|---|---|
| CZT HV Monitor | 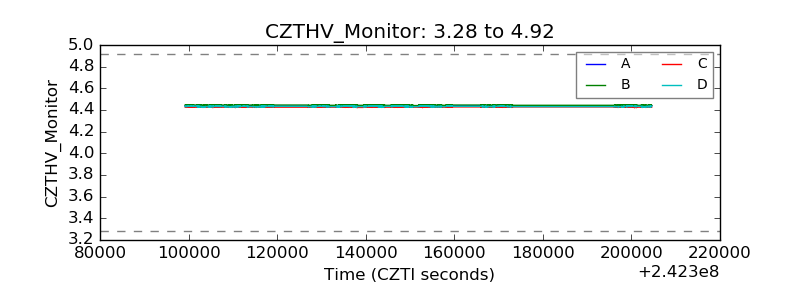 |
| D_VDD | 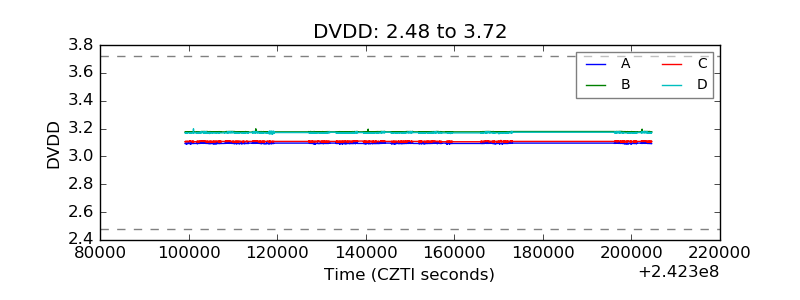 |
| Temperature 1 | 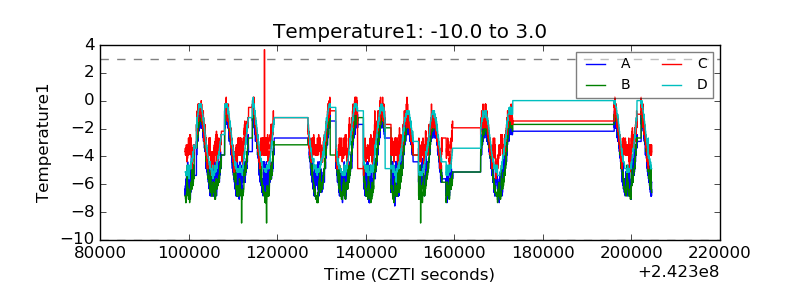 |
| Veto HV Monitor | 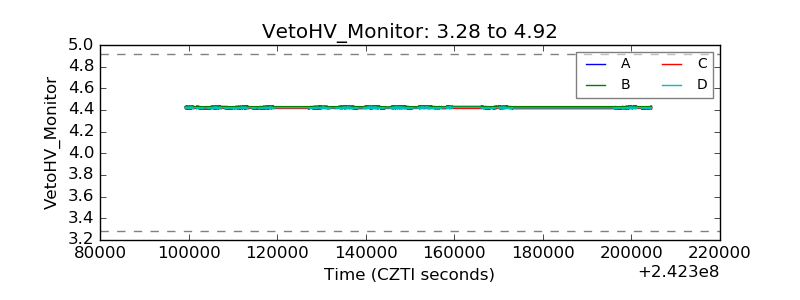 |
| Veto LLD | 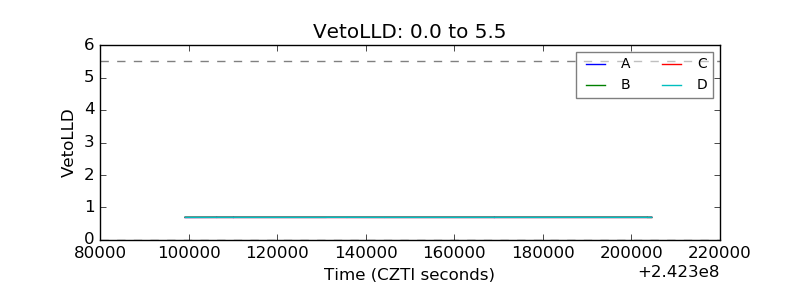 |
| Alpha Counter | 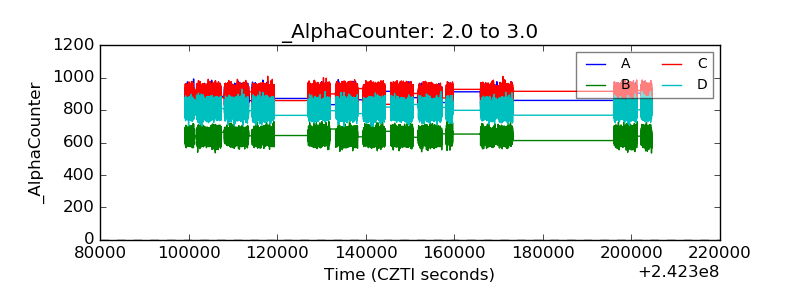 |
| _CPM_Rate | 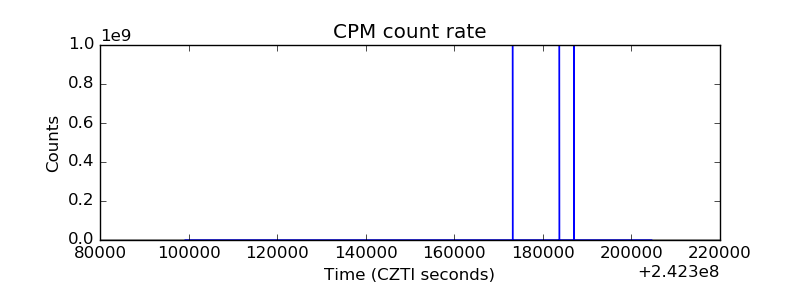 |
| CZT Counter | 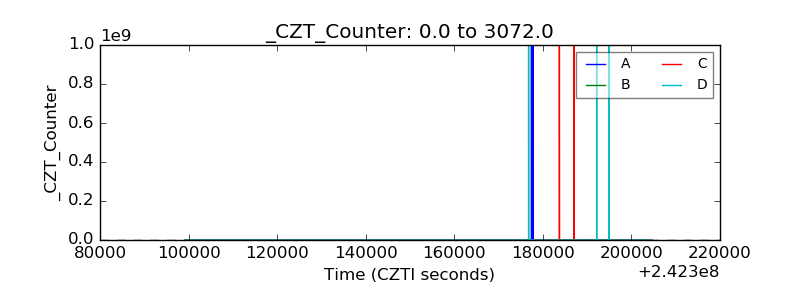 |
| +2.5 Volts monitor | 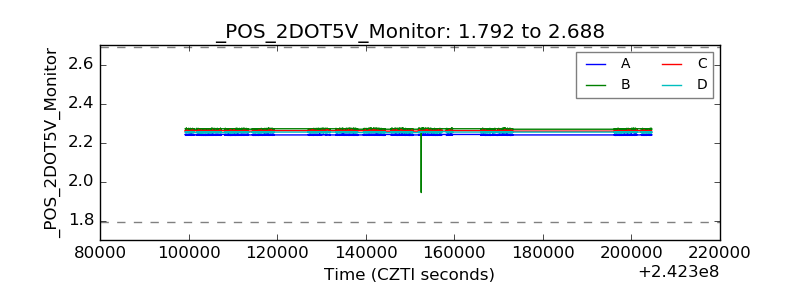 |
| +5 Volts monitor | 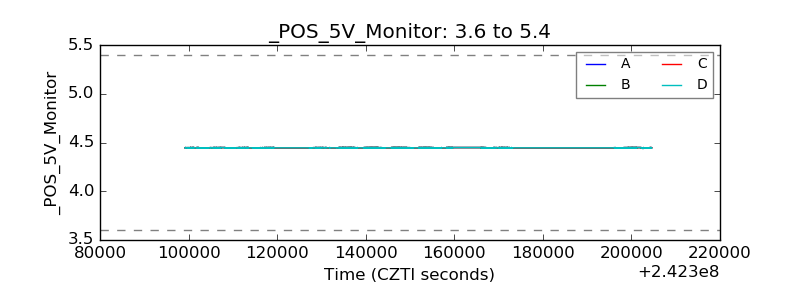 |
| _ROLL_ROT | 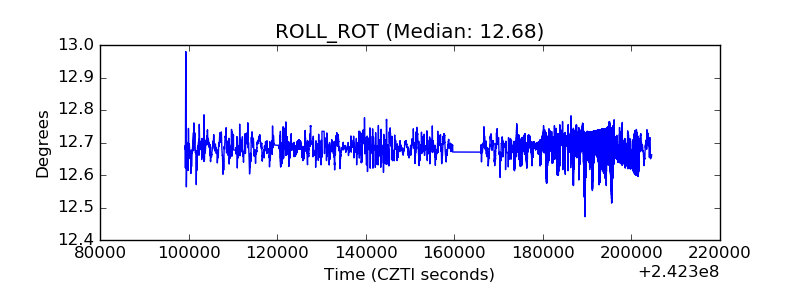 |
| _Roll_DEC | 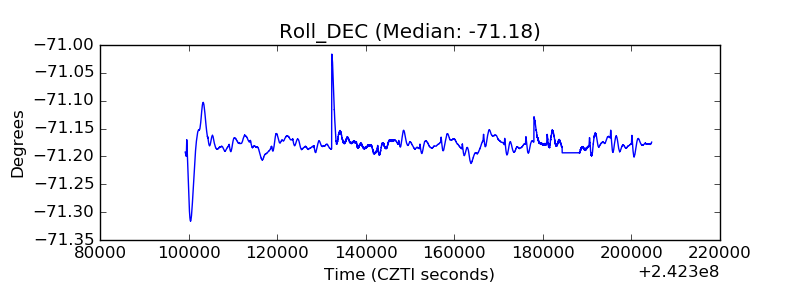 |
| _Roll_RA | 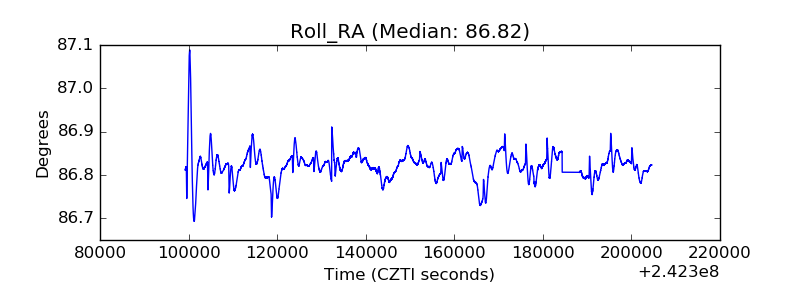 |
| Veto Counter | 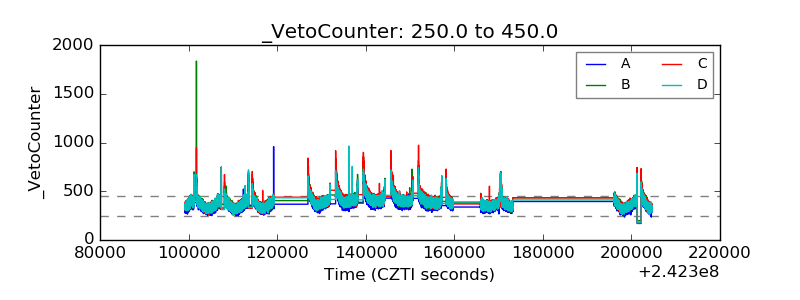 |