| Param | Original file | Final file |
|---|---|---|
| Filename | modeM0/AS1G07_032T01_9000001554cztM0_level2.evt | modeM0/AS1G07_032T01_9000001554cztM0_level2_quad_clean.evt |
| Size (bytes) | 595,702,080 | 80,458,560 |
| Size | 568.1 MB | 76.7 MB |
| Events in quadrant A | 4,717,132 | 485,160 |
| Events in quadrant B | 5,002,094 | 502,951 |
| Events in quadrant C | 3,255,203 | 505,506 |
| Events in quadrant D | 4,611,476 | 474,796 |
| Mode M0 | |||
|---|---|---|---|
| Quadrant | BADHDUFLAG | Total packets | Discarded packets |
| A | 0 | 18670 | 0 |
| B | 0 | 19388 | 0 |
| C | 0 | 14512 | 0 |
| D | 0 | 18151 | 0 |
| Mode SS | |||
|---|---|---|---|
| Quadrant | BADHDUFLAG | Total packets | Discarded packets |
| A | 0 | 110 | 0 |
| B | 0 | 98 | 0 |
| C | 0 | 114 | 0 |
| D | 0 | 96 | 0 |
| Mode M9 | |||
|---|---|---|---|
| Quadrant | BADHDUFLAG | Total packets | Discarded packets |
| A | 0 | 20 | 0 |
| B | 0 | 18 | 0 |
| C | 0 | 20 | 0 |
| D | 0 | 18 | 0 |
| Quadrant | Total seconds | Saturated seconds | Saturation percentage |
|---|---|---|---|
| A | 6750 | 260 | 3.851852% |
| B | 6832 | 659 | 9.645785% |
| C | 6888 | 64 | 0.929152% |
| D | 6810 | 192 | 2.819383% |
Noise dominated data is calculated using 1-second bins in cleaned event files. If a bin has >2000 counts, and if more than 50% of those come from <1% of pixels, then it is considered to be noise-dominated and hence unusable.
| Quadrant | # 1 sec bins | Bins with >0 counts | Bins with >2000 counts | High rate bins dominated by noise | Noise dominated (total time) | Noise dominated (detector-on time) | Marked lightcurve |
|---|---|---|---|---|---|---|---|
| A | 9423 | 7182 | 95 | 95 | 1.01% | 1.32% |  |
| B | 9424 | 7261 | 220 | 220 | 2.33% | 3.03% |  |
| C | 9424 | 7281 | 7 | 7 | 0.07% | 0.10% | 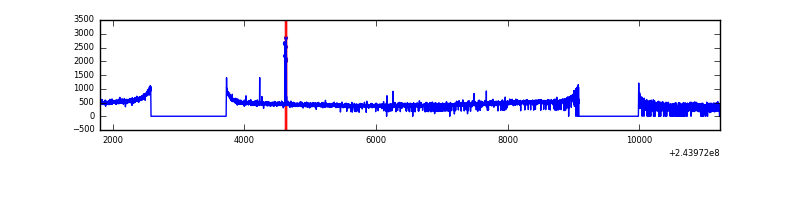 |
| D | 9424 | 7224 | 93 | 93 | 0.99% | 1.29% | 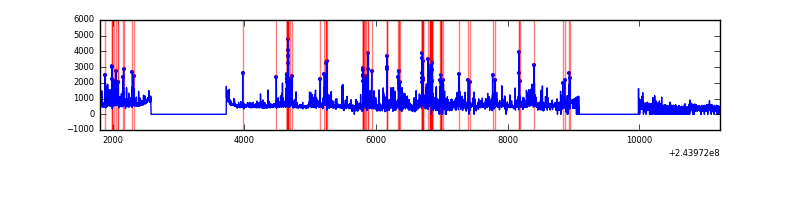 |
Top three noisy pixels from each quadrant. If the there are fewer than three noisy pixels in the level2.evt file, extra rows are filled as -1
| Pixel properties | Quadrant properties | ||||||
|---|---|---|---|---|---|---|---|
| Quadrant | DetID | PixID | Counts | Sigma | Mean | Median | Sigma |
| A | 15 | 239 | 1330616 | 7885.39 | 829 | 811 | 168.6 |
| A | 15 | 223 | 144753 | 853.54 | 829 | 811 | 168.6 |
| A | 1 | 162 | 10505 | 57.48 | 829 | 811 | 168.6 |
| B | 0 | 85 | 1032158 | 6446.68 | 830 | 810 | 160.0 |
| B | 4 | 239 | 630605 | 3936.68 | 830 | 810 | 160.0 |
| B | 4 | 81 | 38072 | 232.91 | 830 | 810 | 160.0 |
| C | 14 | 234 | 26115 | 131.02 | 827 | 832 | 193.0 |
| C | 13 | 61 | 6191 | 27.77 | 827 | 832 | 193.0 |
| C | 5 | 207 | 3150 | 12.01 | 827 | 832 | 193.0 |
| D | 1 | 52 | 417785 | 2130.49 | 807 | 785 | 195.7 |
| D | 13 | 104 | 376477 | 1919.45 | 807 | 785 | 195.7 |
| D | 13 | 249 | 280715 | 1430.19 | 807 | 785 | 195.7 |
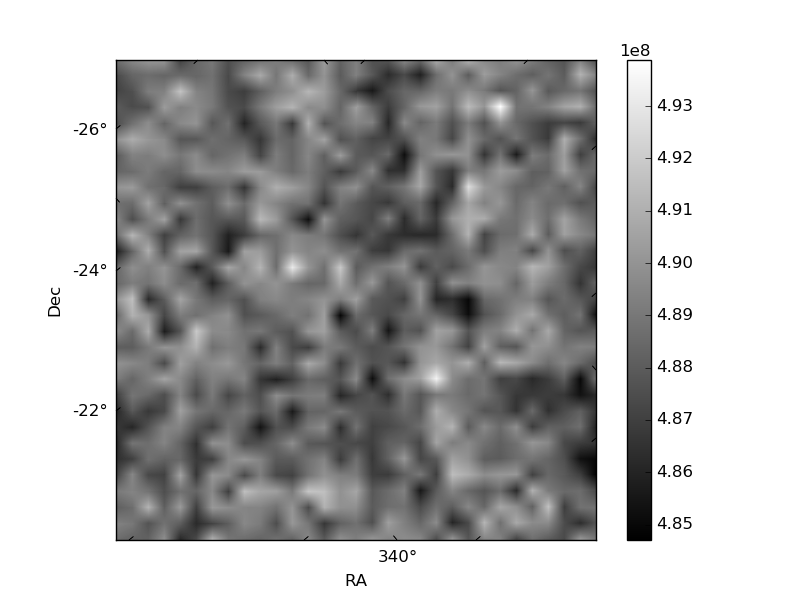
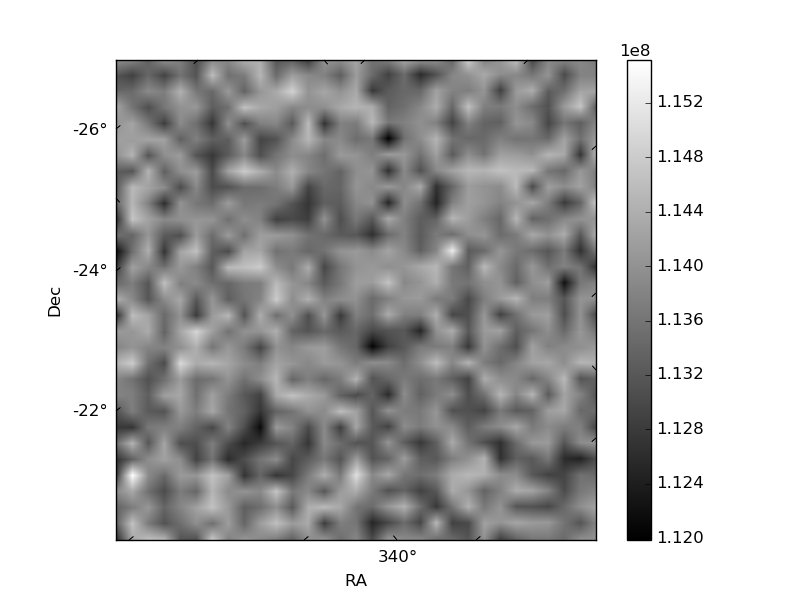
Histogram calculated using DETX and DETY for each event in the final _common_clean file
| Quadrant A | 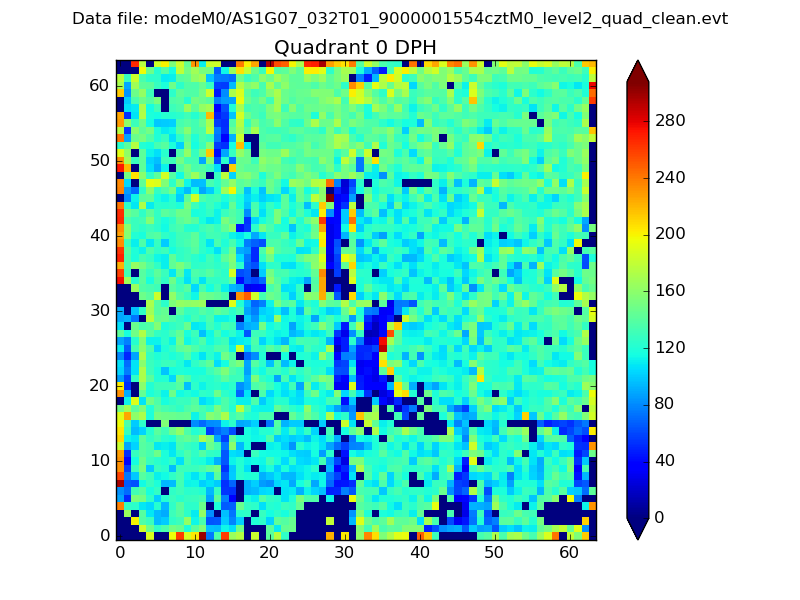 |
 |
Quadrant B |
|---|---|---|---|
| Quadrant D |  |
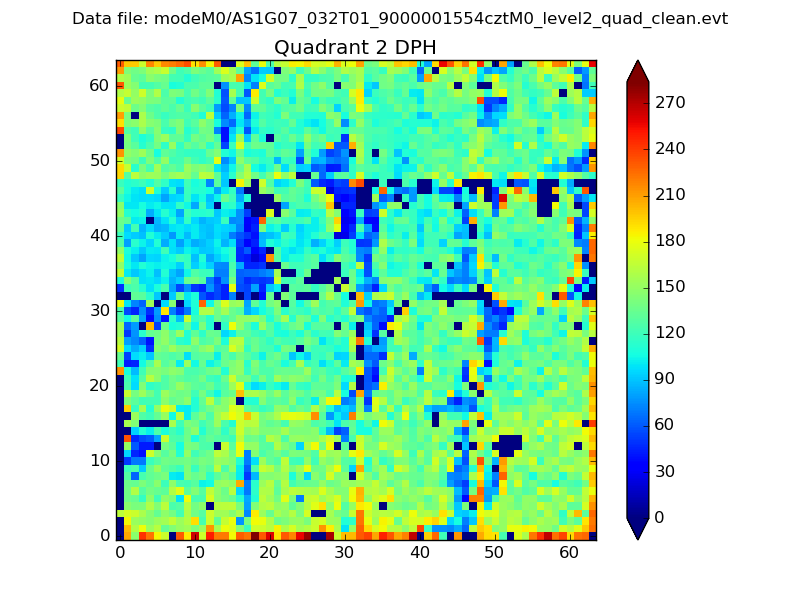 |
Quadrant C |
| Plot type | Count rate plots | Images |
|---|---|---|
| Comparison with Poisson distribution Blue bars denote a histogram of data divided into 1 sec bins. Red curve is a Poisson curve with rate = median count rate of data. |
 |
 |
| Quadrant-wise count rates Data is divided into 100 sec bins |
 |
|
| Module-wise count rates for Quadrant A Data is divided into 100 sec bins |
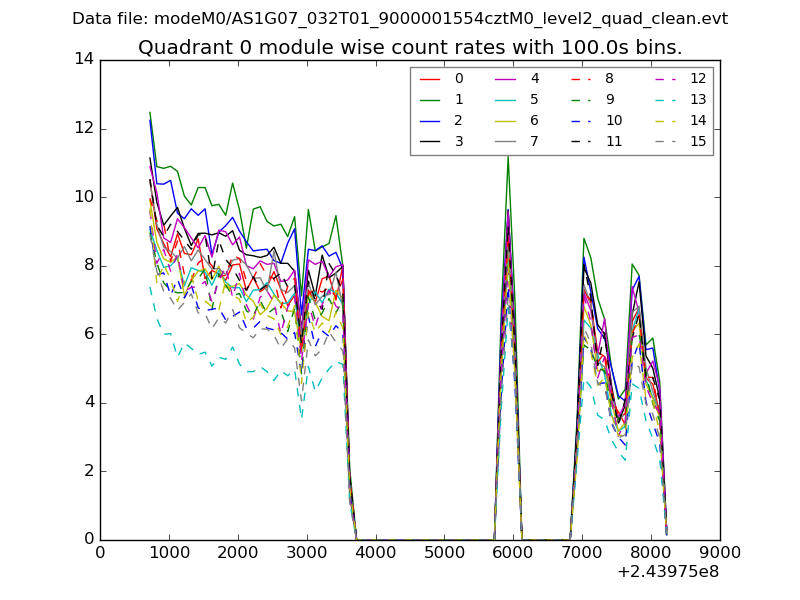 |
 |
| Module-wise count rates for Quadrant B Data is divided into 100 sec bins |
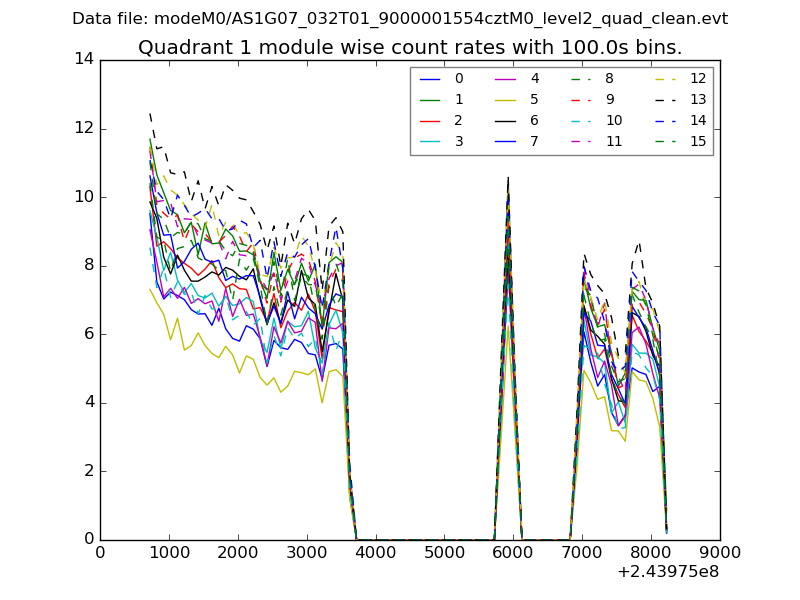 |
 |
| Module-wise count rates for Quadrant C Data is divided into 100 sec bins |
 |
 |
| Module-wise count rates for Quadrant D Data is divided into 100 sec bins |
 |
 |
| Parameter | Plot |
|---|---|
| CZT HV Monitor |  |
| D_VDD |  |
| Temperature 1 |  |
| Veto HV Monitor | 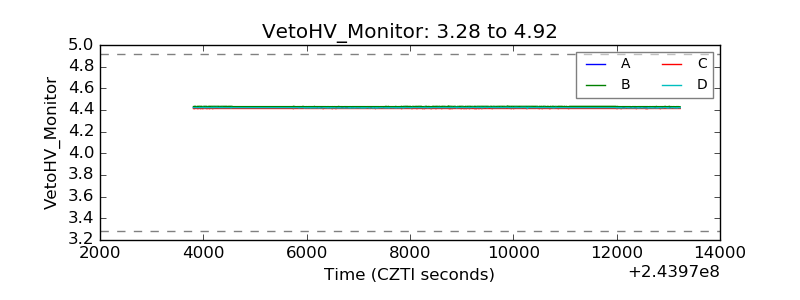 |
| Veto LLD |  |
| Alpha Counter | 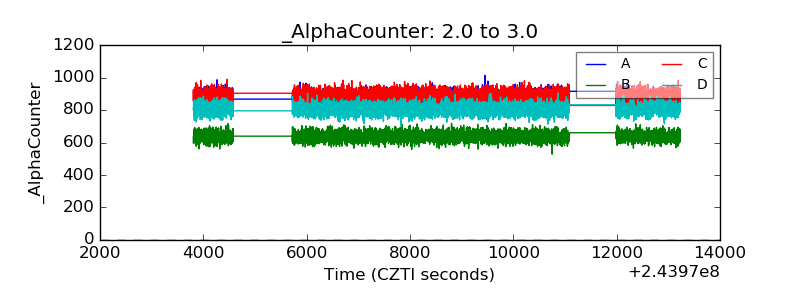 |
| _CPM_Rate | 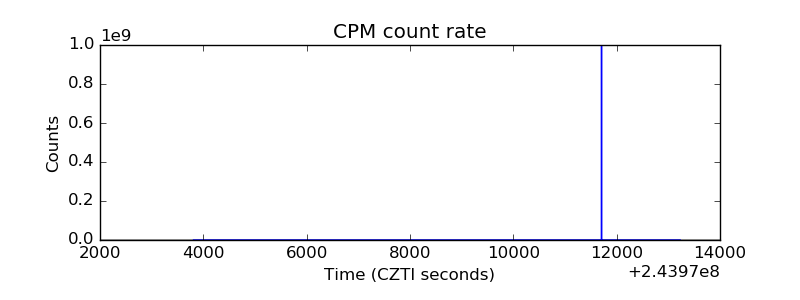 |
| CZT Counter |  |
| +2.5 Volts monitor |  |
| +5 Volts monitor |  |
| _ROLL_ROT | 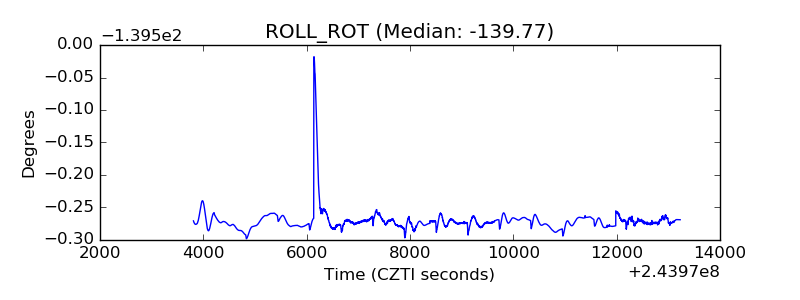 |
| _Roll_DEC |  |
| _Roll_RA |  |
| Veto Counter |  |