| Param | Original file | Final file |
|---|---|---|
| Filename | modeM0/AS1A04_113T01_9000001604cztM0_level2.evt | modeM0/AS1A04_113T01_9000001604cztM0_level2_quad_clean.evt |
| Size (bytes) | 2,521,388,160 | 305,003,520 |
| Size | 2.3 GB | 290.9 MB |
| Events in quadrant A | 25,562,818 | 1,750,415 |
| Events in quadrant B | 17,230,309 | 1,901,233 |
| Events in quadrant C | 12,408,457 | 1,957,131 |
| Events in quadrant D | 19,332,518 | 1,762,401 |
| Mode M9 | |||
|---|---|---|---|
| Quadrant | BADHDUFLAG | Total packets | Discarded packets |
| A | 0 | 23 | 0 |
| B | 0 | 21 | 0 |
| C | 0 | 23 | 0 |
| D | 0 | 23 | 0 |
| Mode SS | |||
|---|---|---|---|
| Quadrant | BADHDUFLAG | Total packets | Discarded packets |
| A | 0 | 560 | 0 |
| B | 0 | 564 | 0 |
| C | 0 | 584 | 0 |
| D | 0 | 556 | 0 |
| Mode M0 | |||
|---|---|---|---|
| Quadrant | BADHDUFLAG | Total packets | Discarded packets |
| A | 0 | 94247 | 0 |
| B | 0 | 69326 | 0 |
| C | 0 | 56552 | 0 |
| D | 0 | 75869 | 0 |
| Quadrant | Total seconds | Saturated seconds | Saturation percentage |
|---|---|---|---|
| A | 26503 | 3687 | 13.911633% |
| B | 27219 | 1615 | 5.933355% |
| C | 27543 | 160 | 0.580910% |
| D | 26876 | 1152 | 4.286352% |
Noise dominated data is calculated using 1-second bins in cleaned event files. If a bin has >2000 counts, and if more than 50% of those come from <1% of pixels, then it is considered to be noise-dominated and hence unusable.
| Quadrant | # 1 sec bins | Bins with >0 counts | Bins with >2000 counts | High rate bins dominated by noise | Noise dominated (total time) | Noise dominated (detector-on time) | Marked lightcurve |
|---|---|---|---|---|---|---|---|
| A | 35312 | 28072 | 2319 | 2319 | 6.57% | 8.26% | 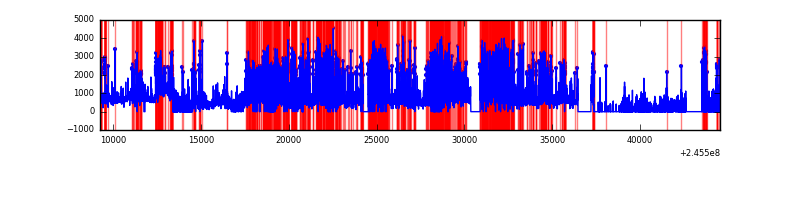 |
| B | 35309 | 28925 | 785 | 785 | 2.22% | 2.71% | 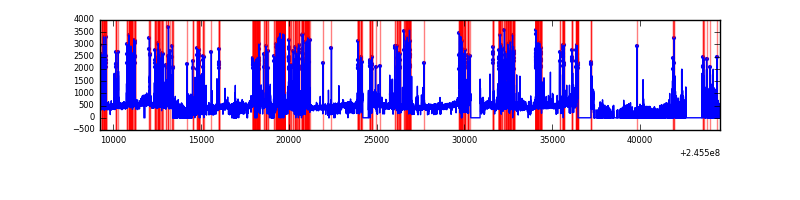 |
| C | 35312 | 29191 | 0 | 0 | 0.00% | 0.00% | 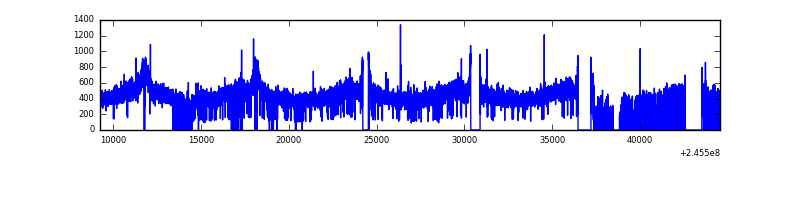 |
| D | 35313 | 28534 | 880 | 880 | 2.49% | 3.08% | 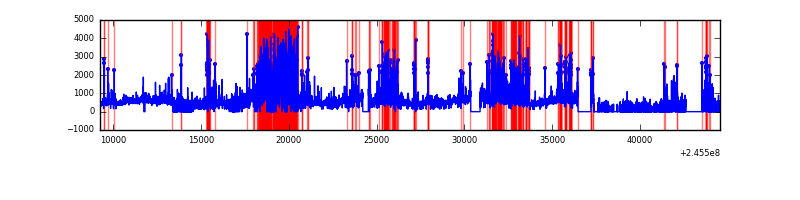 |
Top three noisy pixels from each quadrant. If the there are fewer than three noisy pixels in the level2.evt file, extra rows are filled as -1
| Pixel properties | Quadrant properties | ||||||
|---|---|---|---|---|---|---|---|
| Quadrant | DetID | PixID | Counts | Sigma | Mean | Median | Sigma |
| A | 14 | 238 | 10034304 | 16478.15 | 2994 | 2931 | 608.8 |
| A | 15 | 174 | 2027067 | 3324.97 | 2994 | 2931 | 608.8 |
| A | 8 | 5 | 1718753 | 2818.51 | 2994 | 2931 | 608.8 |
| B | 4 | 239 | 4467372 | 7412.97 | 3179 | 3095 | 602.2 |
| B | 0 | 214 | 94007 | 150.96 | 3179 | 3095 | 602.2 |
| B | 0 | 187 | 73840 | 117.47 | 3179 | 3095 | 602.2 |
| C | 8 | 128 | 23704 | 28.01 | 3170 | 3180 | 732.8 |
| C | 13 | 61 | 23592 | 27.85 | 3170 | 3180 | 732.8 |
| C | 8 | 112 | 14161 | 14.98 | 3170 | 3180 | 732.8 |
| D | 1 | 52 | 3575122 | 4924.74 | 3030 | 2944 | 725.4 |
| D | 11 | 129 | 1713254 | 2357.9 | 3030 | 2944 | 725.4 |
| D | 14 | 34 | 711249 | 976.5 | 3030 | 2944 | 725.4 |
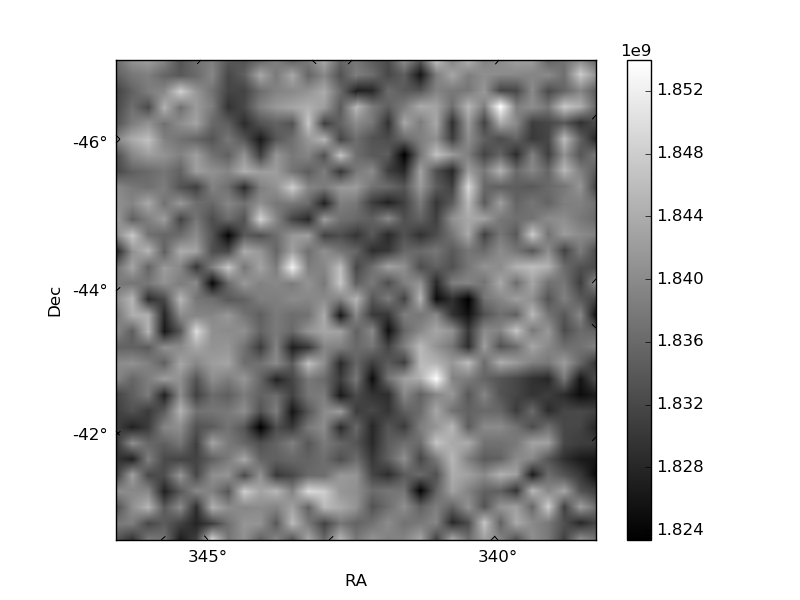
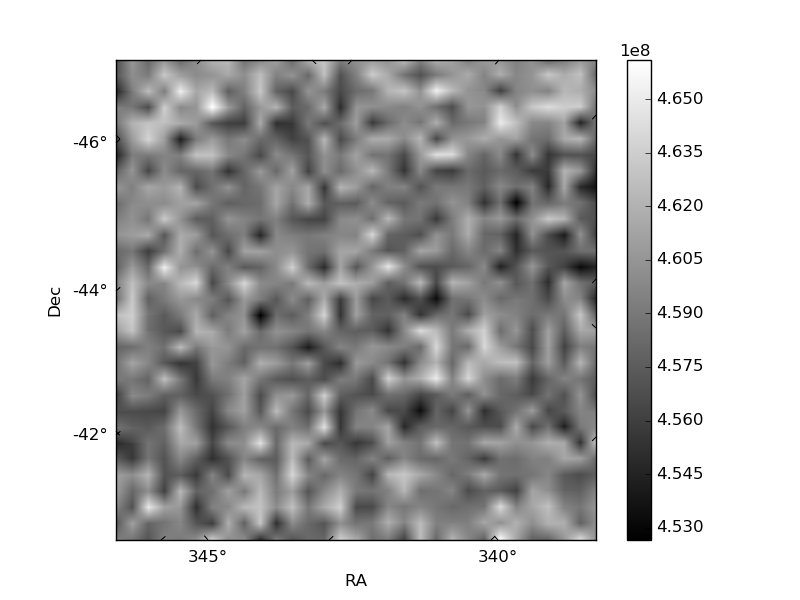
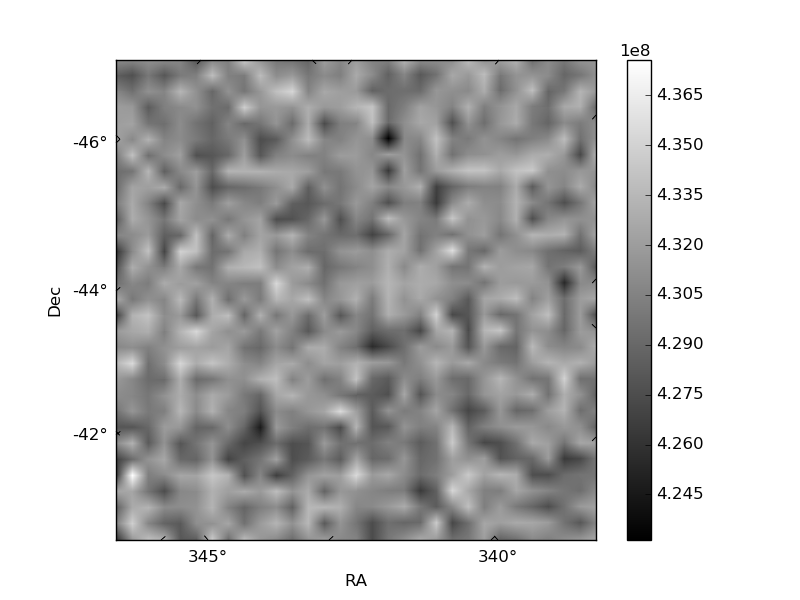
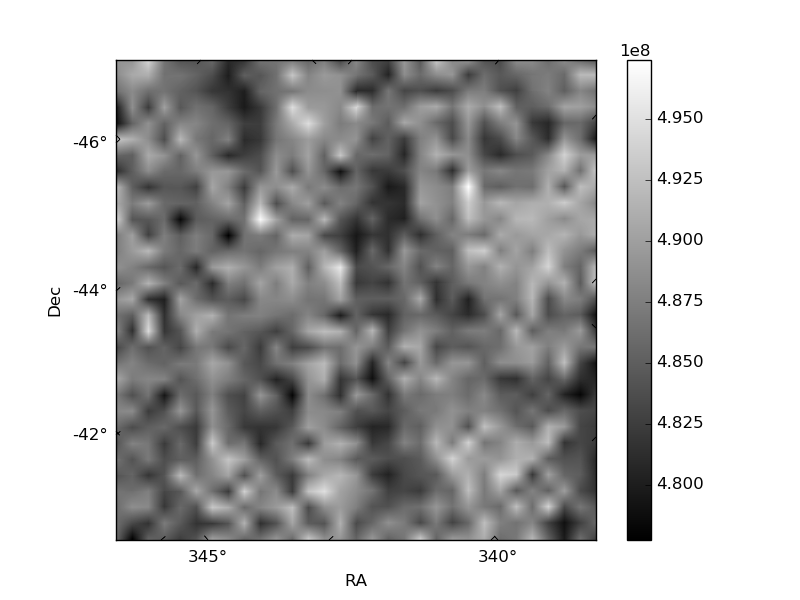
Histogram calculated using DETX and DETY for each event in the final _common_clean file
| Quadrant A | 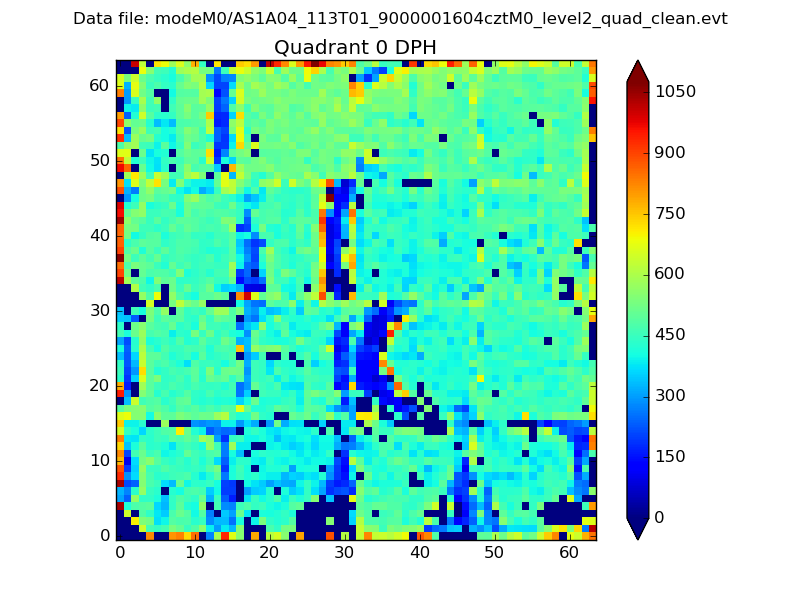 |
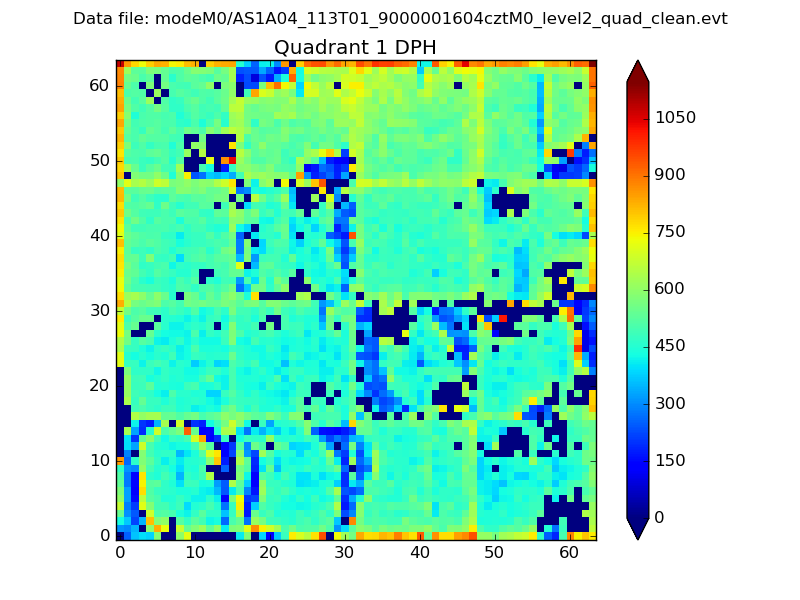 |
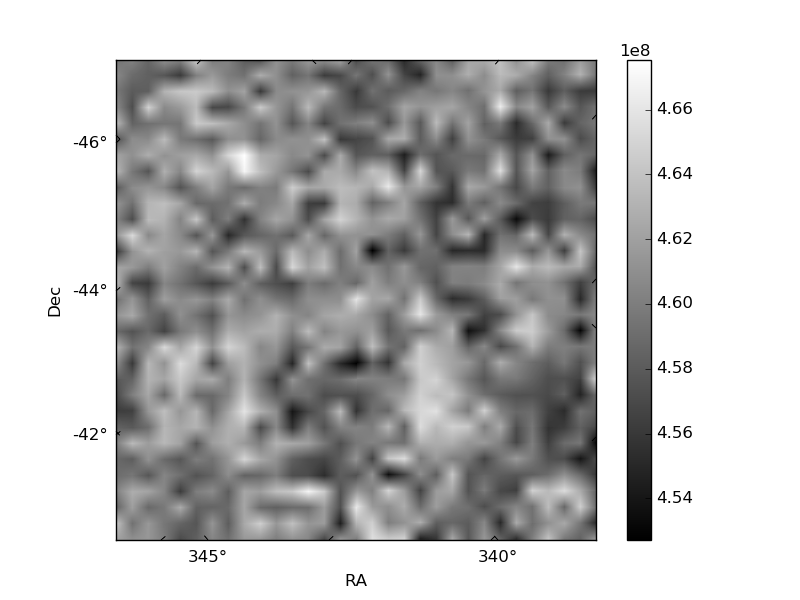
Quadrant B |
|---|---|---|---|
| Quadrant D | 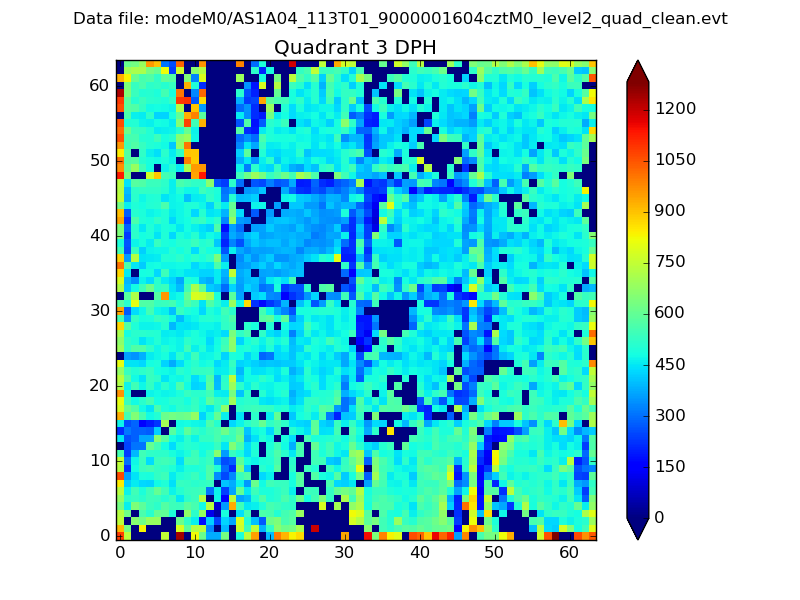 |
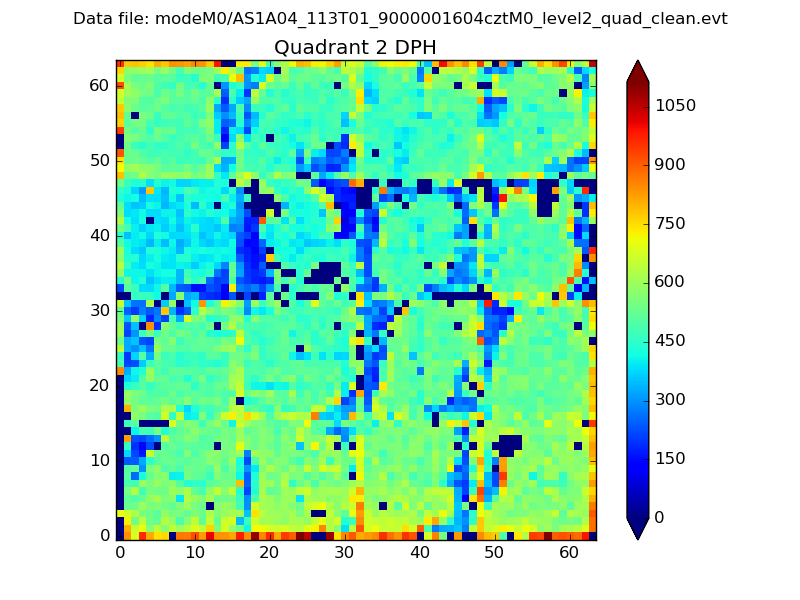 |
Quadrant C |
| Plot type | Count rate plots | Images |
|---|---|---|
| Comparison with Poisson distribution Blue bars denote a histogram of data divided into 1 sec bins. Red curve is a Poisson curve with rate = median count rate of data. |
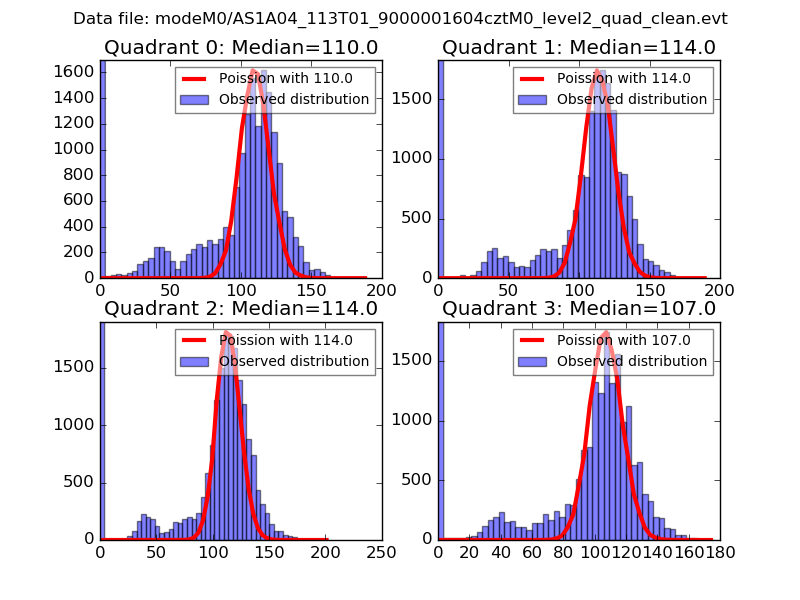 |
 |
| Quadrant-wise count rates Data is divided into 100 sec bins |
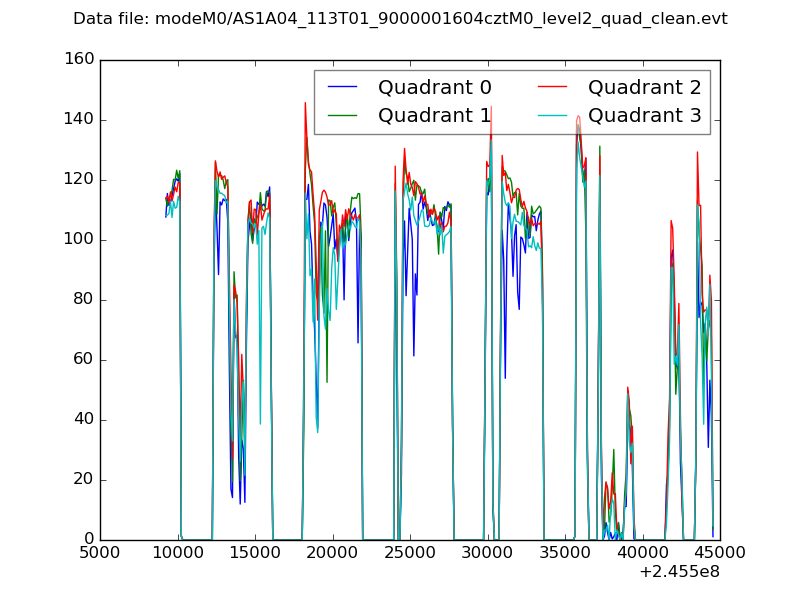 |
|
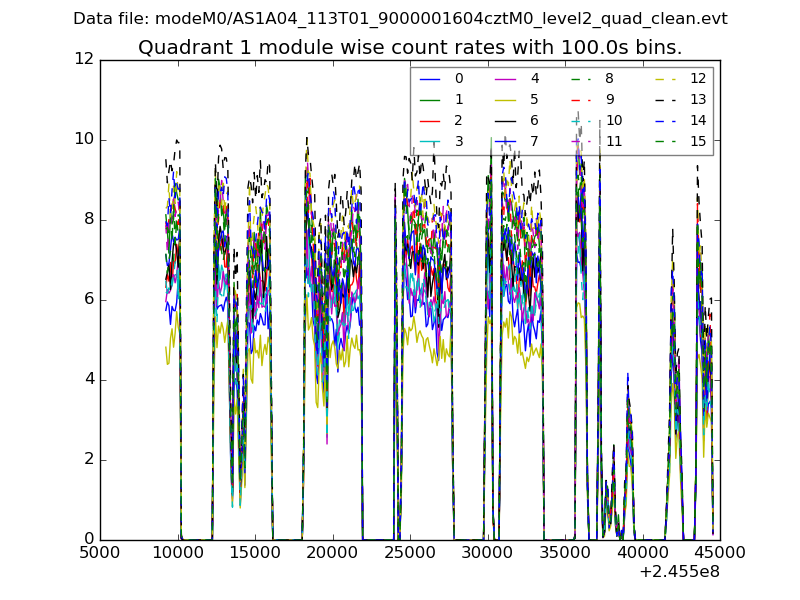
| Module-wise count rates for Quadrant A Data is divided into 100 sec bins |
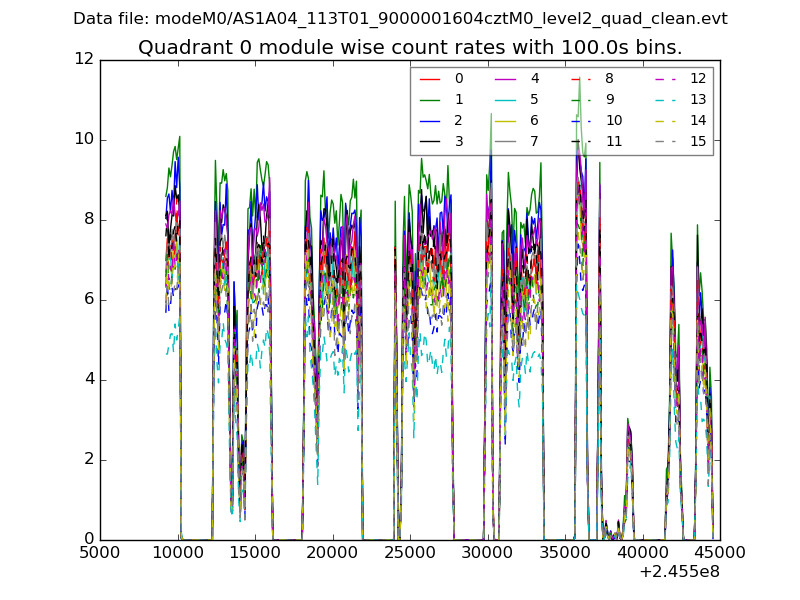 |
 |
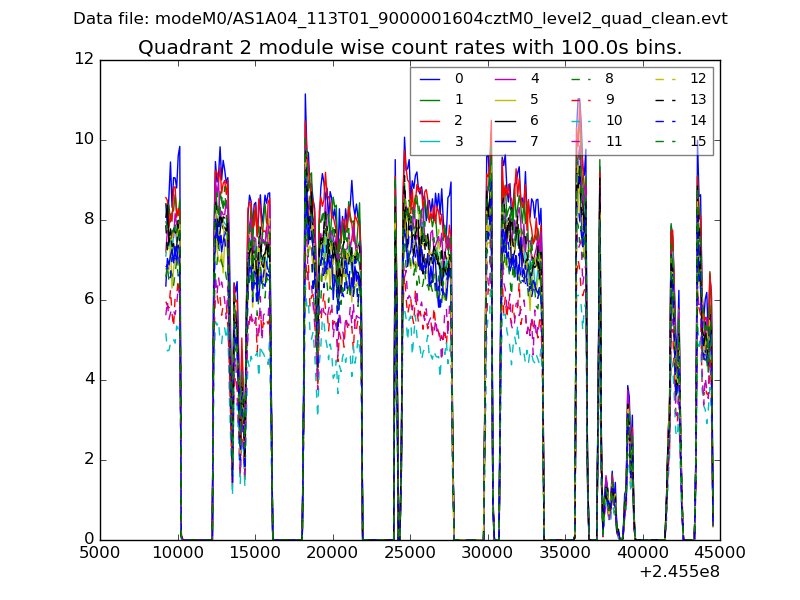
| Module-wise count rates for Quadrant B Data is divided into 100 sec bins |
 |
 |
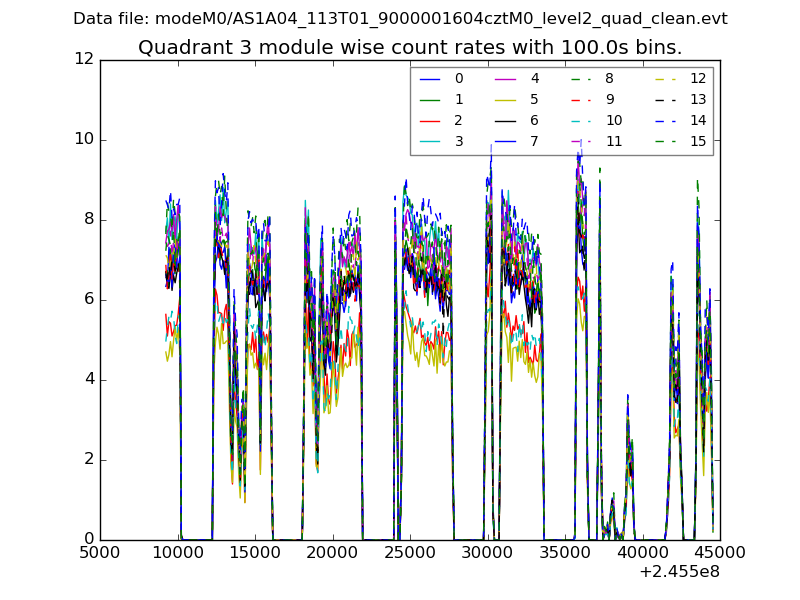
| Module-wise count rates for Quadrant C Data is divided into 100 sec bins |
 |
 |
| Module-wise count rates for Quadrant D Data is divided into 100 sec bins |
 |
 |
| Parameter | Plot |
|---|---|
| CZT HV Monitor | 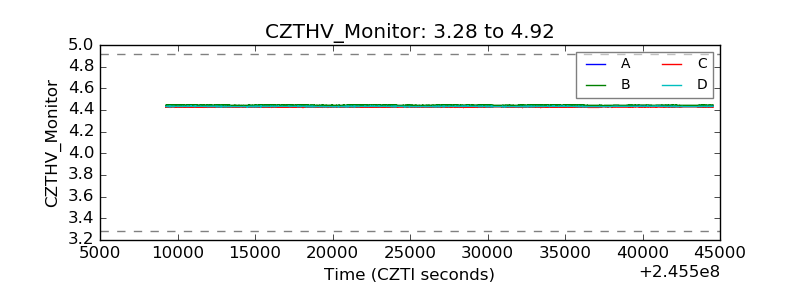 |
| D_VDD | 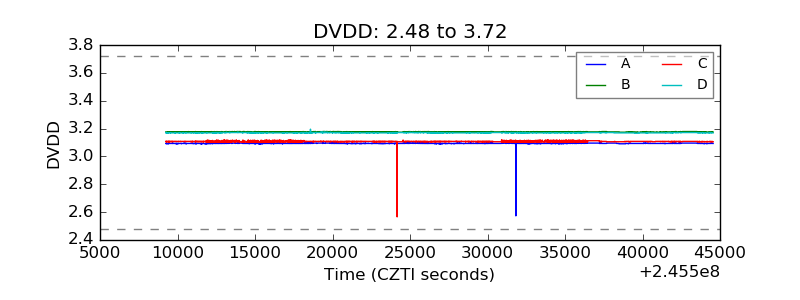 |
| Temperature 1 | 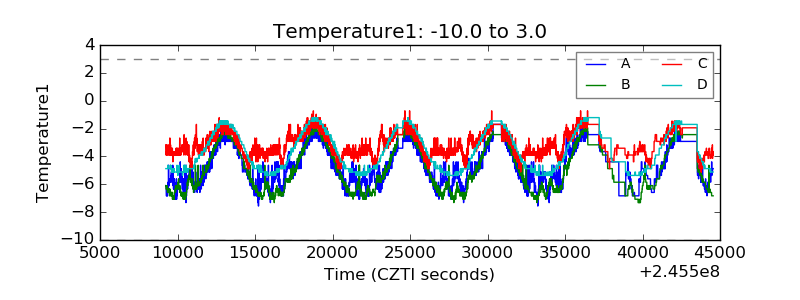 |
| Veto HV Monitor | 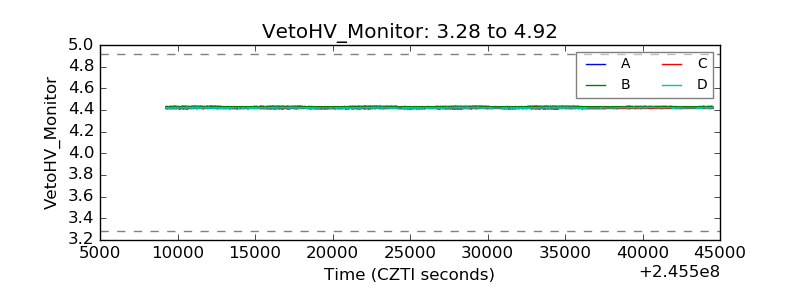 |
| Veto LLD | 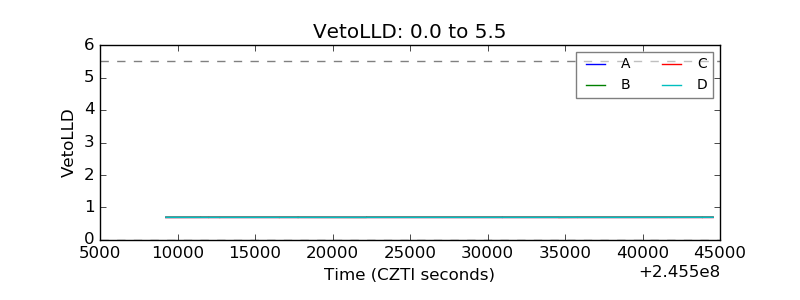 |
| Alpha Counter | 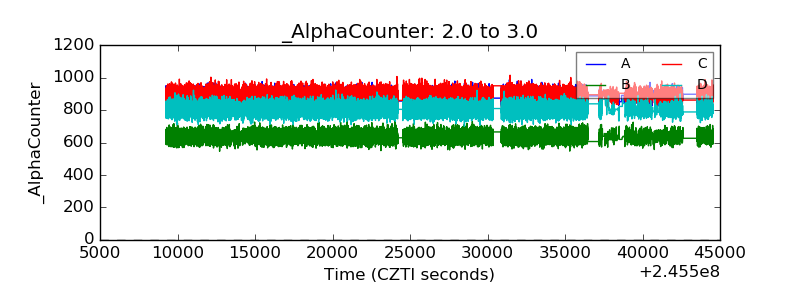 |
| _CPM_Rate | 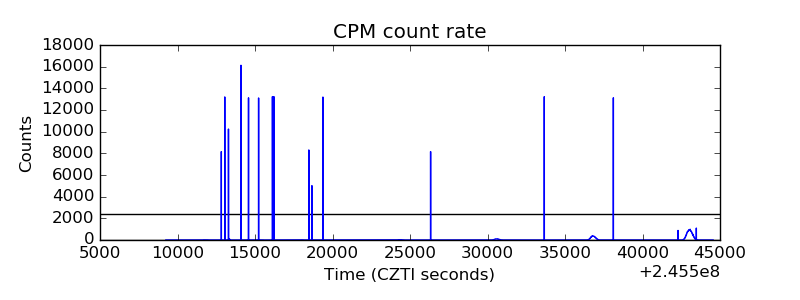 |
| CZT Counter | 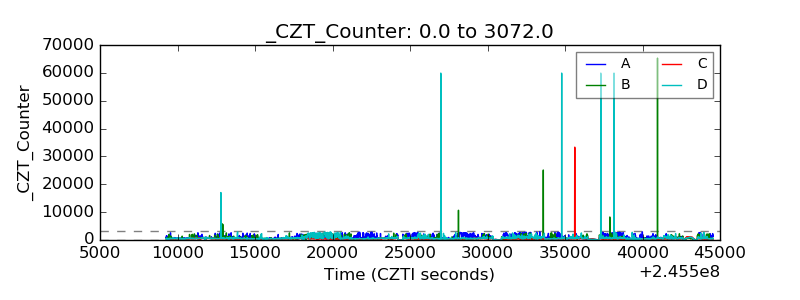 |
| +2.5 Volts monitor |  |
| +5 Volts monitor | 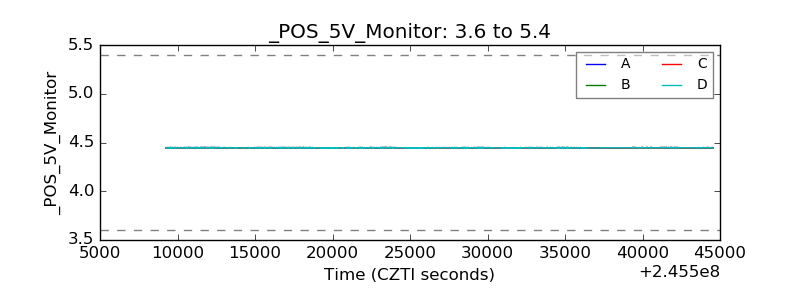 |
| _ROLL_ROT | 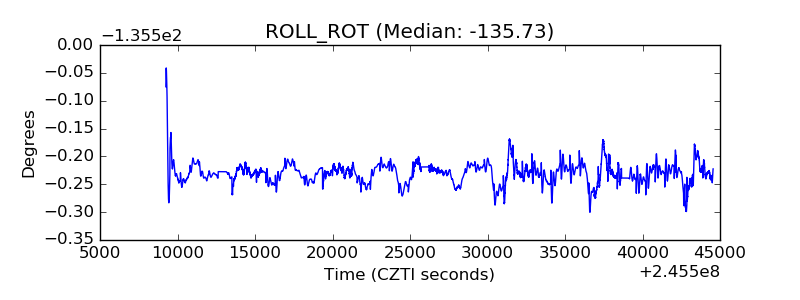 |
| _Roll_DEC | 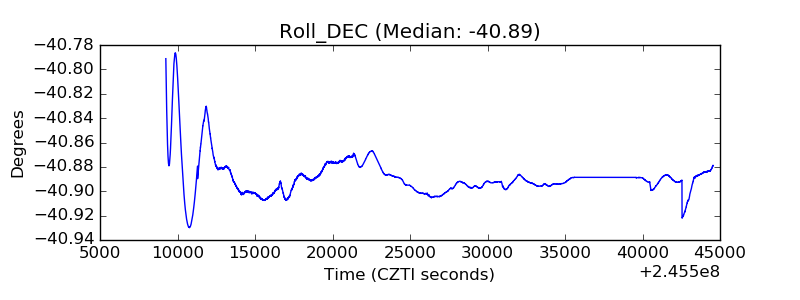 |
| _Roll_RA | 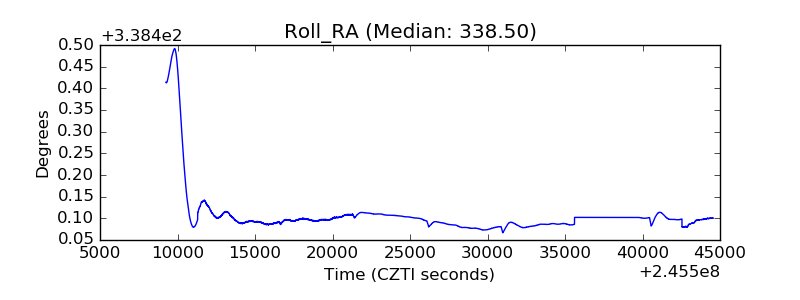 |
| Veto Counter | 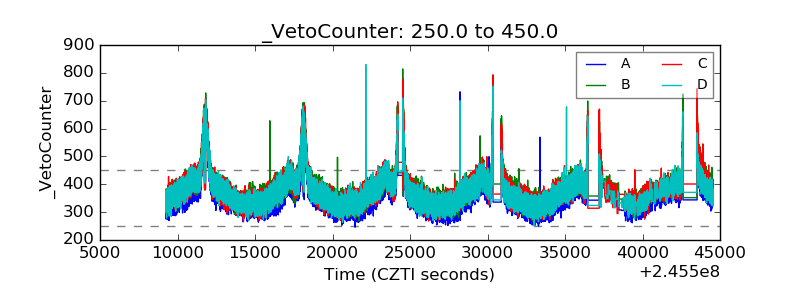 |