| Param | Original file | Final file |
|---|---|---|
| Filename | modeM0/AS1C03_014T01_9000001804cztM0_level2_bc.evt | modeM0/AS1C03_014T01_9000001804cztM0_level2_quad_clean.evt |
| Size (bytes) | 1,910,024,640 | 756,691,200 |
| Size | 1.8 GB | 721.6 MB |
| Events in quadrant A | 14,559,281 | 5,120,735 |
| Events in quadrant B | 18,762,274 | 4,810,979 |
| Events in quadrant C | 9,661,185 | 5,115,355 |
| Events in quadrant D | 11,951,000 | 4,940,518 |
| Mode M9 | |||
|---|---|---|---|
| Quadrant | BADHDUFLAG | Total packets | Discarded packets |
| A | 0 | 40 | 0 |
| B | 0 | 40 | 0 |
| C | 0 | 40 | 0 |
| D | 0 | 40 | 0 |
| Mode SS | |||
|---|---|---|---|
| Quadrant | BADHDUFLAG | Total packets | Discarded packets |
| A | 0 | 866 | 0 |
| B | 0 | 866 | 0 |
| C | 0 | 866 | 0 |
| D | 0 | 866 | 0 |
| Mode M0 | |||
|---|---|---|---|
| Quadrant | BADHDUFLAG | Total packets | Discarded packets |
| A | 0 | 111965 | 0 |
| B | 0 | 136126 | 0 |
| C | 0 | 91852 | 0 |
| D | 0 | 99426 | 0 |
| Quadrant | Total seconds | Saturated seconds | Saturation percentage |
|---|---|---|---|
| A | 42703 | 1692 | 3.962251% |
| B | 42703 | 5964 | 13.966232% |
| C | 42703 | 491 | 1.149802% |
| D | 42703 | 739 | 1.730558% |
Noise dominated data is calculated using 1-second bins in cleaned event files. If a bin has >2000 counts, and if more than 50% of those come from <1% of pixels, then it is considered to be noise-dominated and hence unusable.
| Quadrant | # 1 sec bins | Bins with >0 counts | Bins with >2000 counts | High rate bins dominated by noise | Noise dominated (total time) | Noise dominated (detector-on time) | Marked lightcurve |
|---|---|---|---|---|---|---|---|
| A | 46625 | 42702 | 221 | 221 | 0.47% | 0.52% | 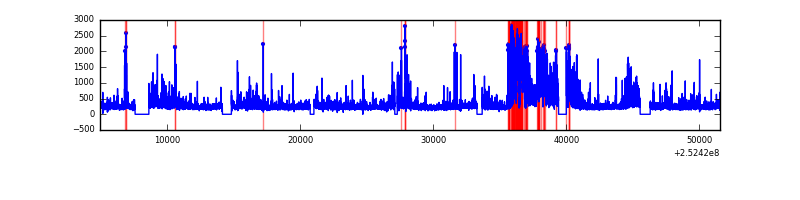 |
| B | 46625 | 42631 | 194 | 194 | 0.42% | 0.46% | 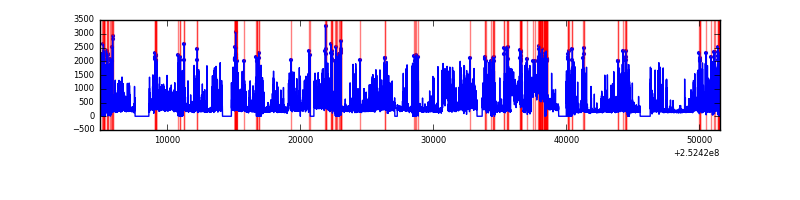 |
| C | 46625 | 42703 | 128 | 128 | 0.27% | 0.30% | 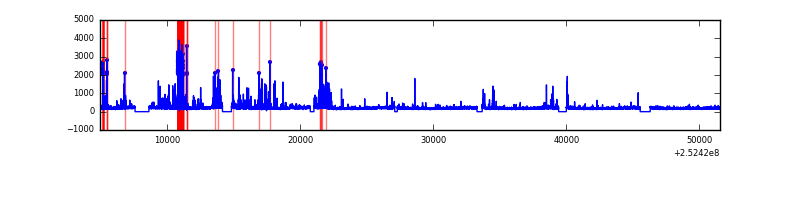 |
| D | 46625 | 42703 | 93 | 93 | 0.20% | 0.22% | 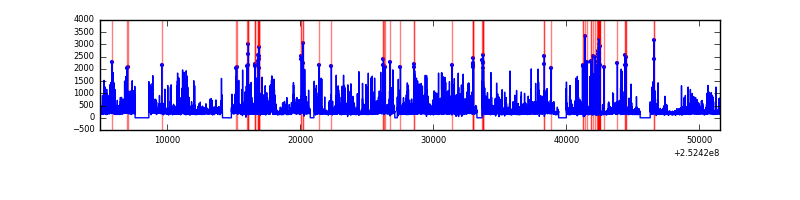 |
Top three noisy pixels from each quadrant. If the there are fewer than three noisy pixels in the level2.evt file, extra rows are filled as -1
| Pixel properties | Quadrant properties | ||||||
|---|---|---|---|---|---|---|---|
| Quadrant | DetID | PixID | Counts | Sigma | Mean | Median | Sigma |
| A | 8 | 15 | 2205354 | 4845.15 | 2070 | 2034 | 454.7 |
| A | 15 | 249 | 2030547 | 4460.75 | 2070 | 2034 | 454.7 |
| A | 13 | 251 | 1004917 | 2205.36 | 2070 | 2034 | 454.7 |
| B | 4 | 239 | 4771933 | 12626.28 | 1950 | 1902 | 377.8 |
| B | 4 | 206 | 2563544 | 6780.67 | 1950 | 1902 | 377.8 |
| B | 3 | 64 | 1234888 | 3263.72 | 1950 | 1902 | 377.8 |
| C | 15 | 208 | 1494658 | 3289.73 | 2028 | 2006 | 453.7 |
| C | 4 | 175 | 95709 | 206.52 | 2028 | 2006 | 453.7 |
| C | 0 | 207 | 26821 | 54.69 | 2028 | 2006 | 453.7 |
| D | 1 | 52 | 1319282 | 2706.1 | 2048 | 1973 | 486.8 |
| D | 14 | 34 | 483733 | 989.66 | 2048 | 1973 | 486.8 |
| D | 13 | 104 | 358385 | 732.17 | 2048 | 1973 | 486.8 |
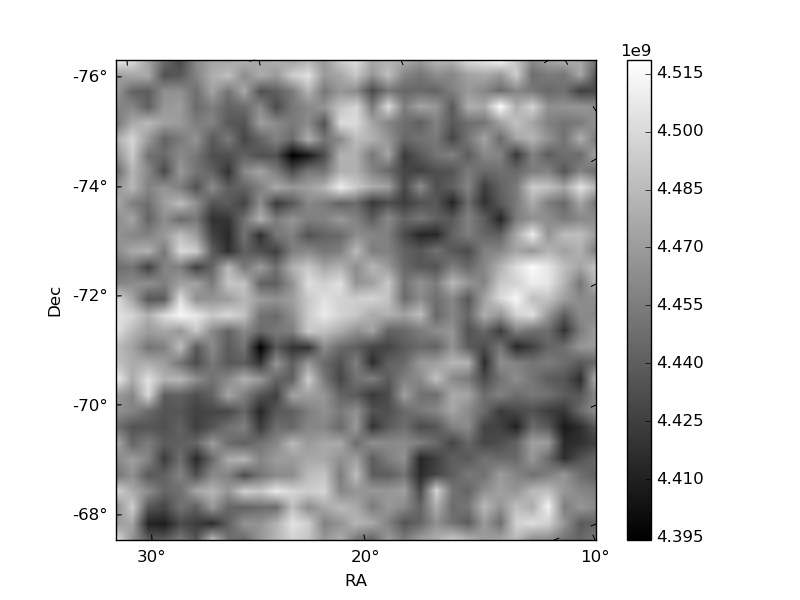
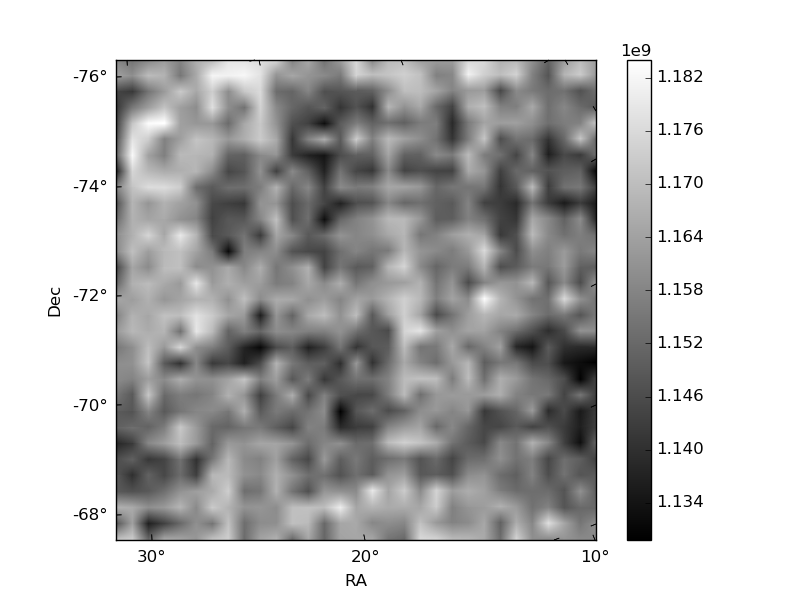
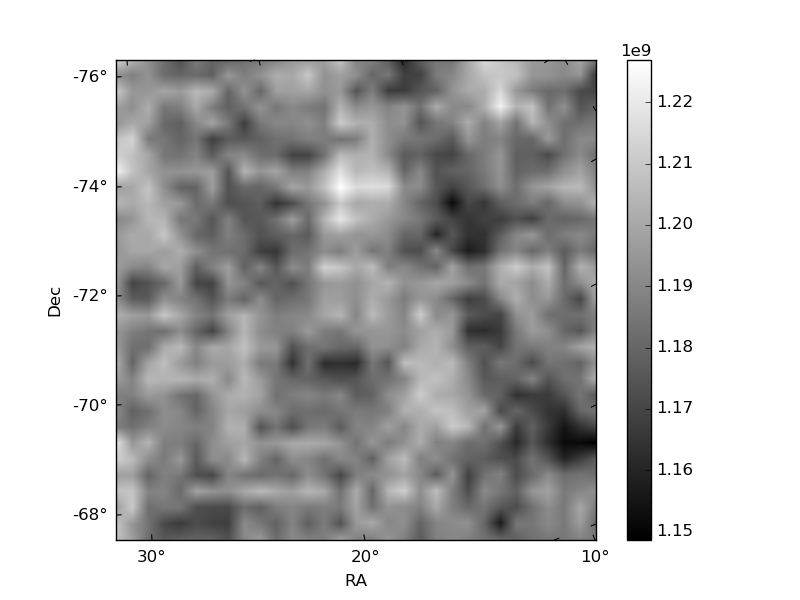
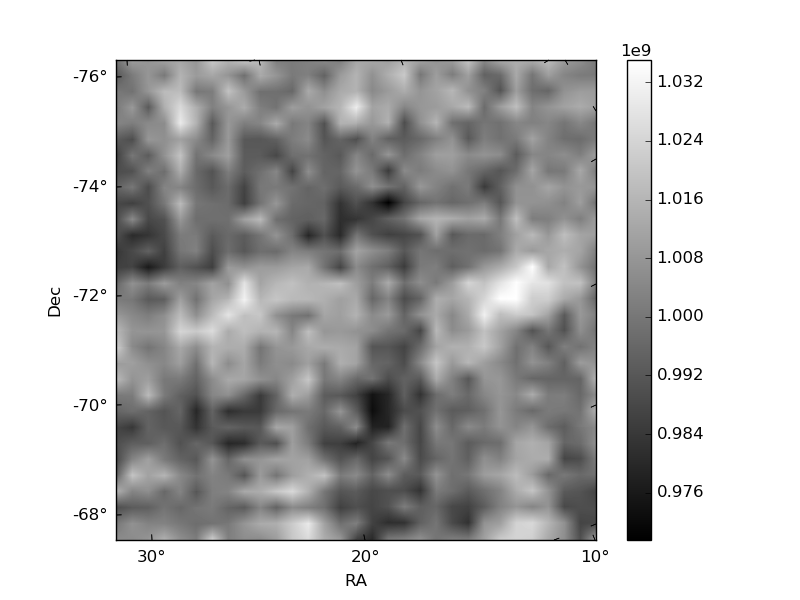
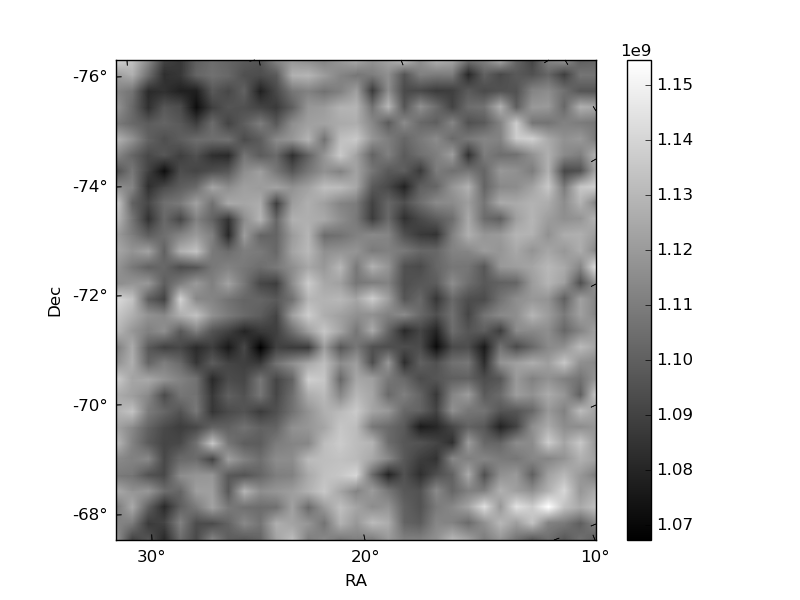
Histogram calculated using DETX and DETY for each event in the final _common_clean file
| Quadrant A | 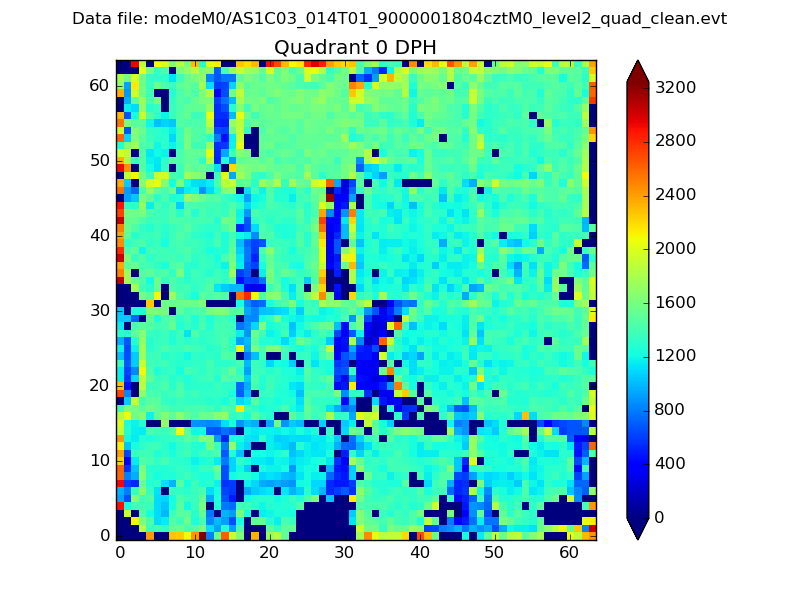 |
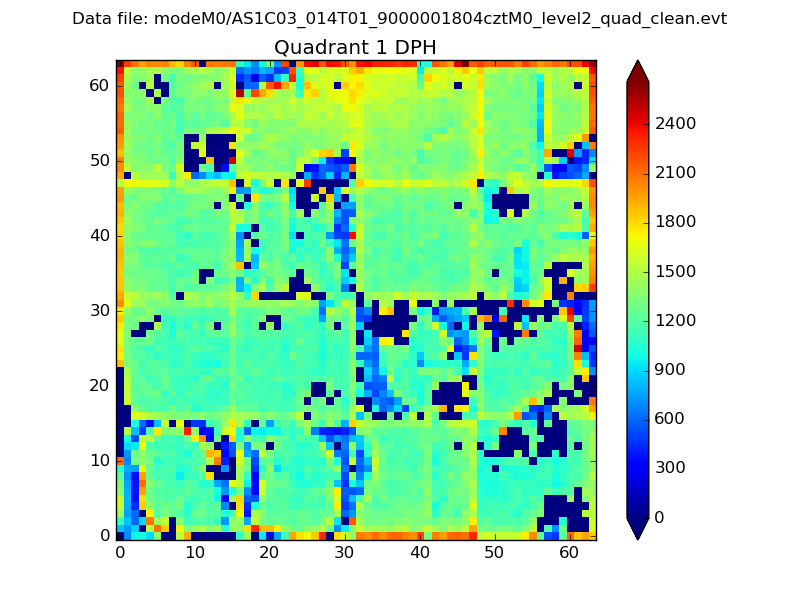 |
Quadrant B |
|---|---|---|---|
| Quadrant D | 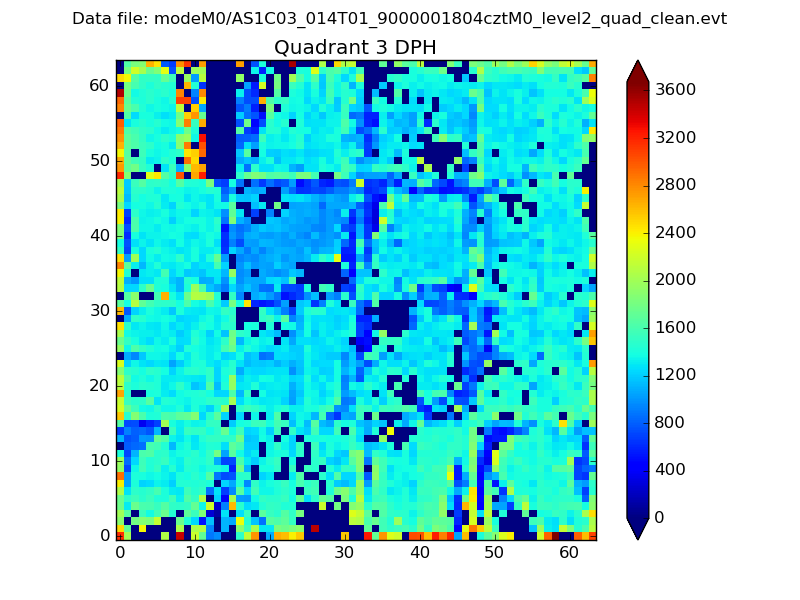 |
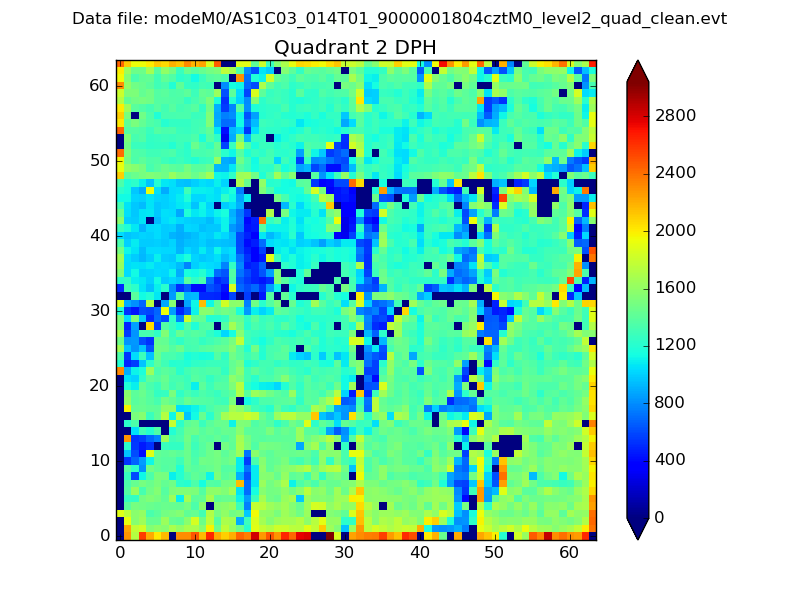 |
Quadrant C |
| Plot type | Count rate plots | Images |
|---|---|---|
| Comparison with Poisson distribution Blue bars denote a histogram of data divided into 1 sec bins. Red curve is a Poisson curve with rate = median count rate of data. |
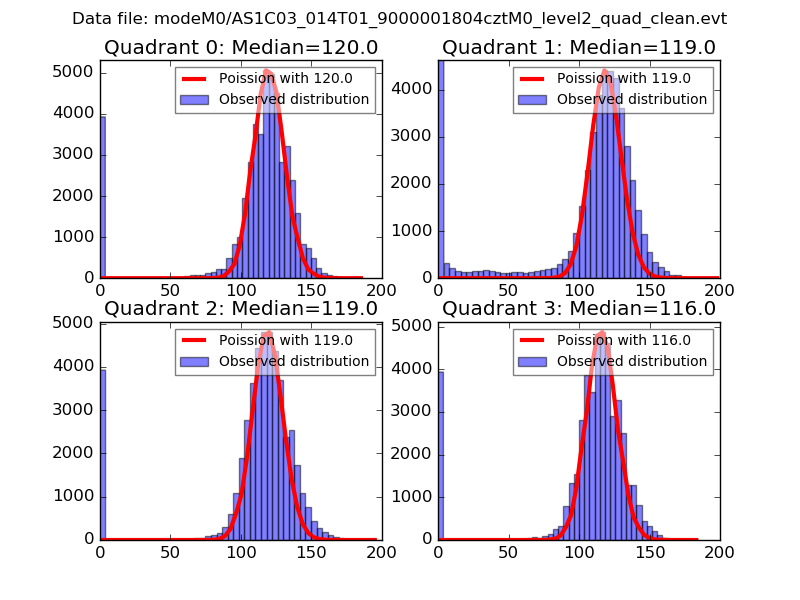 |
 |
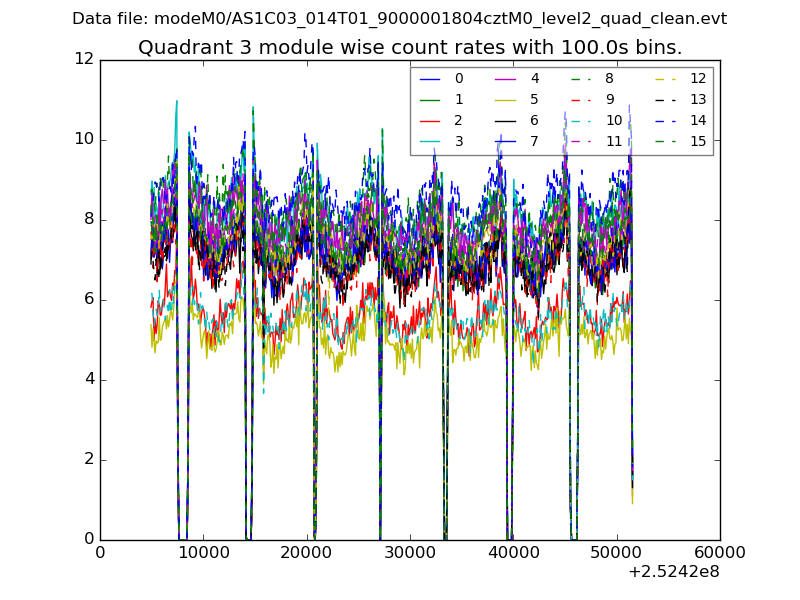
| Quadrant-wise count rates Data is divided into 100 sec bins |
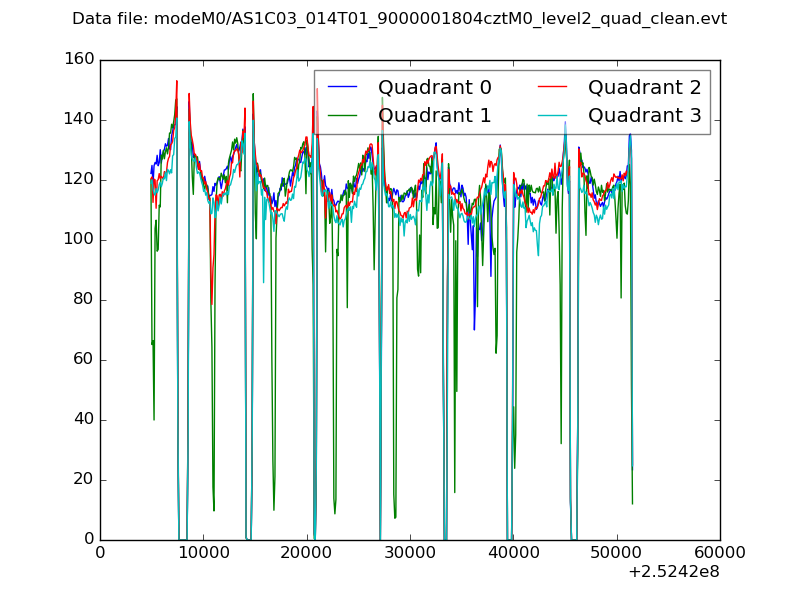 |
|
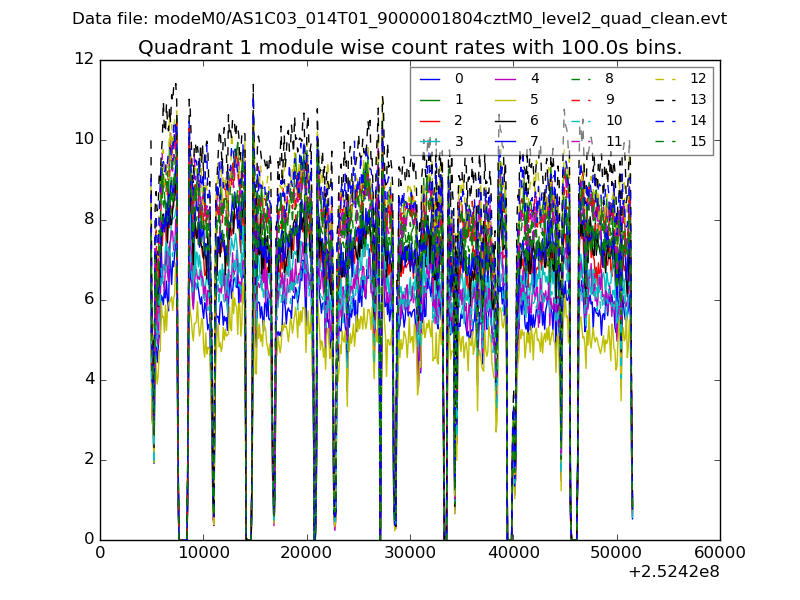
| Module-wise count rates for Quadrant A Data is divided into 100 sec bins |
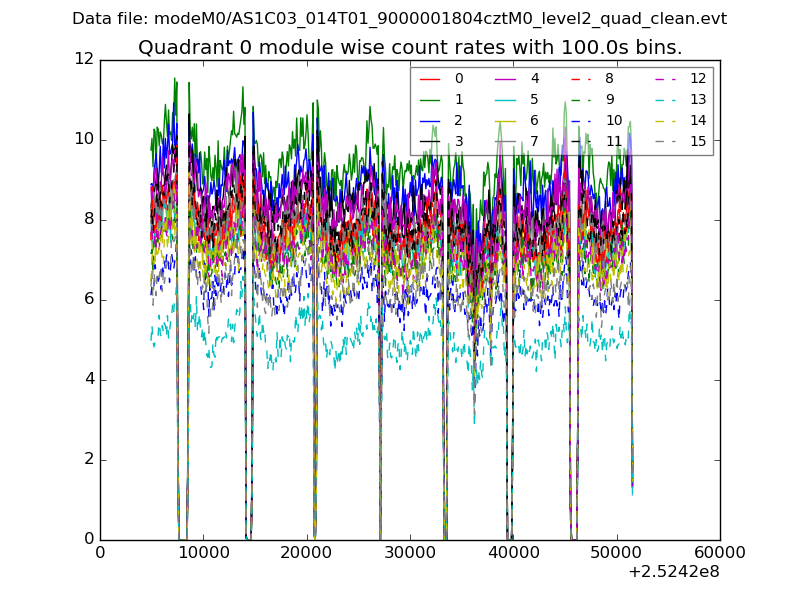 |
 |
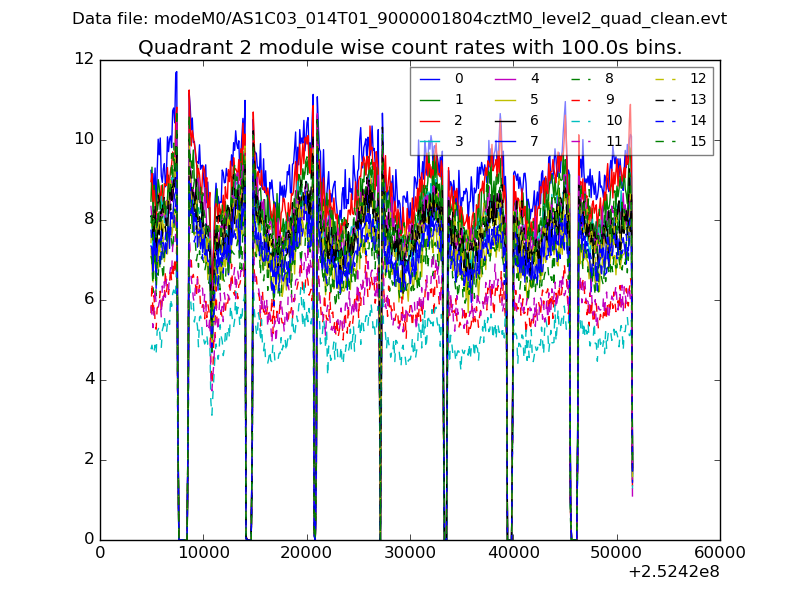
| Module-wise count rates for Quadrant B Data is divided into 100 sec bins |
 |
 |
| Module-wise count rates for Quadrant C Data is divided into 100 sec bins |
 |
 |
| Module-wise count rates for Quadrant D Data is divided into 100 sec bins |
 |
 |
| Parameter | Plot |
|---|---|
| CZT HV Monitor | 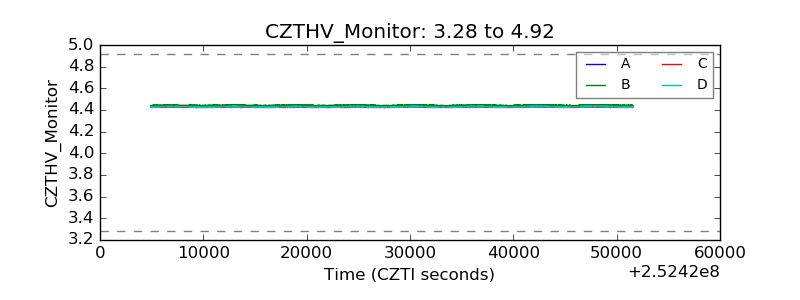 |
| D_VDD | 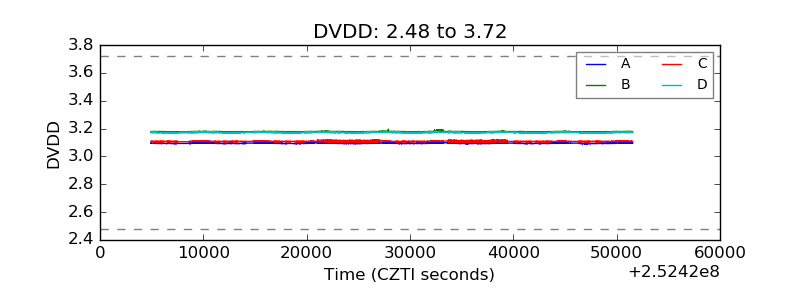 |
| Temperature 1 | 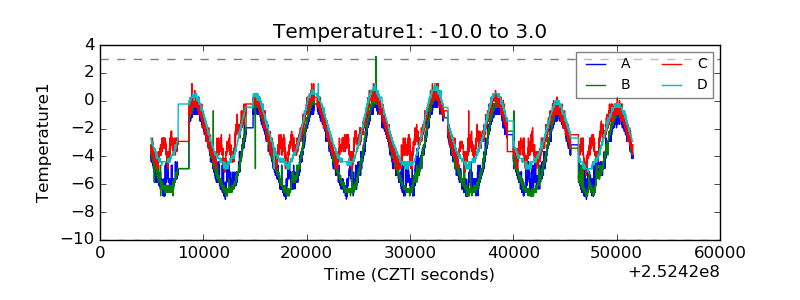 |
| Veto HV Monitor | 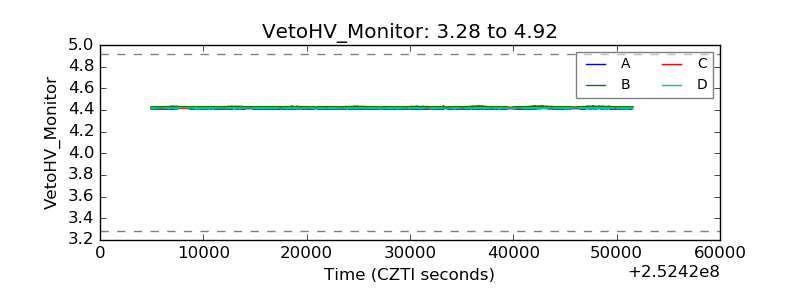 |
| Veto LLD | 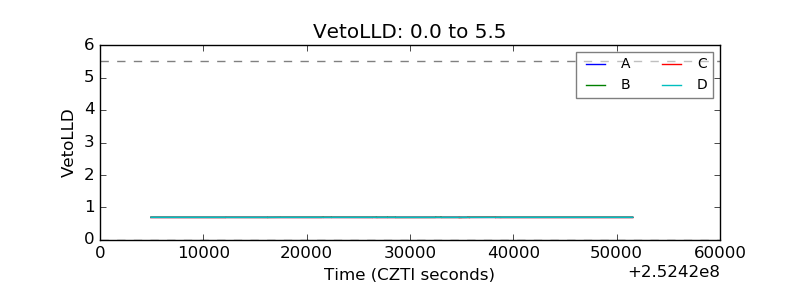 |
| Alpha Counter | 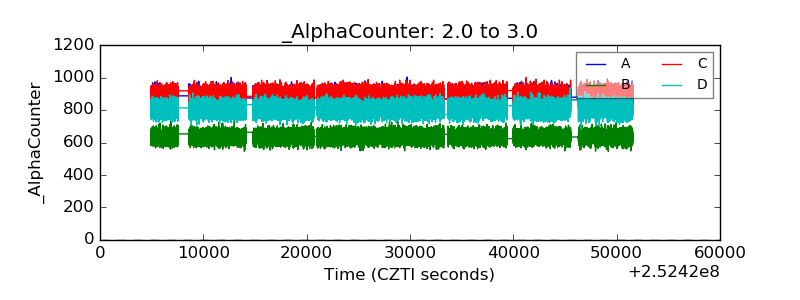 |
| _CPM_Rate | 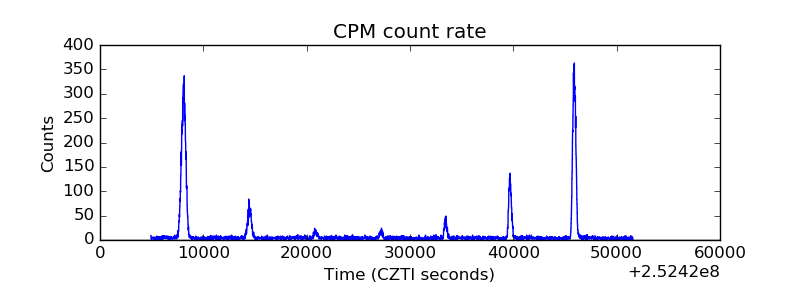 |
| CZT Counter | 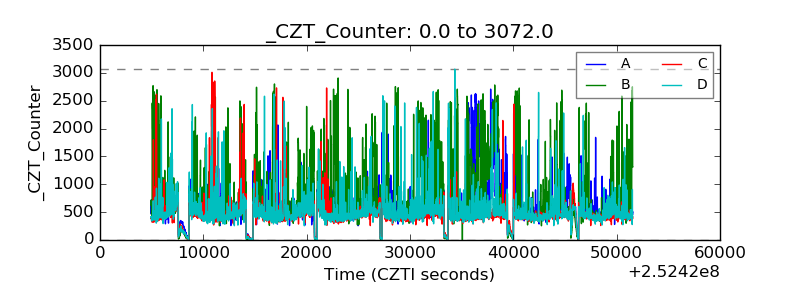 |
| +2.5 Volts monitor | 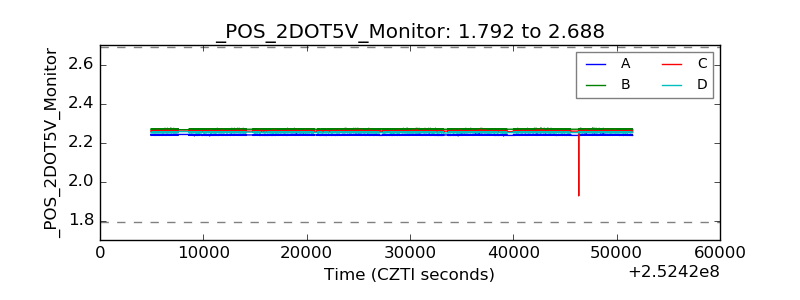 |
| +5 Volts monitor | 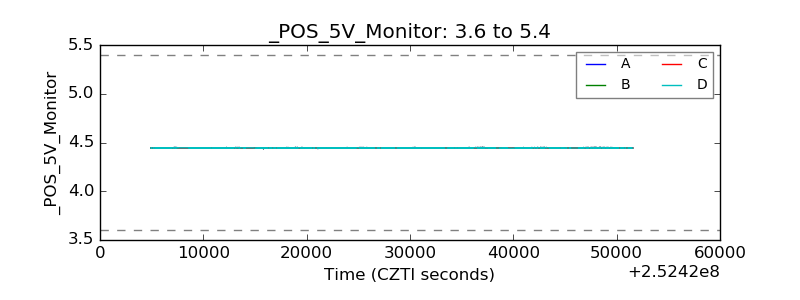 |
| _ROLL_ROT | 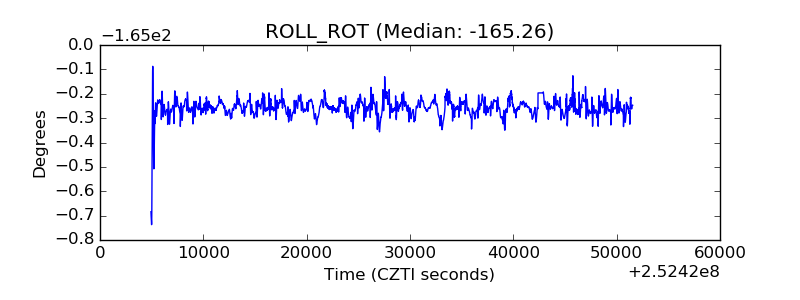 |
| _Roll_DEC | 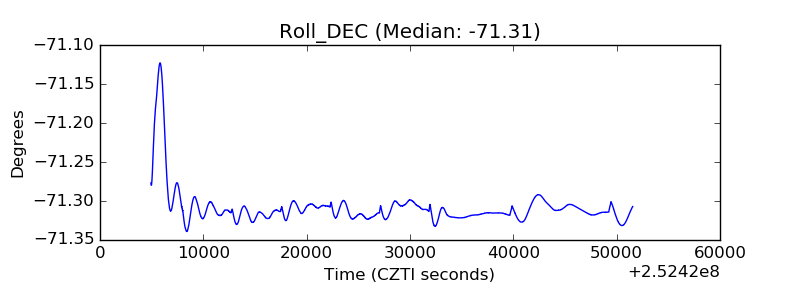 |
| _Roll_RA | 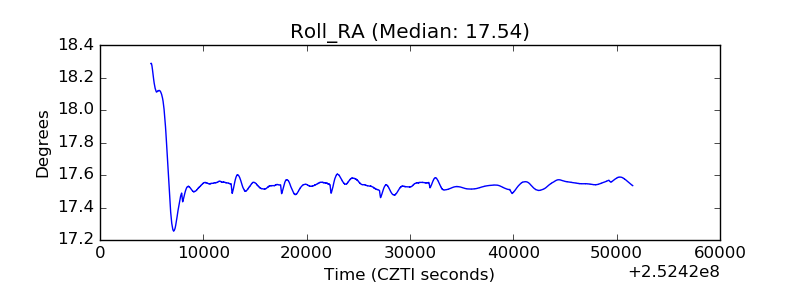 |
| Veto Counter | 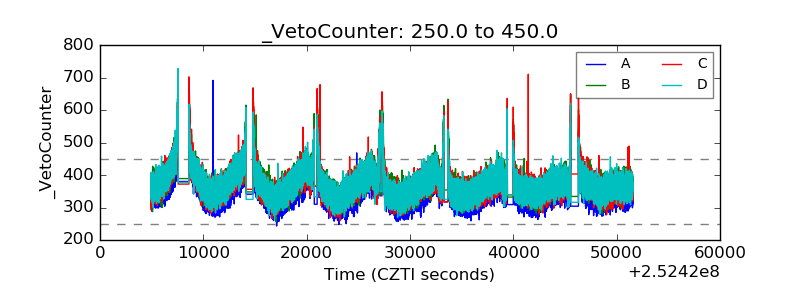 |