| Param | Original file | Final file |
|---|---|---|
| Filename | modeM0/AS1C03_014T02_9000001806cztM0_level2_bc.evt | modeM0/AS1C03_014T02_9000001806cztM0_level2_quad_clean.evt |
| Size (bytes) | 1,760,454,720 | 745,044,480 |
| Size | 1.6 GB | 710.5 MB |
| Events in quadrant A | 15,436,357 | 5,071,028 |
| Events in quadrant B | 14,598,147 | 4,890,498 |
| Events in quadrant C | 8,779,301 | 5,103,713 |
| Events in quadrant D | 11,892,458 | 4,873,427 |
| Mode M9 | |||
|---|---|---|---|
| Quadrant | BADHDUFLAG | Total packets | Discarded packets |
| A | 0 | 88 | 0 |
| B | 0 | 88 | 0 |
| C | 0 | 88 | 0 |
| D | 0 | 88 | 0 |
| Mode M0 | |||
|---|---|---|---|
| Quadrant | BADHDUFLAG | Total packets | Discarded packets |
| A | 0 | 112179 | 0 |
| B | 0 | 111950 | 0 |
| C | 0 | 81482 | 0 |
| D | 0 | 92286 | 0 |
| Mode SS | |||
|---|---|---|---|
| Quadrant | BADHDUFLAG | Total packets | Discarded packets |
| A | 0 | 780 | 0 |
| B | 0 | 780 | 0 |
| C | 0 | 780 | 0 |
| D | 0 | 780 | 0 |
| Quadrant | Total seconds | Saturated seconds | Saturation percentage |
|---|---|---|---|
| A | 38275 | 1484 | 3.877204% |
| B | 38275 | 4041 | 10.557805% |
| C | 38275 | 427 | 1.115611% |
| D | 38275 | 1222 | 3.192685% |
Noise dominated data is calculated using 1-second bins in cleaned event files. If a bin has >2000 counts, and if more than 50% of those come from <1% of pixels, then it is considered to be noise-dominated and hence unusable.
| Quadrant | # 1 sec bins | Bins with >0 counts | Bins with >2000 counts | High rate bins dominated by noise | Noise dominated (total time) | Noise dominated (detector-on time) | Marked lightcurve |
|---|---|---|---|---|---|---|---|
| A | 46360 | 38274 | 13 | 13 | 0.03% | 0.03% | 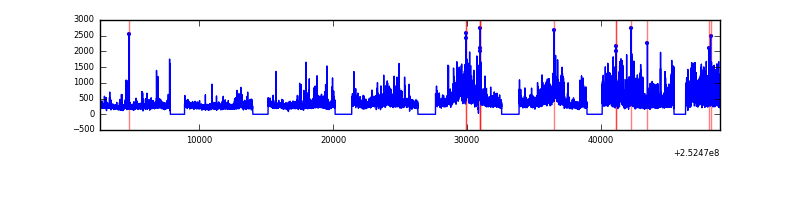 |
| B | 46361 | 38253 | 226 | 226 | 0.49% | 0.59% | 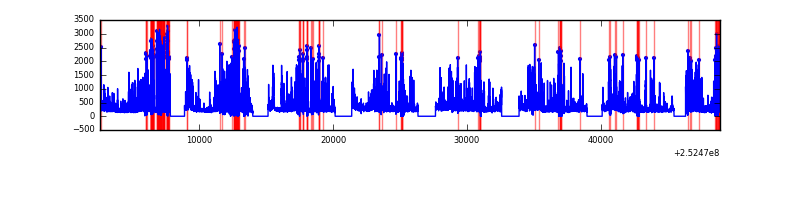 |
| C | 46360 | 38275 | 22 | 22 | 0.05% | 0.06% | 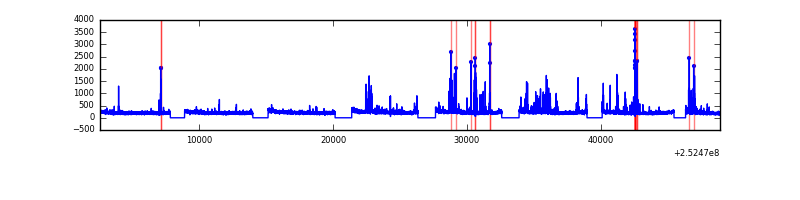 |
| D | 46360 | 38273 | 199 | 199 | 0.43% | 0.52% | 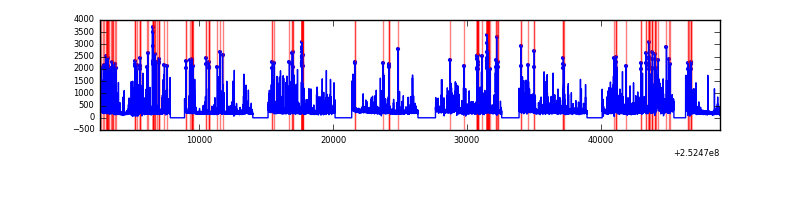 |
Top three noisy pixels from each quadrant. If the there are fewer than three noisy pixels in the level2.evt file, extra rows are filled as -1
| Pixel properties | Quadrant properties | ||||||
|---|---|---|---|---|---|---|---|
| Quadrant | DetID | PixID | Counts | Sigma | Mean | Median | Sigma |
| A | 13 | 251 | 4899662 | 10950.47 | 2056 | 2032 | 447.3 |
| A | 8 | 15 | 1511649 | 3375.31 | 2056 | 2032 | 447.3 |
| A | 1 | 162 | 530241 | 1181.01 | 2056 | 2032 | 447.3 |
| B | 4 | 239 | 4733595 | 12738.99 | 1974 | 1934 | 371.4 |
| B | 11 | 51 | 562087 | 1508.09 | 1974 | 1934 | 371.4 |
| B | 3 | 64 | 340853 | 912.47 | 1974 | 1934 | 371.4 |
| C | 15 | 208 | 582739 | 1303.69 | 2019 | 2004 | 445.5 |
| C | 4 | 175 | 117851 | 260.06 | 2019 | 2004 | 445.5 |
| C | 5 | 112 | 101334 | 222.98 | 2019 | 2004 | 445.5 |
| D | 1 | 52 | 1992512 | 4215.64 | 2028 | 1963 | 472.2 |
| D | 13 | 104 | 466084 | 982.93 | 2028 | 1963 | 472.2 |
| D | 12 | 221 | 269474 | 566.54 | 2028 | 1963 | 472.2 |
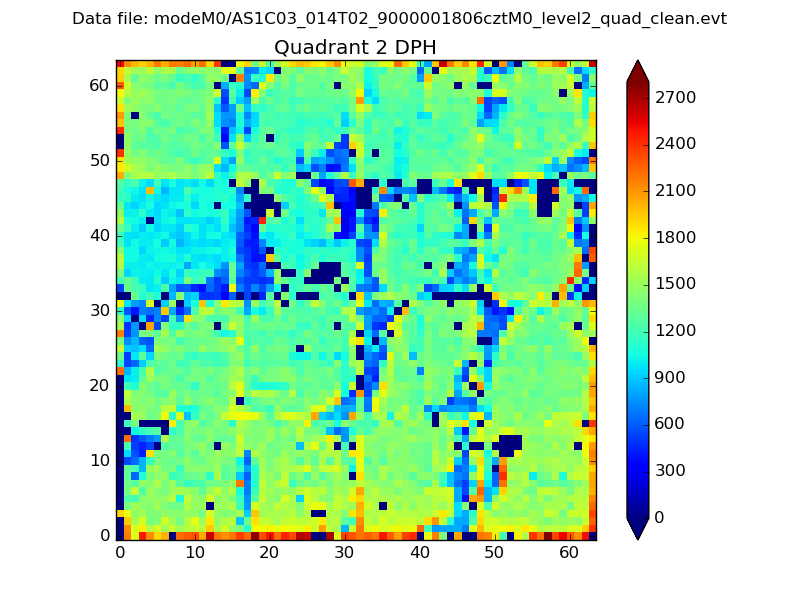
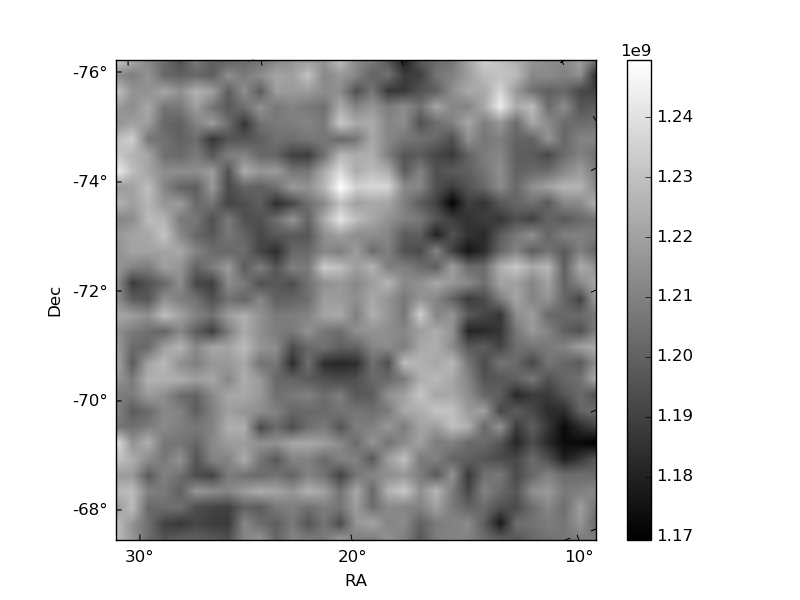
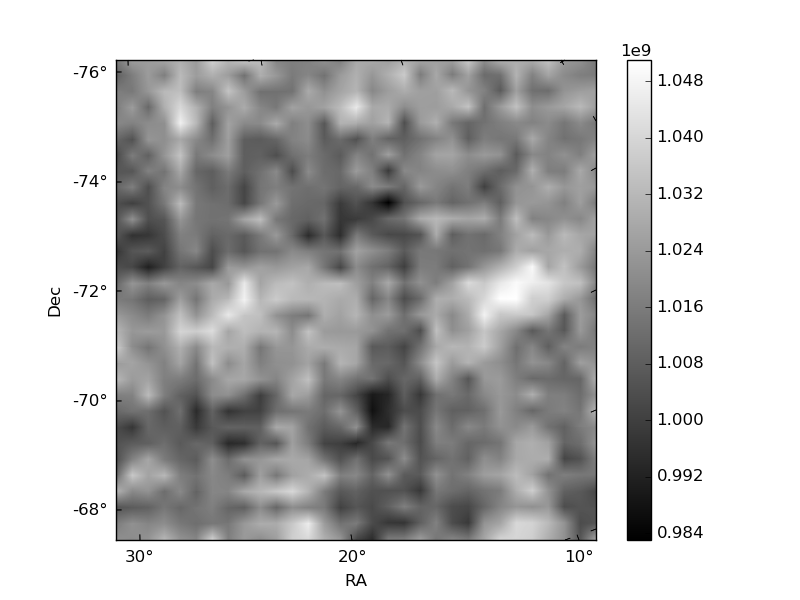
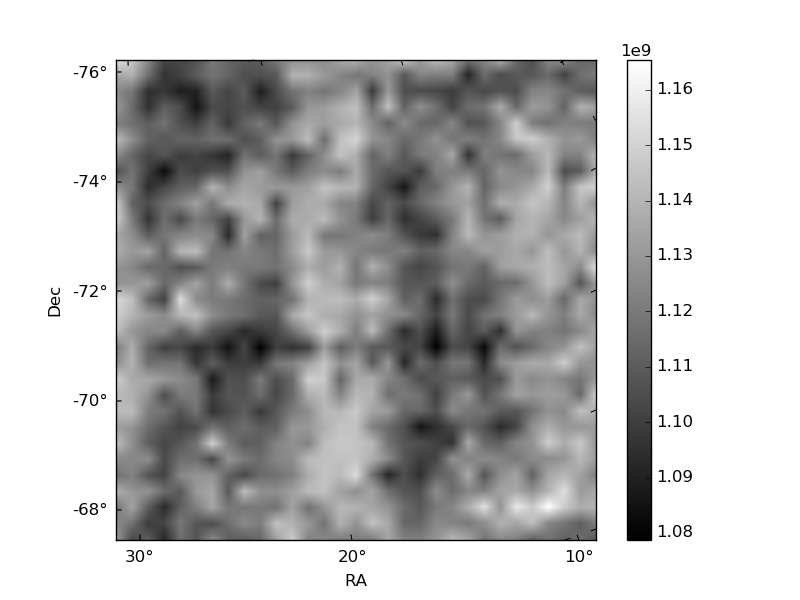
Histogram calculated using DETX and DETY for each event in the final _common_clean file
| Quadrant A | 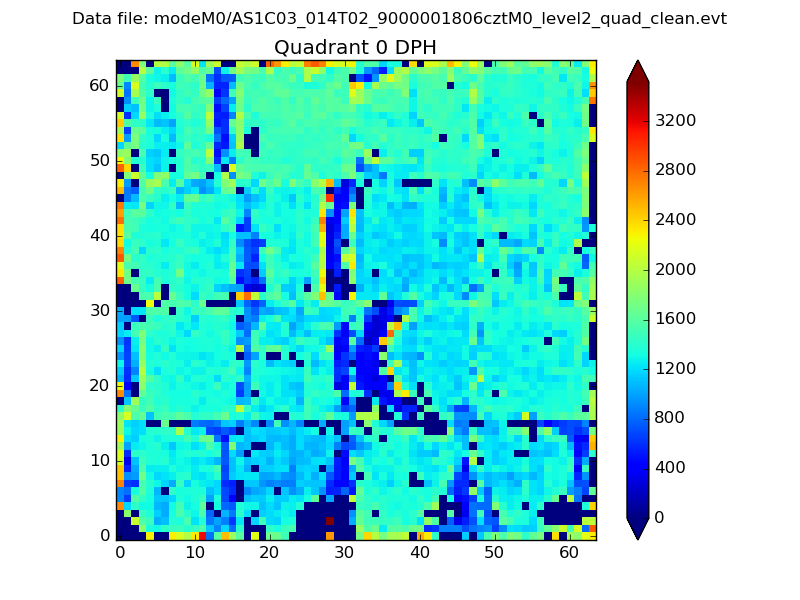 |
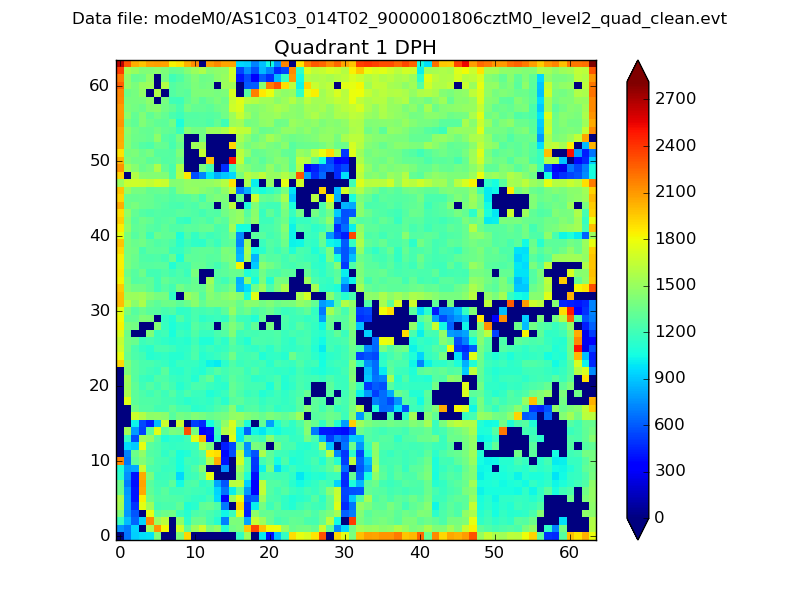 |
Quadrant B |
|---|---|---|---|
| Quadrant D | 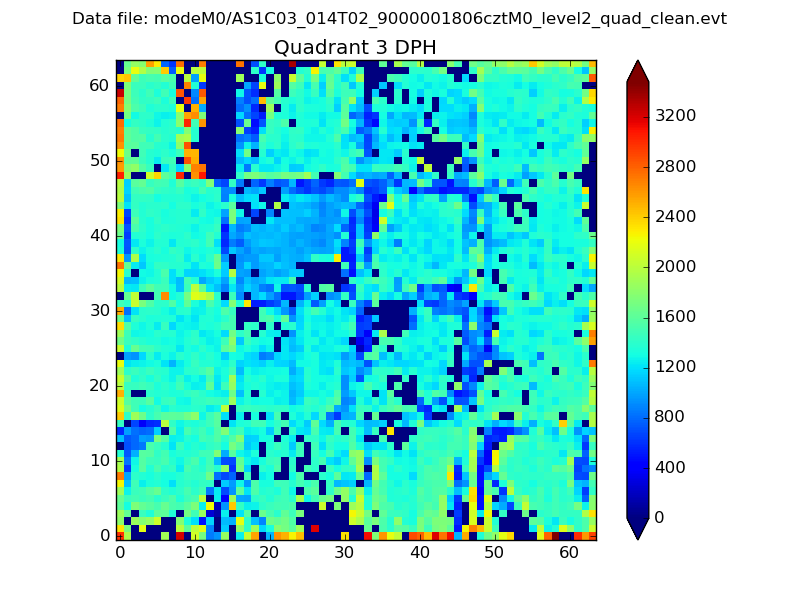 |
 |
Quadrant C |
| Plot type | Count rate plots | Images |
|---|---|---|
| Comparison with Poisson distribution Blue bars denote a histogram of data divided into 1 sec bins. Red curve is a Poisson curve with rate = median count rate of data. |
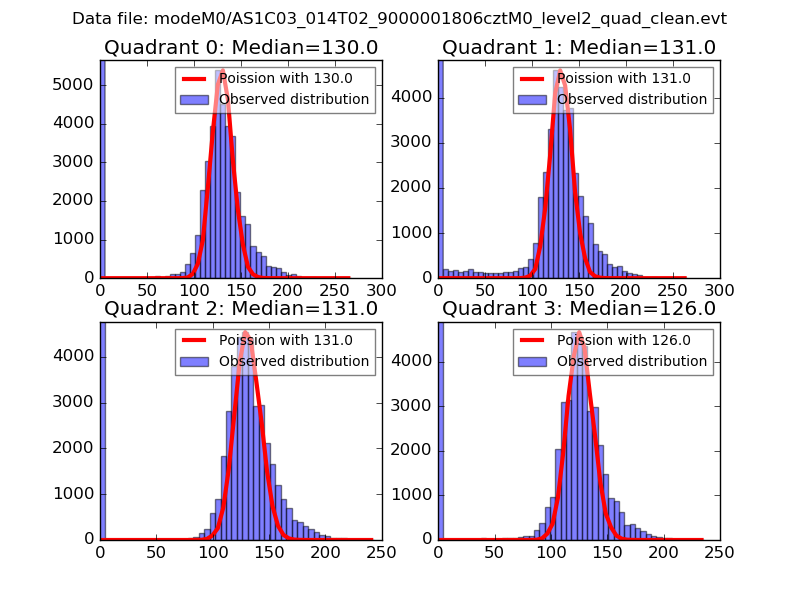 |
 |
| Quadrant-wise count rates Data is divided into 100 sec bins |
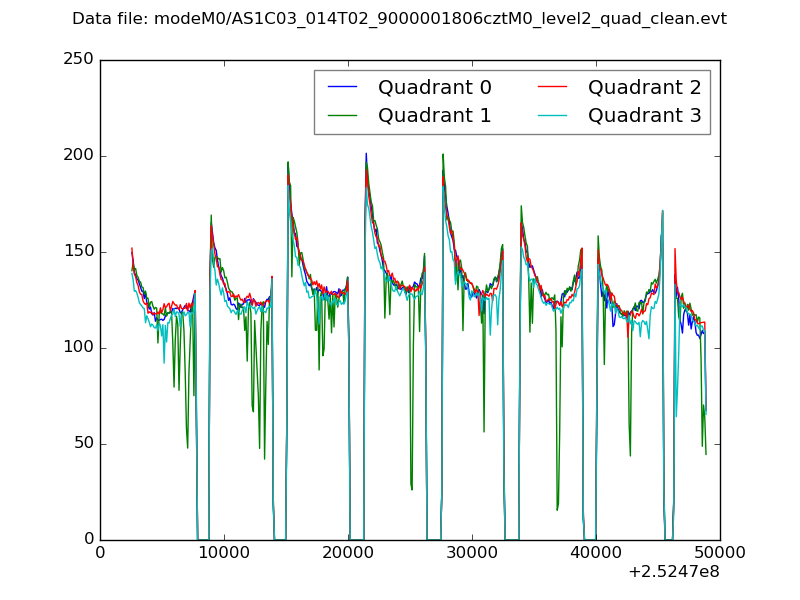 |
|
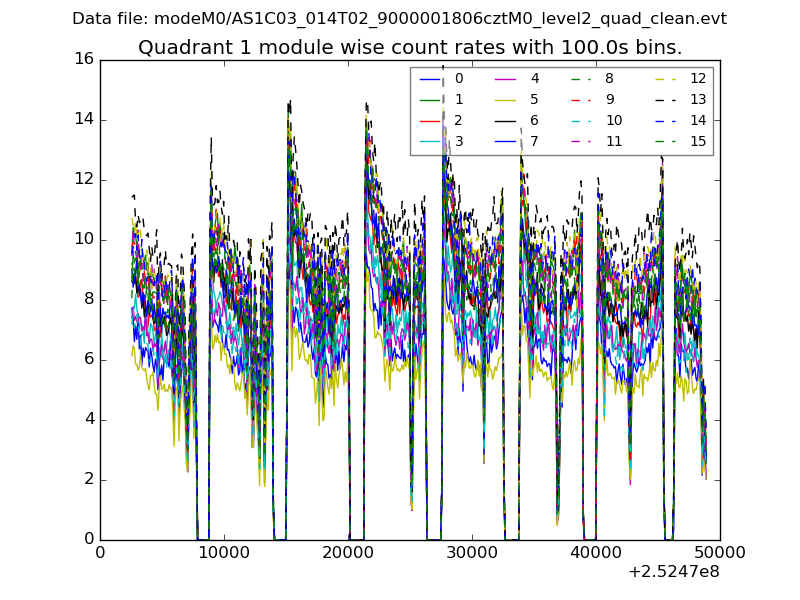
| Module-wise count rates for Quadrant A Data is divided into 100 sec bins |
 |
 |
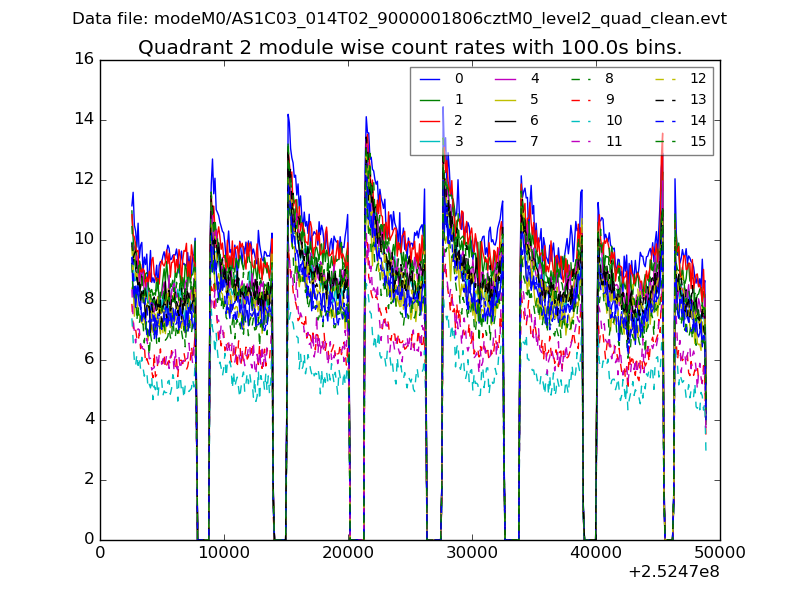
| Module-wise count rates for Quadrant B Data is divided into 100 sec bins |
 |
 |
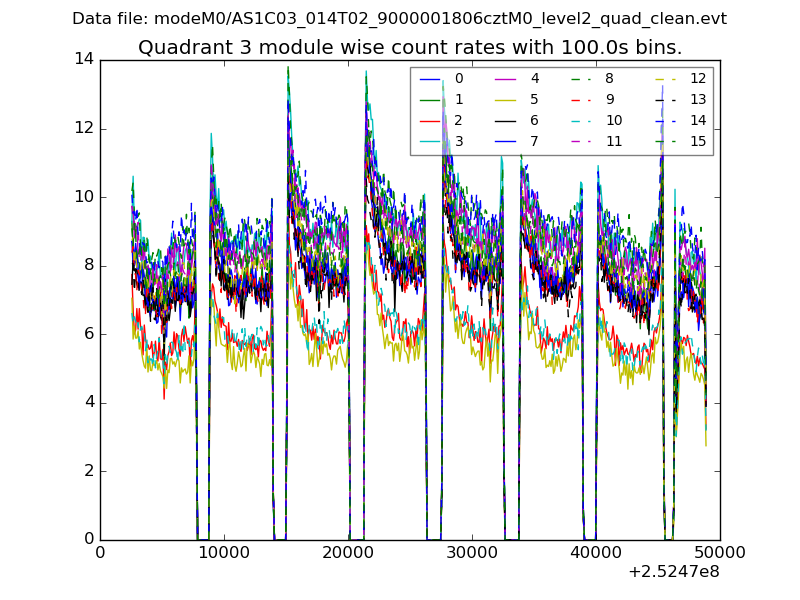
| Module-wise count rates for Quadrant C Data is divided into 100 sec bins |
 |
 |
| Module-wise count rates for Quadrant D Data is divided into 100 sec bins |
 |
 |
| Parameter | Plot |
|---|---|
| CZT HV Monitor | 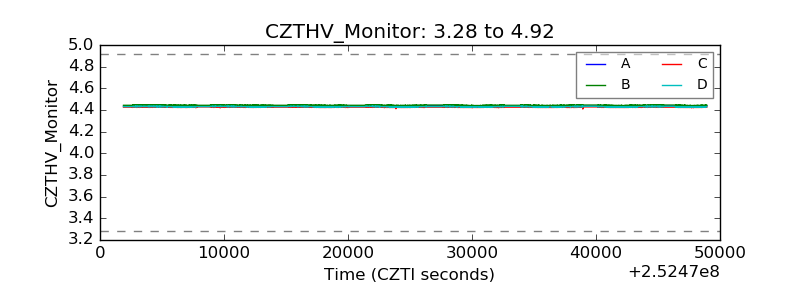 |
| D_VDD | 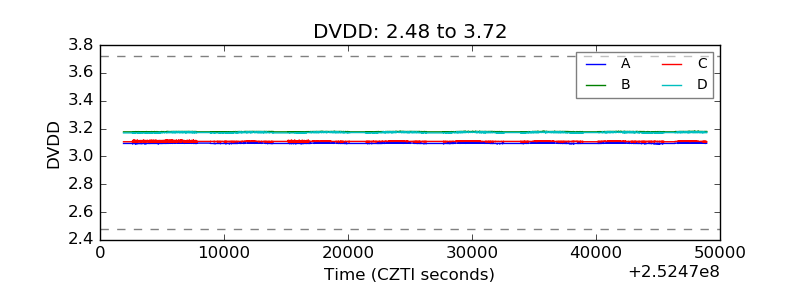 |
| Temperature 1 | 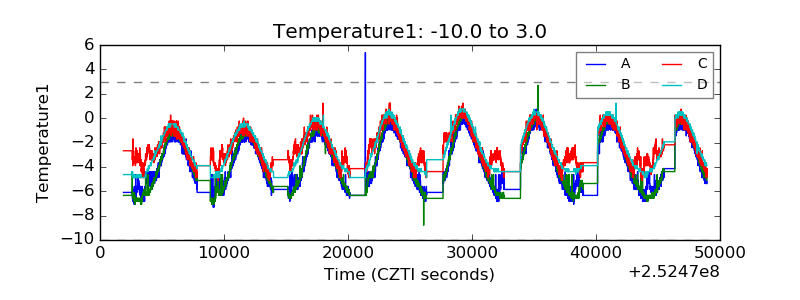 |
| Veto HV Monitor |  |
| Veto LLD | 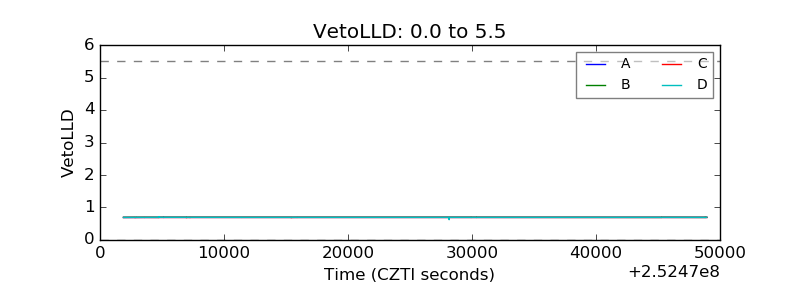 |
| Alpha Counter | 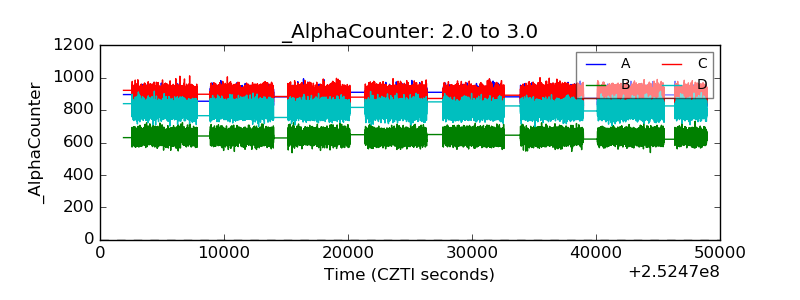 |
| _CPM_Rate | 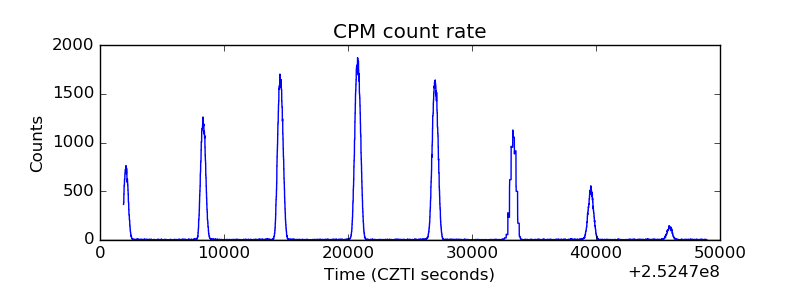 |
| CZT Counter | 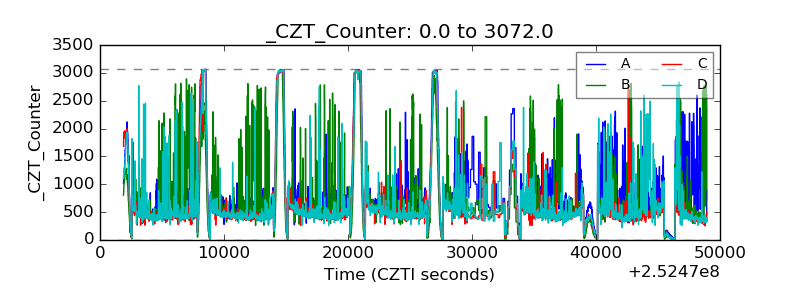 |
| +2.5 Volts monitor | 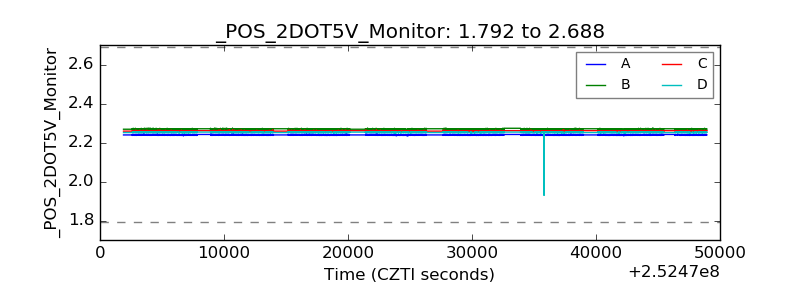 |
| +5 Volts monitor | 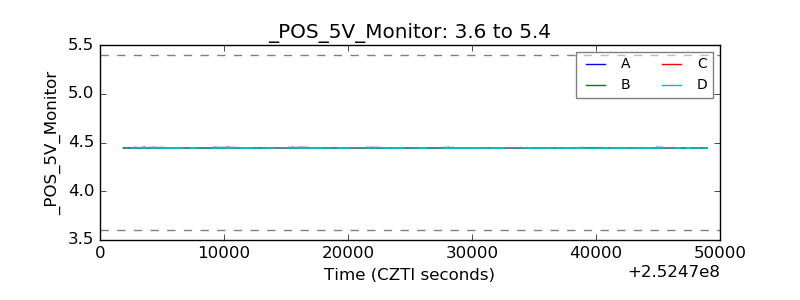 |
| _ROLL_ROT | 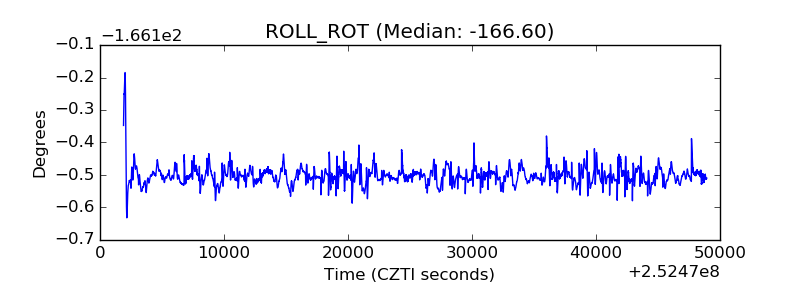 |
| _Roll_DEC | 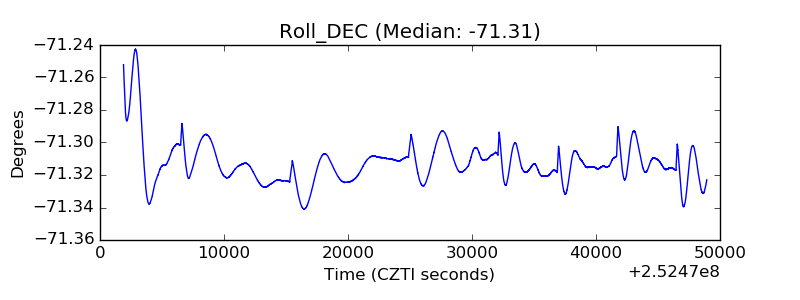 |
| _Roll_RA | 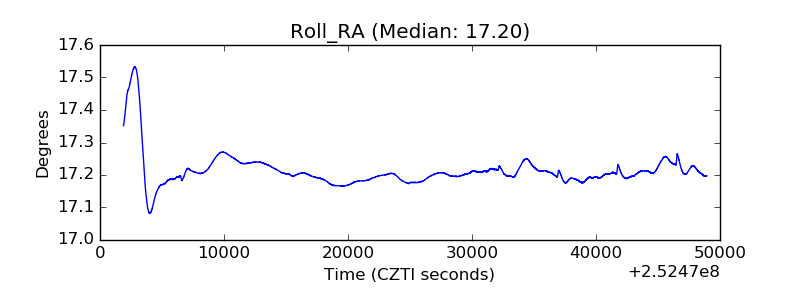 |
| Veto Counter | 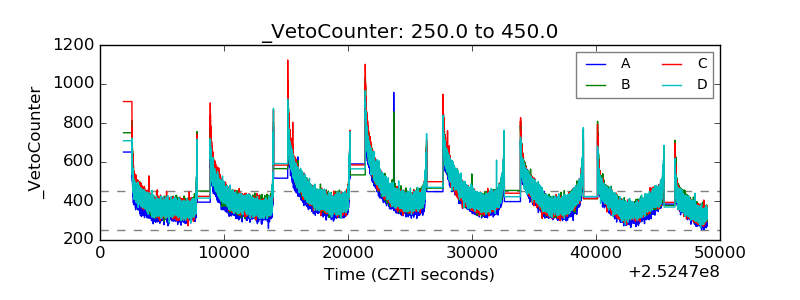 |