| Param | Original file | Final file |
|---|---|---|
| Filename | modeM0/AS1C03_005T01_9000001810cztM0_level2_bc.evt | modeM0/AS1C03_005T01_9000001810cztM0_level2_quad_clean.evt |
| Size (bytes) | 1,724,751,360 | 840,876,480 |
| Size | 1.6 GB | 801.9 MB |
| Events in quadrant A | 12,603,533 | 5,679,688 |
| Events in quadrant B | 13,204,823 | 5,664,873 |
| Events in quadrant C | 10,369,121 | 5,638,443 |
| Events in quadrant D | 13,004,670 | 5,416,425 |
| Mode SS | |||
|---|---|---|---|
| Quadrant | BADHDUFLAG | Total packets | Discarded packets |
| A | 0 | 912 | 0 |
| B | 0 | 912 | 0 |
| C | 0 | 912 | 0 |
| D | 0 | 912 | 0 |
| Mode M0 | |||
|---|---|---|---|
| Quadrant | BADHDUFLAG | Total packets | Discarded packets |
| A | 0 | 109614 | 0 |
| B | 0 | 109631 | 0 |
| C | 0 | 96351 | 0 |
| D | 0 | 105527 | 0 |
| Mode M9 | |||
|---|---|---|---|
| Quadrant | BADHDUFLAG | Total packets | Discarded packets |
| A | 0 | 71 | 0 |
| B | 0 | 71 | 0 |
| C | 0 | 71 | 0 |
| D | 0 | 71 | 0 |
| Quadrant | Total seconds | Saturated seconds | Saturation percentage |
|---|---|---|---|
| A | 44756 | 1027 | 2.294664% |
| B | 44756 | 1913 | 4.274287% |
| C | 44756 | 470 | 1.050139% |
| D | 44756 | 1189 | 2.656627% |
Noise dominated data is calculated using 1-second bins in cleaned event files. If a bin has >2000 counts, and if more than 50% of those come from <1% of pixels, then it is considered to be noise-dominated and hence unusable.
| Quadrant | # 1 sec bins | Bins with >0 counts | Bins with >2000 counts | High rate bins dominated by noise | Noise dominated (total time) | Noise dominated (detector-on time) | Marked lightcurve |
|---|---|---|---|---|---|---|---|
| A | 50516 | 44758 | 42 | 42 | 0.08% | 0.09% |  |
| B | 50516 | 44753 | 45 | 45 | 0.09% | 0.10% |  |
| C | 50516 | 44758 | 20 | 20 | 0.04% | 0.04% |  |
| D | 50517 | 44759 | 162 | 162 | 0.32% | 0.36% |  |
Top three noisy pixels from each quadrant. If the there are fewer than three noisy pixels in the level2.evt file, extra rows are filled as -1
| Pixel properties | Quadrant properties | ||||||
|---|---|---|---|---|---|---|---|
| Quadrant | DetID | PixID | Counts | Sigma | Mean | Median | Sigma |
| A | 13 | 251 | 1982443 | 3993.6 | 2296 | 2261 | 495.8 |
| A | 1 | 162 | 573344 | 1151.75 | 2296 | 2261 | 495.8 |
| A | 5 | 16 | 364454 | 730.46 | 2296 | 2261 | 495.8 |
| B | 4 | 239 | 2427802 | 5621.93 | 2284 | 2236 | 431.4 |
| B | 0 | 219 | 361973 | 833.79 | 2284 | 2236 | 431.4 |
| B | 0 | 229 | 254180 | 583.95 | 2284 | 2236 | 431.4 |
| C | 15 | 208 | 1108500 | 2220.4 | 2235 | 2212 | 498.2 |
| C | 1 | 16 | 248078 | 493.47 | 2235 | 2212 | 498.2 |
| C | 4 | 175 | 173145 | 343.07 | 2235 | 2212 | 498.2 |
| D | 1 | 52 | 2090581 | 3985.91 | 2250 | 2176 | 523.9 |
| D | 13 | 104 | 470775 | 894.36 | 2250 | 2176 | 523.9 |
| D | 10 | 199 | 311985 | 591.3 | 2250 | 2176 | 523.9 |
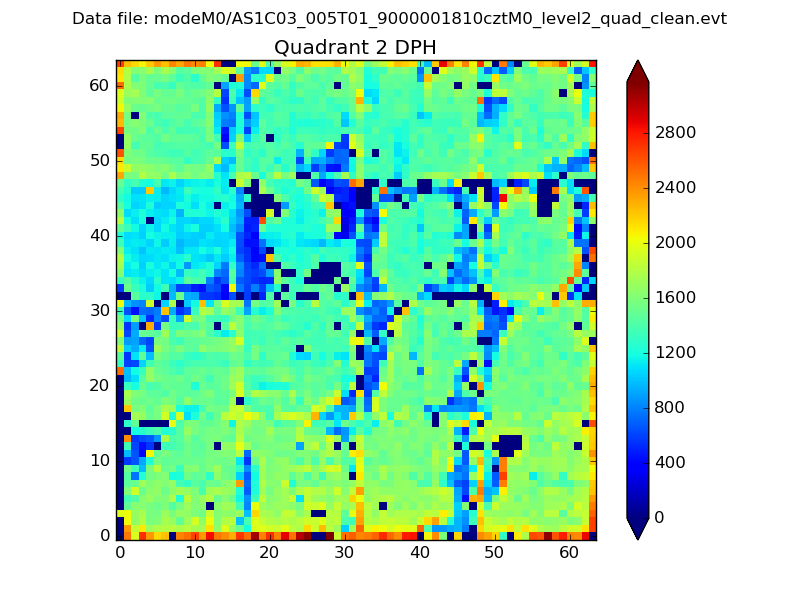
Histogram calculated using DETX and DETY for each event in the final _common_clean file
| Quadrant A |  |
 |
Quadrant B |
|---|---|---|---|
| Quadrant D | 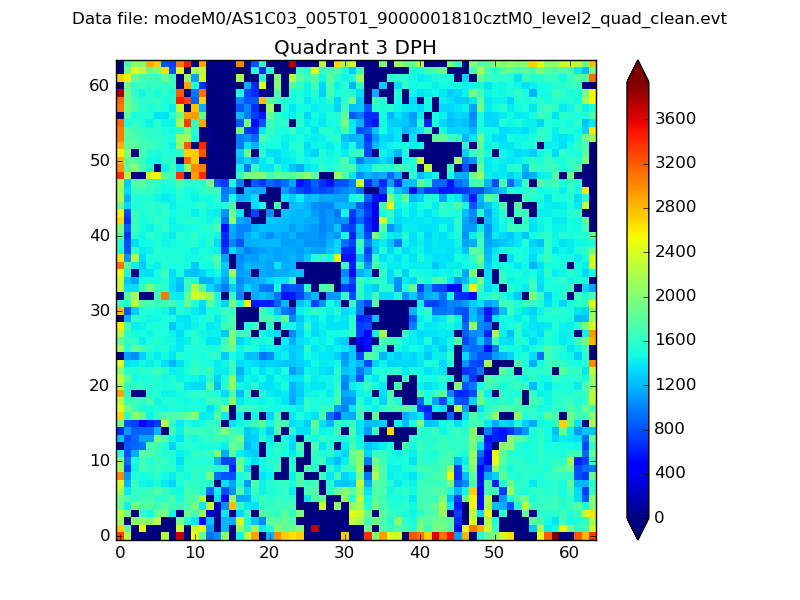 |
 |
Quadrant C |
| Plot type | Count rate plots | Images |
|---|---|---|
| Comparison with Poisson distribution Blue bars denote a histogram of data divided into 1 sec bins. Red curve is a Poisson curve with rate = median count rate of data. |
 |
 |
| Quadrant-wise count rates Data is divided into 100 sec bins |
 |
|
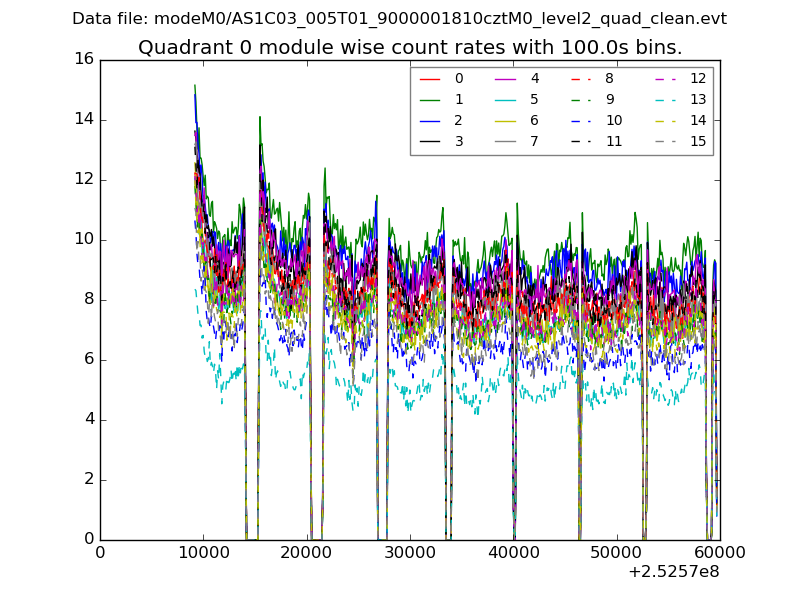
| Module-wise count rates for Quadrant A Data is divided into 100 sec bins |
 |
 |
| Module-wise count rates for Quadrant B Data is divided into 100 sec bins |
 |
 |
| Module-wise count rates for Quadrant C Data is divided into 100 sec bins |
 |
 |
| Module-wise count rates for Quadrant D Data is divided into 100 sec bins |
 |
 |
| Parameter | Plot |
|---|---|
| CZT HV Monitor |  |
| D_VDD | 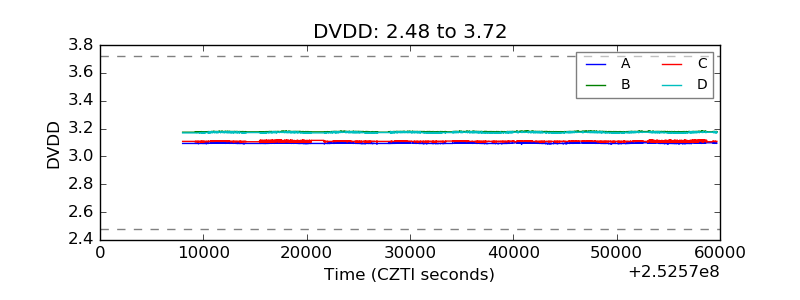 |
| Temperature 1 |  |
| Veto HV Monitor |  |
| Veto LLD |  |
| Alpha Counter |  |
| _CPM_Rate |  |
| CZT Counter |  |
| +2.5 Volts monitor |  |
| +5 Volts monitor |  |
| _ROLL_ROT |  |
| _Roll_DEC |  |
| _Roll_RA |  |
| Veto Counter |  |