| Param | Original file | Final file |
|---|---|---|
| Filename | modeM0/AS1G08_006T04_9000001812cztM0_level2_bc.evt | modeM0/AS1G08_006T04_9000001812cztM0_level2_quad_clean.evt |
| Size (bytes) | 1,835,792,640 | 758,162,880 |
| Size | 1.7 GB | 723.0 MB |
| Events in quadrant A | 15,063,078 | 4,963,006 |
| Events in quadrant B | 15,518,470 | 5,160,910 |
| Events in quadrant C | 11,046,912 | 5,149,559 |
| Events in quadrant D | 11,271,495 | 4,973,444 |
| Mode M0 | |||
|---|---|---|---|
| Quadrant | BADHDUFLAG | Total packets | Discarded packets |
| A | 0 | 114801 | 0 |
| B | 0 | 109237 | 0 |
| C | 0 | 91494 | 0 |
| D | 0 | 91003 | 0 |
| Mode M9 | |||
|---|---|---|---|
| Quadrant | BADHDUFLAG | Total packets | Discarded packets |
| A | 0 | 78 | 0 |
| B | 0 | 78 | 0 |
| C | 0 | 78 | 0 |
| D | 0 | 78 | 0 |
| Mode SS | |||
|---|---|---|---|
| Quadrant | BADHDUFLAG | Total packets | Discarded packets |
| A | 0 | 804 | 0 |
| B | 0 | 804 | 0 |
| C | 0 | 804 | 0 |
| D | 0 | 804 | 0 |
| Quadrant | Total seconds | Saturated seconds | Saturation percentage |
|---|---|---|---|
| A | 39578 | 3612 | 9.126282% |
| B | 39578 | 1920 | 4.851180% |
| C | 39578 | 720 | 1.819192% |
| D | 39578 | 770 | 1.945525% |
Noise dominated data is calculated using 1-second bins in cleaned event files. If a bin has >2000 counts, and if more than 50% of those come from <1% of pixels, then it is considered to be noise-dominated and hence unusable.
| Quadrant | # 1 sec bins | Bins with >0 counts | Bins with >2000 counts | High rate bins dominated by noise | Noise dominated (total time) | Noise dominated (detector-on time) | Marked lightcurve |
|---|---|---|---|---|---|---|---|
| A | 47344 | 39569 | 243 | 243 | 0.51% | 0.61% |  |
| B | 47344 | 39578 | 42 | 42 | 0.09% | 0.11% |  |
| C | 47344 | 39580 | 47 | 47 | 0.10% | 0.12% | 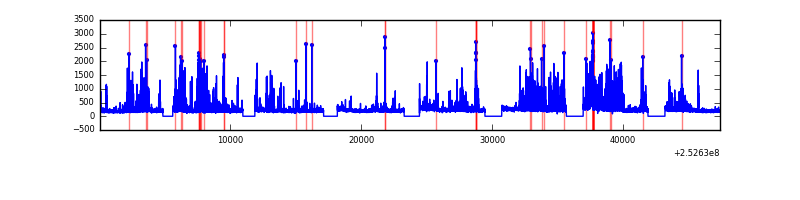 |
| D | 47344 | 39580 | 89 | 89 | 0.19% | 0.22% |  |
Top three noisy pixels from each quadrant. If the there are fewer than three noisy pixels in the level2.evt file, extra rows are filled as -1
| Pixel properties | Quadrant properties | ||||||
|---|---|---|---|---|---|---|---|
| Quadrant | DetID | PixID | Counts | Sigma | Mean | Median | Sigma |
| A | 14 | 237 | 3027579 | 6893.09 | 2024 | 1997 | 438.9 |
| A | 8 | 15 | 1435569 | 3266.06 | 2024 | 1997 | 438.9 |
| A | 13 | 251 | 1307074 | 2973.32 | 2024 | 1997 | 438.9 |
| B | 4 | 239 | 2931752 | 7500.69 | 2085 | 2042 | 390.6 |
| B | 4 | 206 | 2635231 | 6741.54 | 2085 | 2042 | 390.6 |
| B | 11 | 51 | 523581 | 1335.25 | 2085 | 2042 | 390.6 |
| C | 15 | 208 | 2537476 | 5653.62 | 2046 | 2034 | 448.5 |
| C | 3 | 233 | 228361 | 504.67 | 2046 | 2034 | 448.5 |
| C | 4 | 175 | 137737 | 302.6 | 2046 | 2034 | 448.5 |
| D | 1 | 52 | 1602479 | 3305.12 | 2077 | 2012 | 484.2 |
| D | 10 | 199 | 498129 | 1024.53 | 2077 | 2012 | 484.2 |
| D | 13 | 104 | 250512 | 513.18 | 2077 | 2012 | 484.2 |
Histogram calculated using DETX and DETY for each event in the final _common_clean file
| Quadrant A | 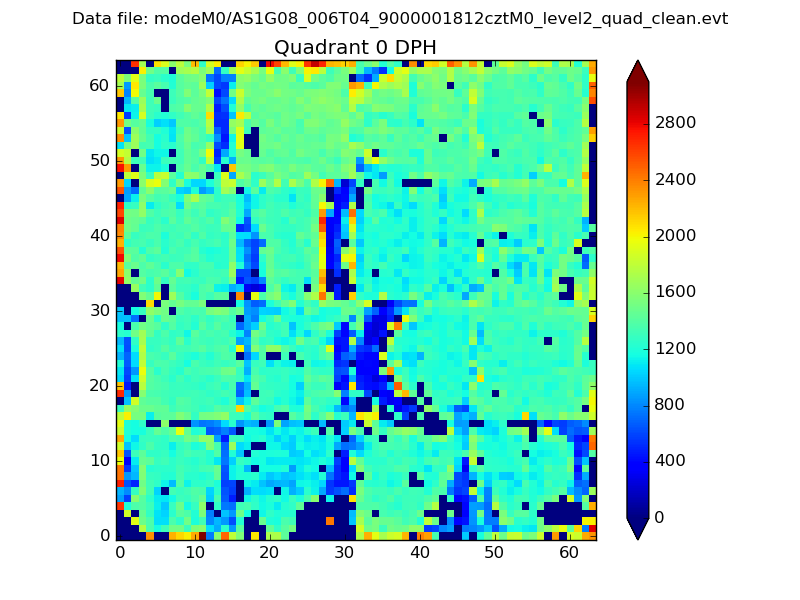 |
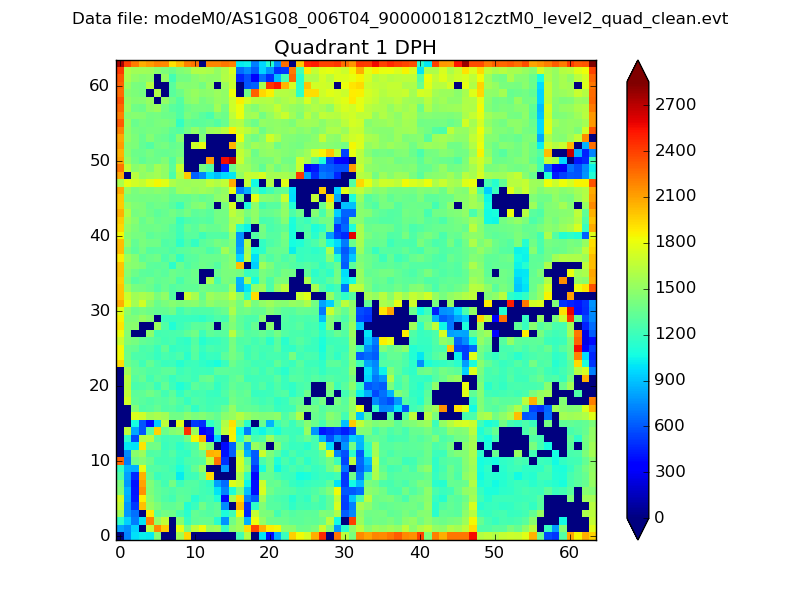 |
Quadrant B |
|---|---|---|---|
| Quadrant D | 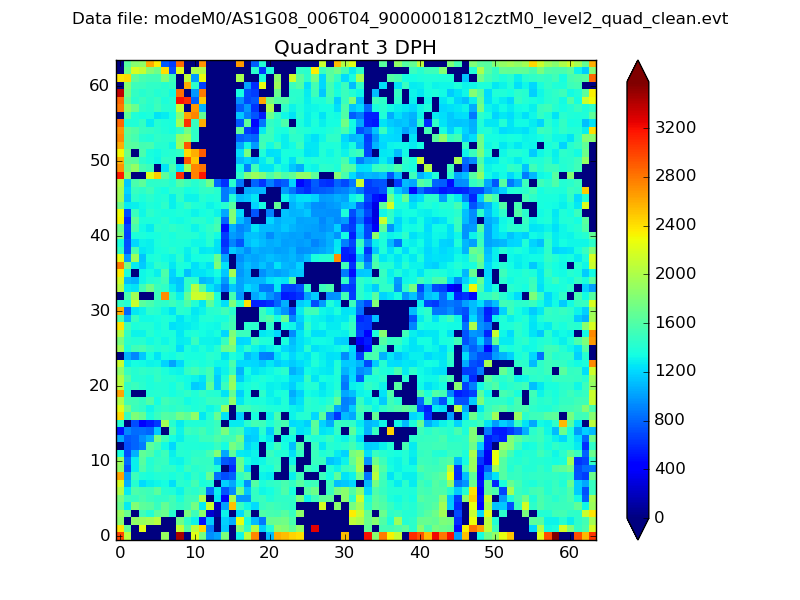 |
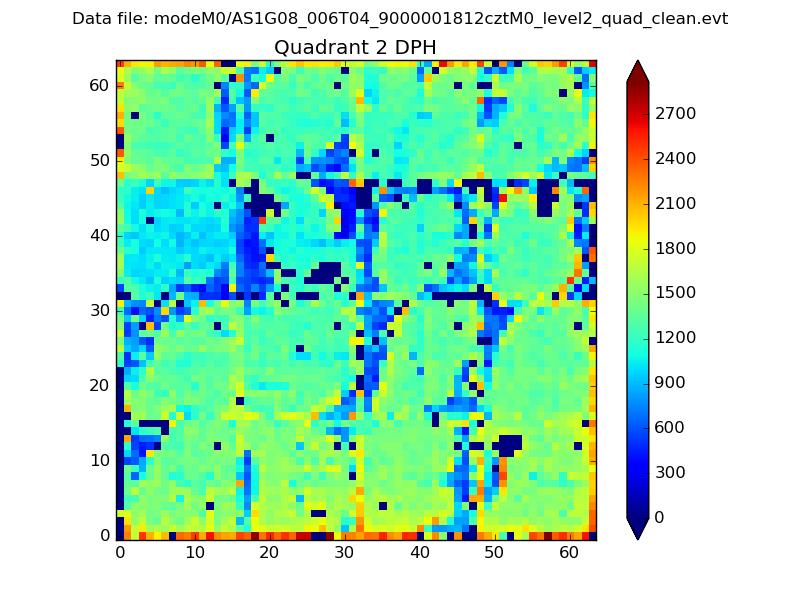 |
Quadrant C |
| Plot type | Count rate plots | Images |
|---|---|---|
| Comparison with Poisson distribution Blue bars denote a histogram of data divided into 1 sec bins. Red curve is a Poisson curve with rate = median count rate of data. |
 |
 |
| Quadrant-wise count rates Data is divided into 100 sec bins |
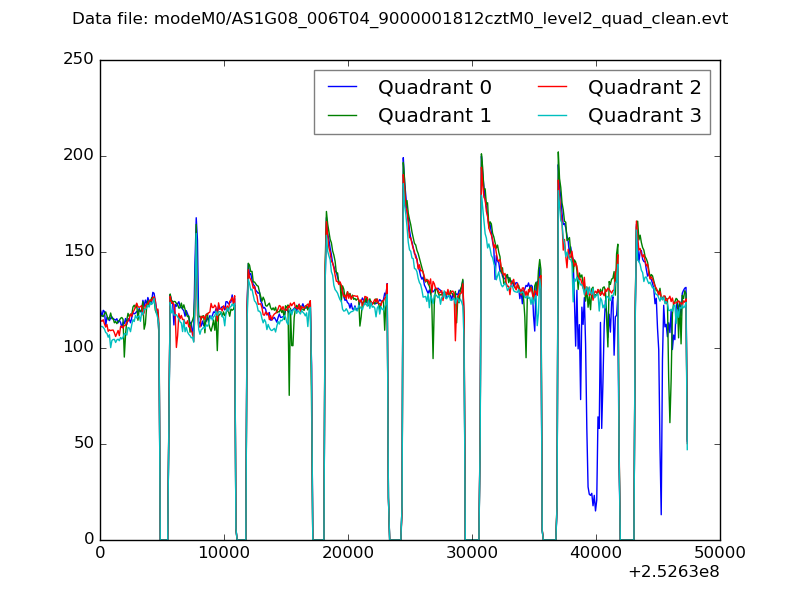 |
|
| Module-wise count rates for Quadrant A Data is divided into 100 sec bins |
 |
 |
| Module-wise count rates for Quadrant B Data is divided into 100 sec bins |
 |
 |
| Module-wise count rates for Quadrant C Data is divided into 100 sec bins |
 |
 |
| Module-wise count rates for Quadrant D Data is divided into 100 sec bins |
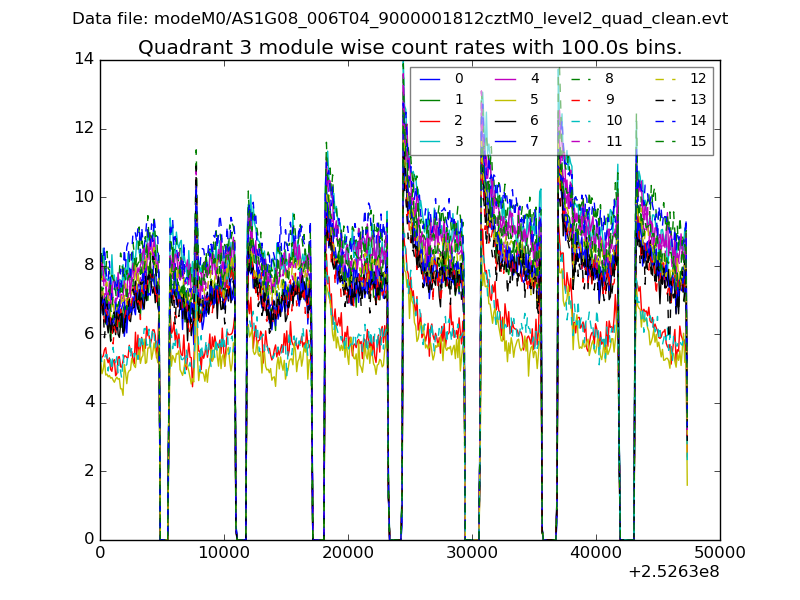 |
 |
| Parameter | Plot |
|---|---|
| CZT HV Monitor | 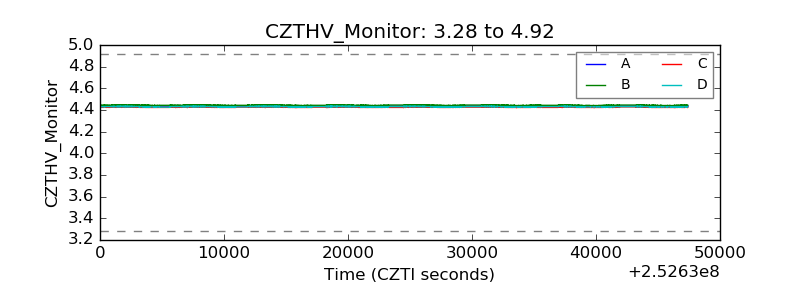 |
| D_VDD | 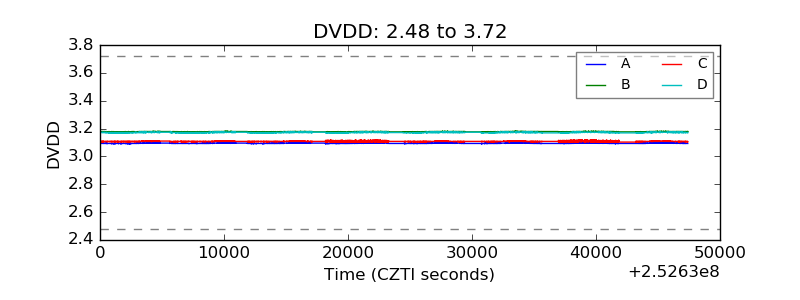 |
| Temperature 1 |  |
| Veto HV Monitor |  |
| Veto LLD |  |
| Alpha Counter |  |
| _CPM_Rate | 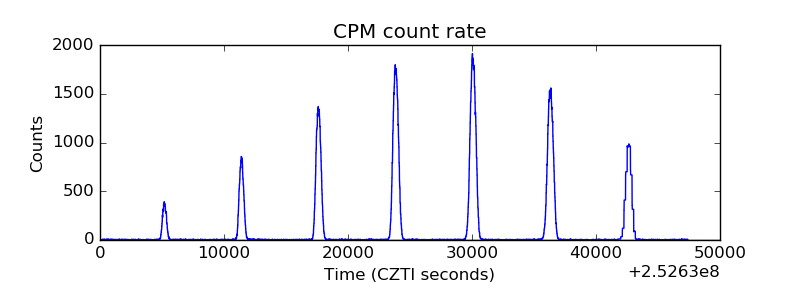 |
| CZT Counter |  |
| +2.5 Volts monitor | 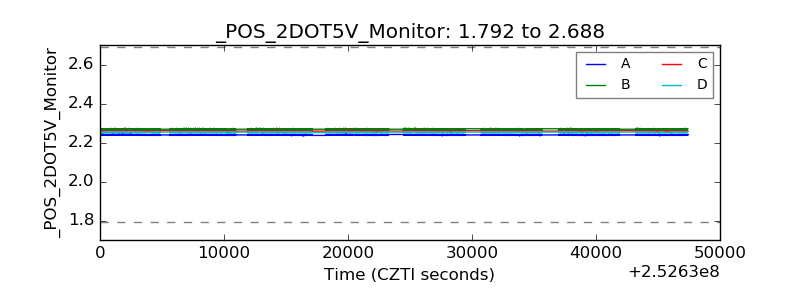 |
| +5 Volts monitor |  |
| _ROLL_ROT | 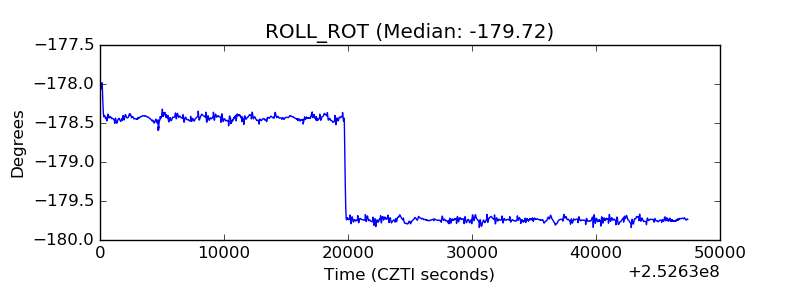 |
| _Roll_DEC |  |
| _Roll_RA |  |
| Veto Counter |  |