| Param | Original file | Final file |
|---|---|---|
| Filename | modeM0/AS1A04_048T01_9000001820cztM0_level2_bc.evt | modeM0/AS1A04_048T01_9000001820cztM0_level2_quad_clean.evt |
| Size (bytes) | 3,119,192,640 | 1,015,531,200 |
| Size | 2.9 GB | 968.5 MB |
| Events in quadrant A | 23,272,362 | 6,332,953 |
| Events in quadrant B | 25,629,809 | 6,384,293 |
| Events in quadrant C | 17,913,255 | 6,445,726 |
| Events in quadrant D | 22,196,541 | 6,108,437 |
| Mode M0 | |||
|---|---|---|---|
| Quadrant | BADHDUFLAG | Total packets | Discarded packets |
| A | 0 | 200051 | 0 |
| B | 0 | 207419 | 0 |
| C | 0 | 171098 | 0 |
| D | 0 | 186243 | 0 |
| Mode M9 | |||
|---|---|---|---|
| Quadrant | BADHDUFLAG | Total packets | Discarded packets |
| A | 0 | 129 | 0 |
| B | 0 | 129 | 0 |
| C | 0 | 129 | 0 |
| D | 0 | 129 | 0 |
| Mode SS | |||
|---|---|---|---|
| Quadrant | BADHDUFLAG | Total packets | Discarded packets |
| A | 0 | 1626 | 0 |
| B | 0 | 1626 | 0 |
| C | 0 | 1626 | 0 |
| D | 0 | 1626 | 0 |
| Quadrant | Total seconds | Saturated seconds | Saturation percentage |
|---|---|---|---|
| A | 80038 | 1935 | 2.417602% |
| B | 80038 | 5609 | 7.007921% |
| C | 80038 | 991 | 1.238162% |
| D | 80038 | 1820 | 2.273920% |
Noise dominated data is calculated using 1-second bins in cleaned event files. If a bin has >2000 counts, and if more than 50% of those come from <1% of pixels, then it is considered to be noise-dominated and hence unusable.
| Quadrant | # 1 sec bins | Bins with >0 counts | Bins with >2000 counts | High rate bins dominated by noise | Noise dominated (total time) | Noise dominated (detector-on time) | Marked lightcurve |
|---|---|---|---|---|---|---|---|
| A | 92229 | 80043 | 29 | 29 | 0.03% | 0.04% | 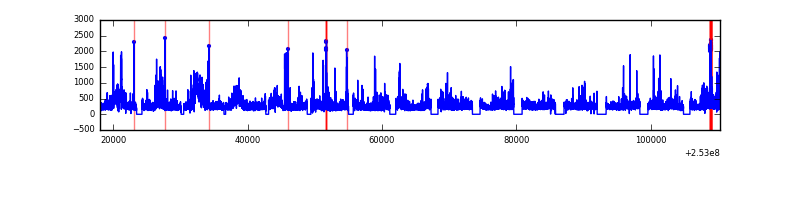 |
| B | 92229 | 79998 | 50 | 50 | 0.05% | 0.06% | 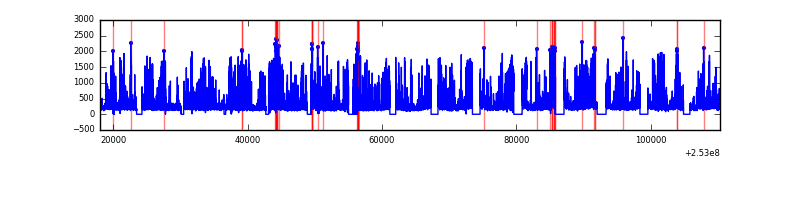 |
| C | 92229 | 80040 | 36 | 36 | 0.04% | 0.04% |  |
| D | 92229 | 80040 | 137 | 137 | 0.15% | 0.17% |  |
Top three noisy pixels from each quadrant. If the there are fewer than three noisy pixels in the level2.evt file, extra rows are filled as -1
| Pixel properties | Quadrant properties | ||||||
|---|---|---|---|---|---|---|---|
| Quadrant | DetID | PixID | Counts | Sigma | Mean | Median | Sigma |
| A | 13 | 251 | 1873843 | 2157.0 | 4011 | 3937 | 866.9 |
| A | 15 | 174 | 1593199 | 1833.27 | 4011 | 3937 | 866.9 |
| A | 1 | 162 | 1228695 | 1412.8 | 4011 | 3937 | 866.9 |
| B | 4 | 239 | 4100350 | 5509.02 | 3953 | 3851 | 743.6 |
| B | 0 | 85 | 3885268 | 5219.77 | 3953 | 3851 | 743.6 |
| B | 3 | 64 | 535718 | 715.26 | 3953 | 3851 | 743.6 |
| C | 4 | 254 | 1307556 | 1475.04 | 4012 | 3967 | 883.8 |
| C | 15 | 208 | 619237 | 696.19 | 4012 | 3967 | 883.8 |
| C | 0 | 207 | 157584 | 173.82 | 4012 | 3967 | 883.8 |
| D | 1 | 52 | 1687676 | 1843.52 | 3998 | 3857 | 913.4 |
| D | 5 | 222 | 880685 | 959.99 | 3998 | 3857 | 913.4 |
| D | 10 | 199 | 779084 | 848.75 | 3998 | 3857 | 913.4 |
Histogram calculated using DETX and DETY for each event in the final _common_clean file
| Quadrant A | 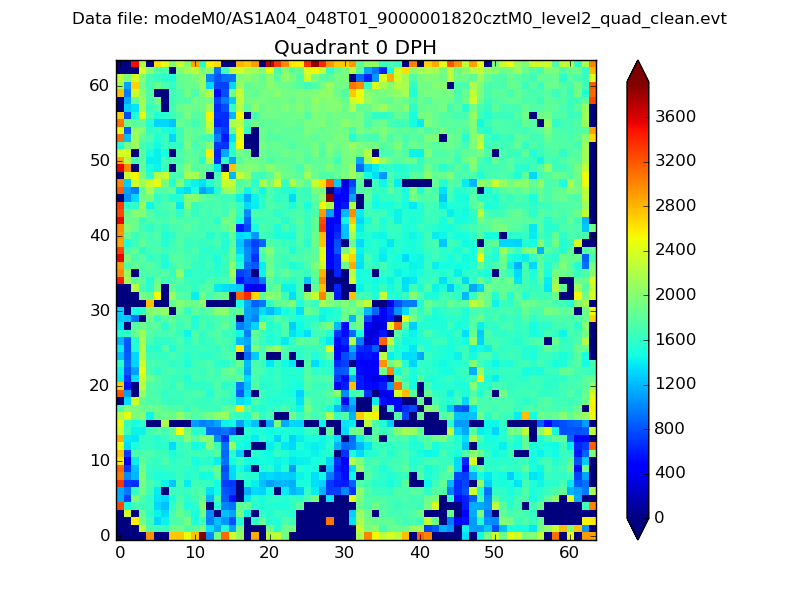 |
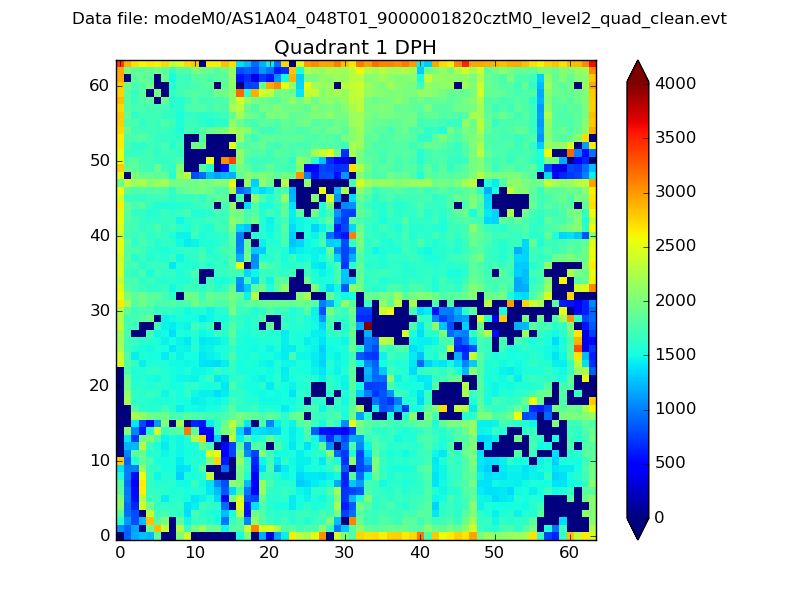 |
Quadrant B |
|---|---|---|---|
| Quadrant D | 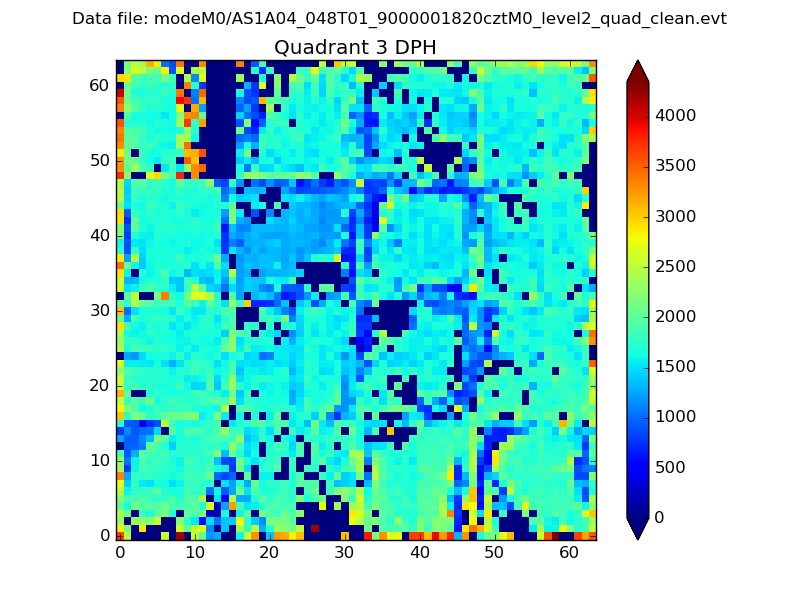 |
 |
Quadrant C |
| Plot type | Count rate plots | Images |
|---|---|---|
| Comparison with Poisson distribution Blue bars denote a histogram of data divided into 1 sec bins. Red curve is a Poisson curve with rate = median count rate of data. |
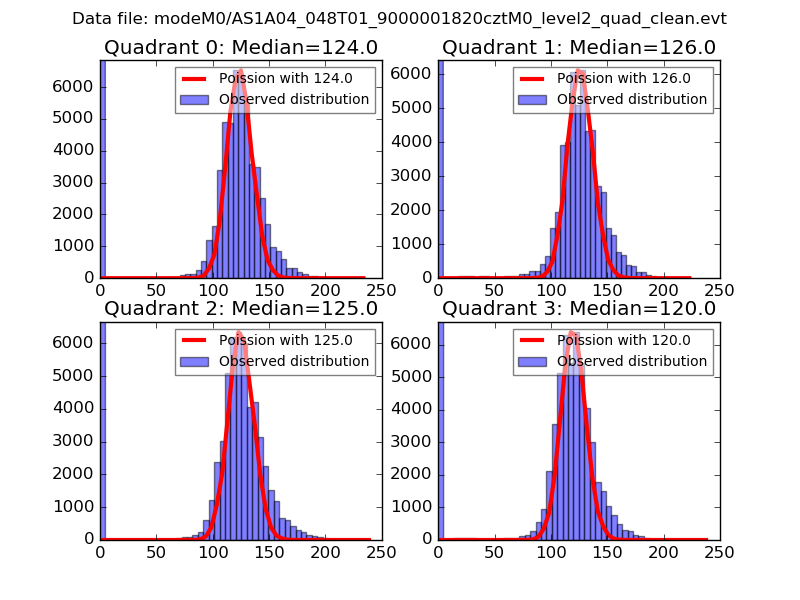 |
 |
| Quadrant-wise count rates Data is divided into 100 sec bins |
 |
|
| Module-wise count rates for Quadrant A Data is divided into 100 sec bins |
 |
 |
| Module-wise count rates for Quadrant B Data is divided into 100 sec bins |
 |
 |
| Module-wise count rates for Quadrant C Data is divided into 100 sec bins |
 |
 |
| Module-wise count rates for Quadrant D Data is divided into 100 sec bins |
 |
 |
| Parameter | Plot |
|---|---|
| CZT HV Monitor | 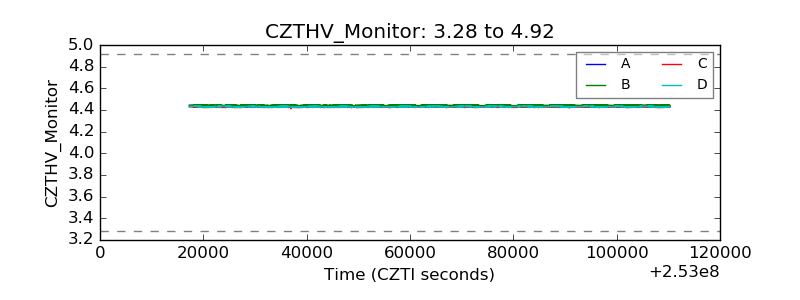 |
| D_VDD |  |
| Temperature 1 |  |
| Veto HV Monitor | 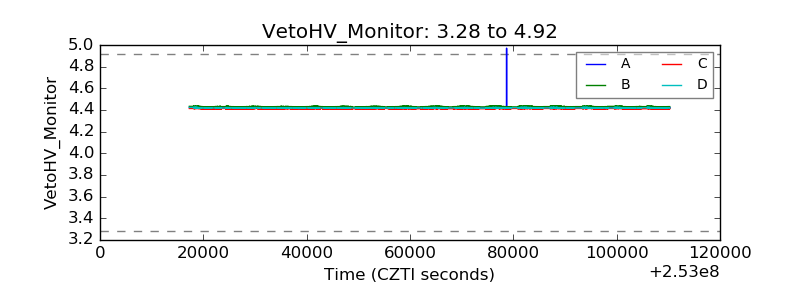 |
| Veto LLD |  |
| Alpha Counter |  |
| _CPM_Rate |  |
| CZT Counter | 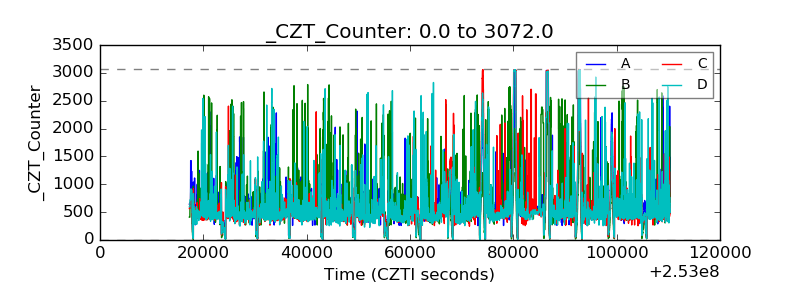 |
| +2.5 Volts monitor | 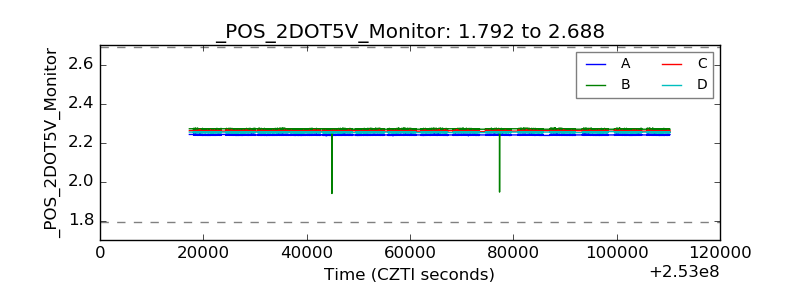 |
| +5 Volts monitor | 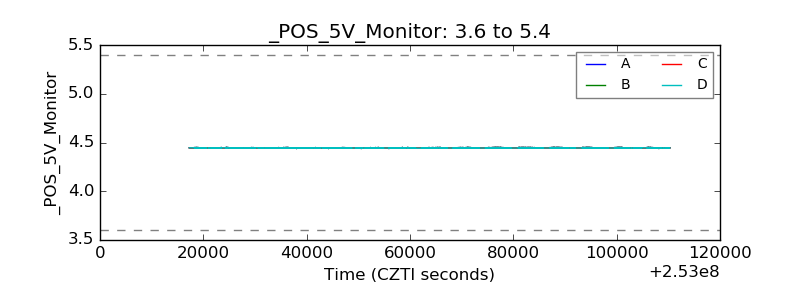 |
| _ROLL_ROT |  |
| _Roll_DEC |  |
| _Roll_RA |  |
| Veto Counter | 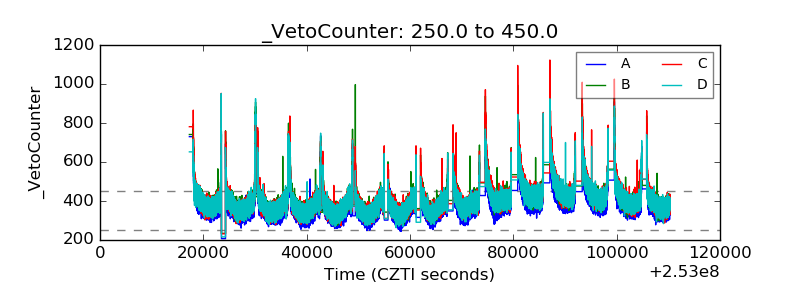 |