| Param | Original file | Final file |
|---|---|---|
| Filename | modeM0/AS1A04_196T02_9000001818cztM0_level2_bc.evt | modeM0/AS1A04_196T02_9000001818cztM0_level2_quad_clean.evt |
| Size (bytes) | 169,004,160 | 54,285,120 |
| Size | 161.2 MB | 51.8 MB |
| Events in quadrant A | 1,236,919 | 330,717 |
| Events in quadrant B | 1,194,644 | 338,947 |
| Events in quadrant C | 992,582 | 332,122 |
| Events in quadrant D | 1,371,474 | 317,139 |
| Mode M0 | |||
|---|---|---|---|
| Quadrant | BADHDUFLAG | Total packets | Discarded packets |
| A | 0 | 11221 | 0 |
| B | 0 | 10279 | 0 |
| C | 0 | 9493 | 0 |
| D | 0 | 10937 | 0 |
| Mode SS | |||
|---|---|---|---|
| Quadrant | BADHDUFLAG | Total packets | Discarded packets |
| A | 0 | 94 | 0 |
| B | 0 | 94 | 0 |
| C | 0 | 94 | 0 |
| D | 0 | 94 | 0 |
| Mode M9 | |||
|---|---|---|---|
| Quadrant | BADHDUFLAG | Total packets | Discarded packets |
| A | 0 | 9 | 0 |
| B | 0 | 9 | 0 |
| C | 0 | 9 | 0 |
| D | 0 | 9 | 0 |
| Quadrant | Total seconds | Saturated seconds | Saturation percentage |
|---|---|---|---|
| A | 4614 | 81 | 1.755527% |
| B | 4614 | 86 | 1.863893% |
| C | 4614 | 21 | 0.455137% |
| D | 4614 | 92 | 1.993932% |
Noise dominated data is calculated using 1-second bins in cleaned event files. If a bin has >2000 counts, and if more than 50% of those come from <1% of pixels, then it is considered to be noise-dominated and hence unusable.
| Quadrant | # 1 sec bins | Bins with >0 counts | Bins with >2000 counts | High rate bins dominated by noise | Noise dominated (total time) | Noise dominated (detector-on time) | Marked lightcurve |
|---|---|---|---|---|---|---|---|
| A | 4614 | 4614 | 0 | 0 | 0.00% | 0.00% | 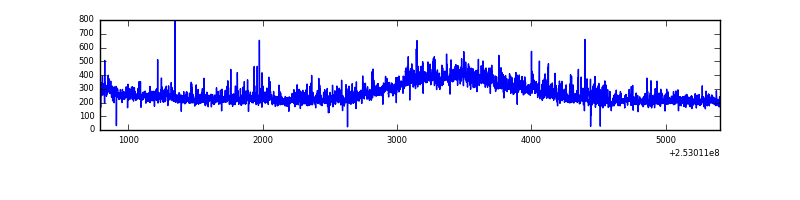 |
| B | 4614 | 4614 | 0 | 0 | 0.00% | 0.00% | 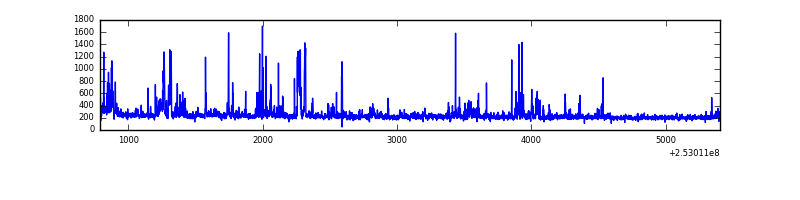 |
| C | 4614 | 4614 | 0 | 0 | 0.00% | 0.00% | 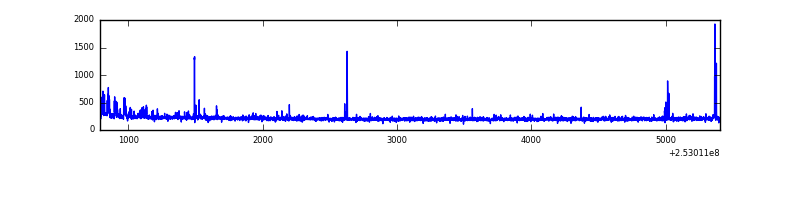 |
| D | 4615 | 4615 | 9 | 9 | 0.20% | 0.20% | 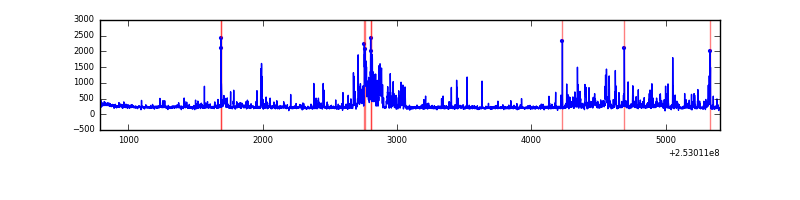 |
Top three noisy pixels from each quadrant. If the there are fewer than three noisy pixels in the level2.evt file, extra rows are filled as -1
| Pixel properties | Quadrant properties | ||||||
|---|---|---|---|---|---|---|---|
| Quadrant | DetID | PixID | Counts | Sigma | Mean | Median | Sigma |
| A | 0 | 23 | 158774 | 2845.24 | 247 | 242 | 55.7 |
| A | 1 | 162 | 64767 | 1158.06 | 247 | 242 | 55.7 |
| A | 13 | 251 | 26463 | 470.6 | 247 | 242 | 55.7 |
| B | 4 | 239 | 147391 | 2975.04 | 249 | 244 | 49.5 |
| B | 0 | 85 | 16582 | 330.32 | 249 | 244 | 49.5 |
| B | 0 | 190 | 12242 | 242.58 | 249 | 244 | 49.5 |
| C | 1 | 16 | 21505 | 391.29 | 241 | 238 | 54.4 |
| C | 15 | 208 | 13401 | 242.19 | 241 | 238 | 54.4 |
| C | 4 | 254 | 12661 | 228.57 | 241 | 238 | 54.4 |
| D | 14 | 34 | 133489 | 2307.12 | 242 | 233 | 57.8 |
| D | 13 | 104 | 123024 | 2125.94 | 242 | 233 | 57.8 |
| D | 1 | 52 | 61111 | 1054.01 | 242 | 233 | 57.8 |
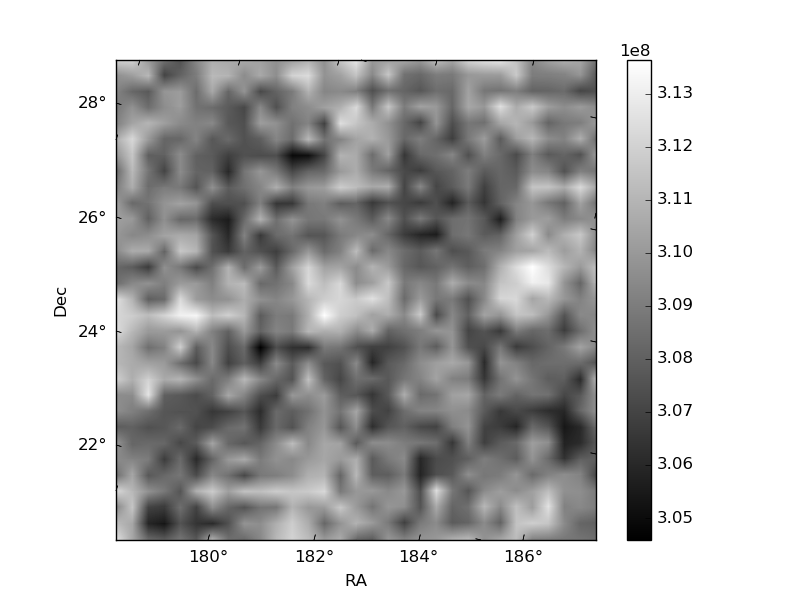
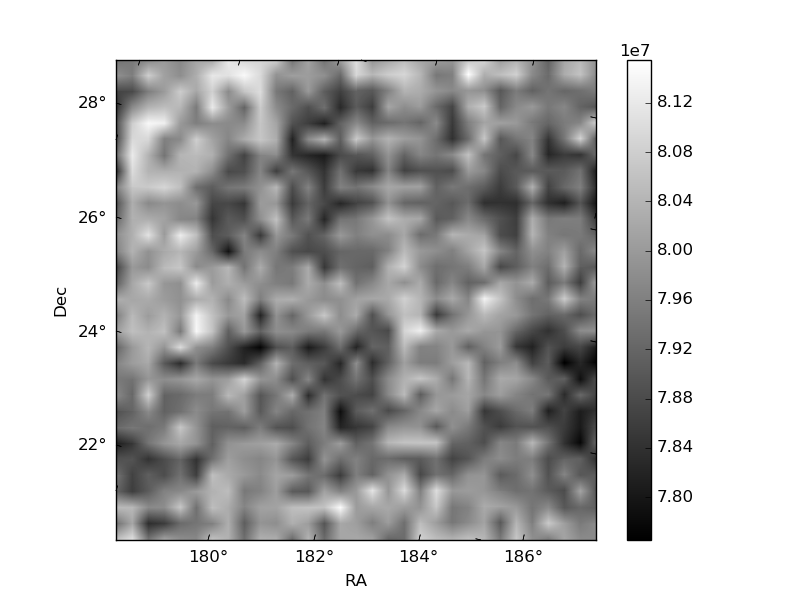
Histogram calculated using DETX and DETY for each event in the final _common_clean file
| Quadrant A | 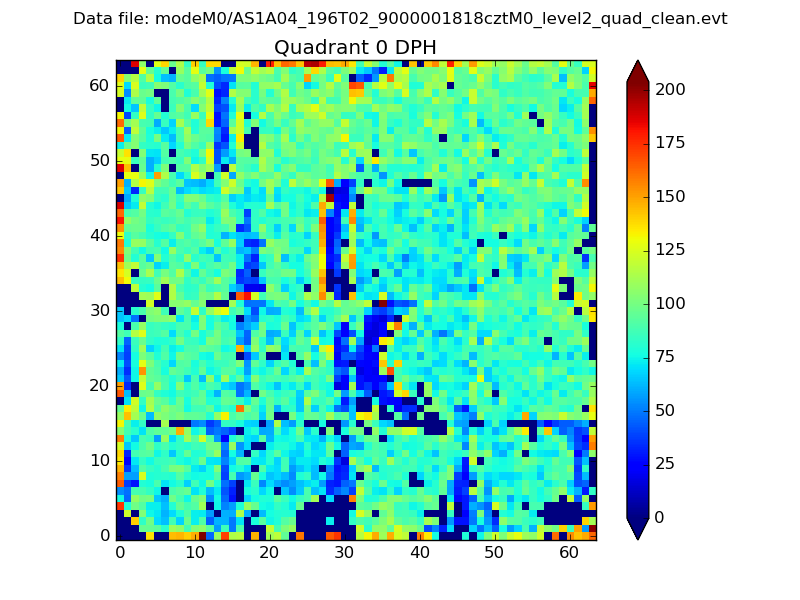 |
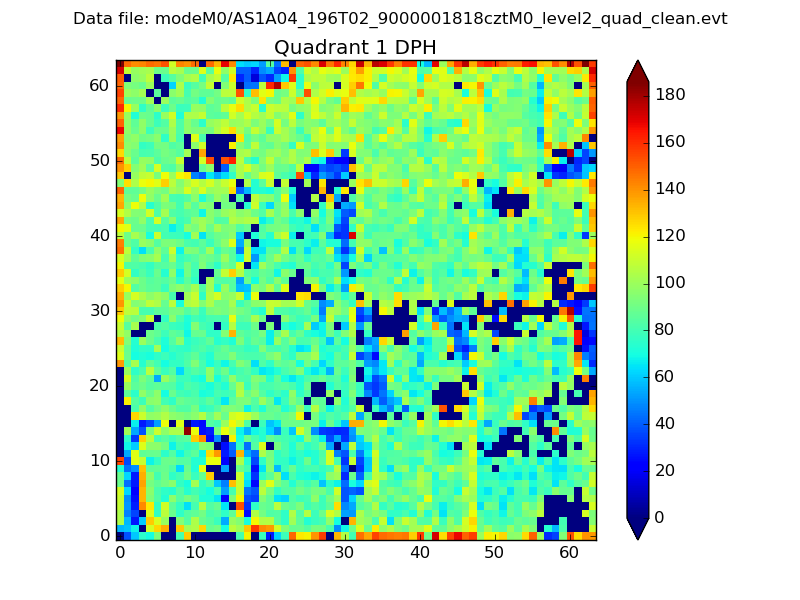 |
Quadrant B |
|---|---|---|---|
| Quadrant D | 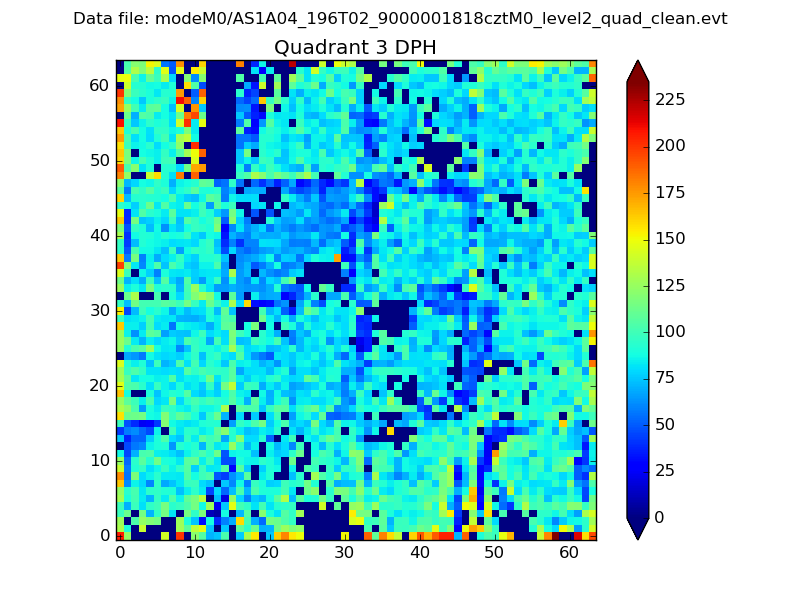 |
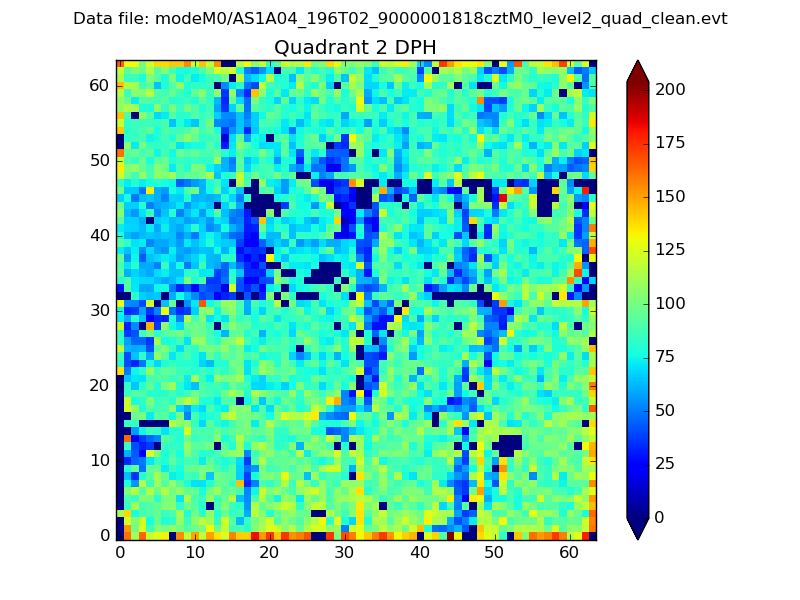 |
Quadrant C |
| Plot type | Count rate plots | Images |
|---|---|---|
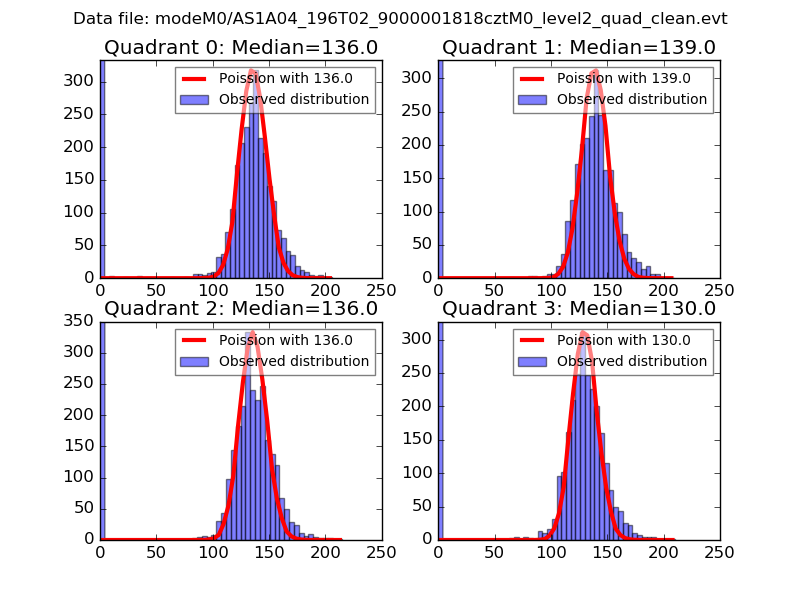
| Comparison with Poisson distribution Blue bars denote a histogram of data divided into 1 sec bins. Red curve is a Poisson curve with rate = median count rate of data. |
 |
 |
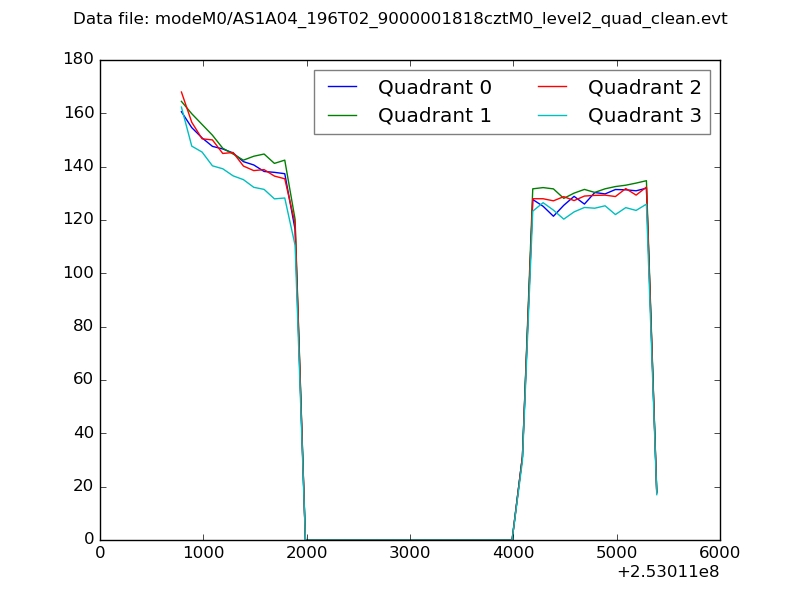
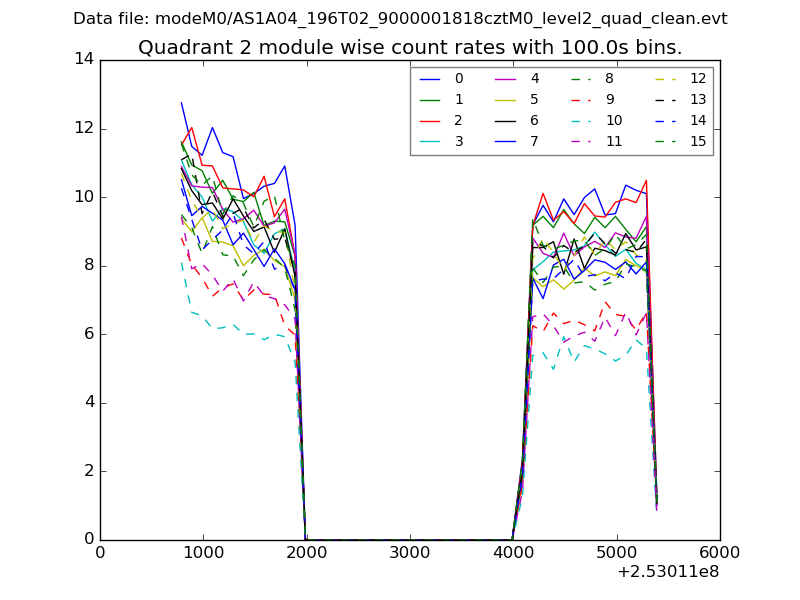
| Quadrant-wise count rates Data is divided into 100 sec bins |
 |
|
| Module-wise count rates for Quadrant A Data is divided into 100 sec bins |
 |
 |
| Module-wise count rates for Quadrant B Data is divided into 100 sec bins |
 |
 |
| Module-wise count rates for Quadrant C Data is divided into 100 sec bins |
 |
 |
| Module-wise count rates for Quadrant D Data is divided into 100 sec bins |
 |
 |
| Parameter | Plot |
|---|---|
| CZT HV Monitor | 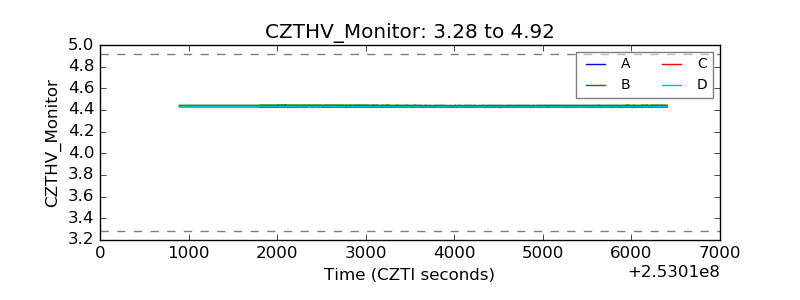 |
| D_VDD | 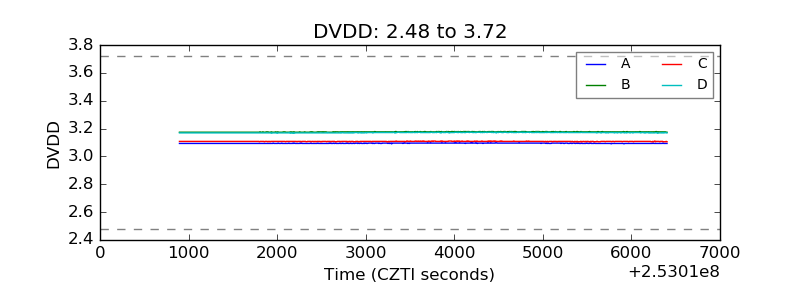 |
| Temperature 1 |  |
| Veto HV Monitor |  |
| Veto LLD | 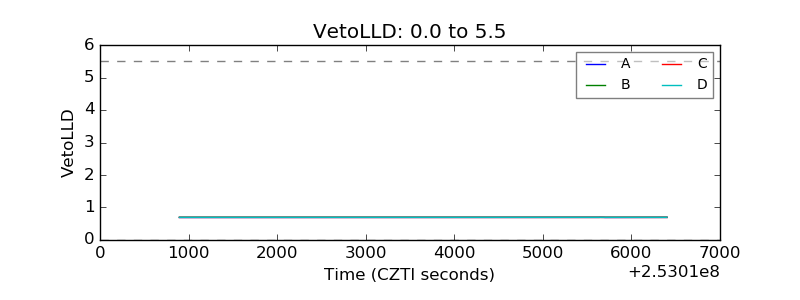 |
| Alpha Counter | 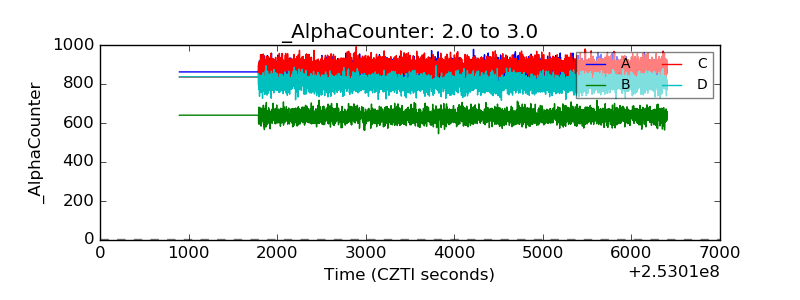 |
| _CPM_Rate | 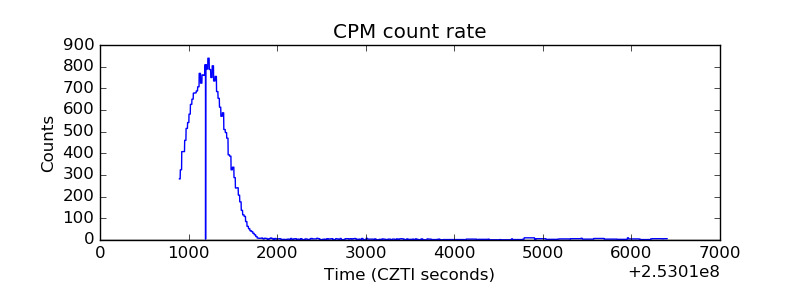 |
| CZT Counter | 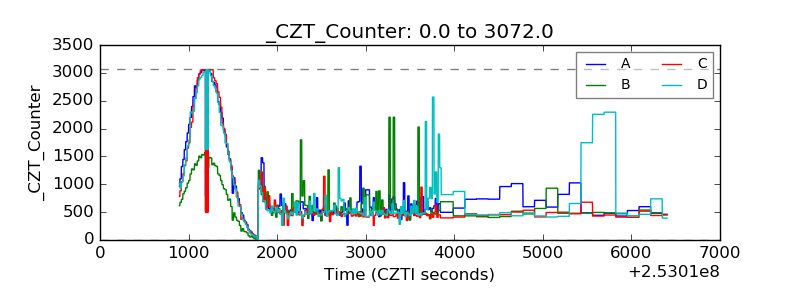 |
| +2.5 Volts monitor |  |
| +5 Volts monitor |  |
| _ROLL_ROT | 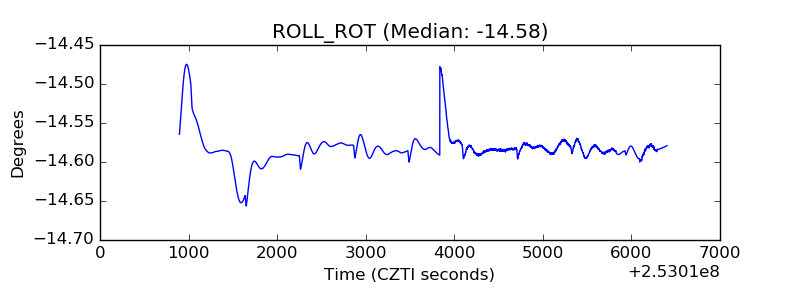 |
| _Roll_DEC | 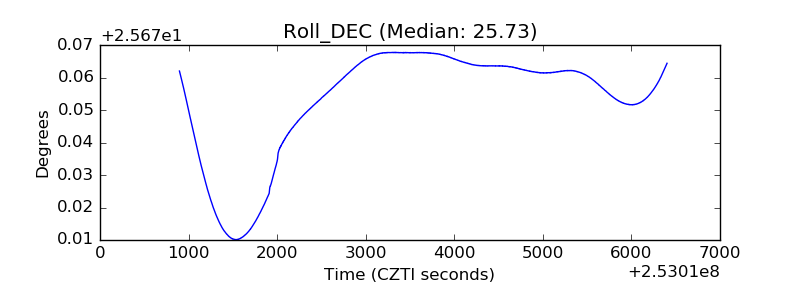 |
| _Roll_RA |  |
| Veto Counter | 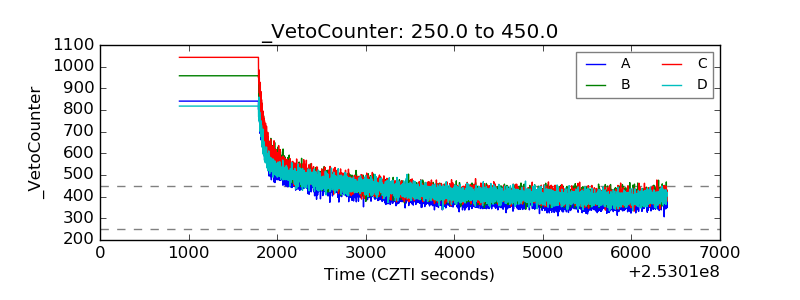 |