| Param | Original file | Final file |
|---|---|---|
| Filename | modeM0/AS1A04_130T01_9000001822cztM0_level2_bc.evt | modeM0/AS1A04_130T01_9000001822cztM0_level2_quad_clean.evt |
| Size (bytes) | 2,156,762,880 | 640,483,200 |
| Size | 2.0 GB | 610.8 MB |
| Events in quadrant A | 16,858,813 | 3,967,909 |
| Events in quadrant B | 14,857,788 | 3,936,467 |
| Events in quadrant C | 12,413,505 | 3,975,254 |
| Events in quadrant D | 17,510,206 | 3,815,907 |
| Mode SS | |||
|---|---|---|---|
| Quadrant | BADHDUFLAG | Total packets | Discarded packets |
| A | 0 | 1094 | 0 |
| B | 0 | 1094 | 0 |
| C | 0 | 1094 | 0 |
| D | 0 | 1094 | 0 |
| Mode M0 | |||
|---|---|---|---|
| Quadrant | BADHDUFLAG | Total packets | Discarded packets |
| A | 0 | 139620 | 0 |
| B | 0 | 127998 | 0 |
| C | 0 | 117469 | 0 |
| D | 0 | 134362 | 0 |
| Mode M9 | |||
|---|---|---|---|
| Quadrant | BADHDUFLAG | Total packets | Discarded packets |
| A | 0 | 74 | 0 |
| B | 0 | 74 | 0 |
| C | 0 | 74 | 0 |
| D | 0 | 74 | 0 |
| Quadrant | Total seconds | Saturated seconds | Saturation percentage |
|---|---|---|---|
| A | 53982 | 1181 | 2.187766% |
| B | 53982 | 1944 | 3.601200% |
| C | 53982 | 736 | 1.363417% |
| D | 53982 | 1787 | 3.310363% |
Noise dominated data is calculated using 1-second bins in cleaned event files. If a bin has >2000 counts, and if more than 50% of those come from <1% of pixels, then it is considered to be noise-dominated and hence unusable.
| Quadrant | # 1 sec bins | Bins with >0 counts | Bins with >2000 counts | High rate bins dominated by noise | Noise dominated (total time) | Noise dominated (detector-on time) | Marked lightcurve |
|---|---|---|---|---|---|---|---|
| A | 60937 | 53984 | 6 | 6 | 0.01% | 0.01% |  |
| B | 60937 | 53982 | 57 | 57 | 0.09% | 0.11% |  |
| C | 60938 | 53983 | 21 | 21 | 0.03% | 0.04% | 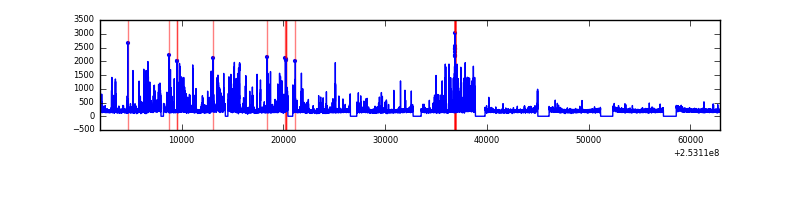 |
| D | 60938 | 53982 | 389 | 389 | 0.64% | 0.72% |  |
Top three noisy pixels from each quadrant. If the there are fewer than three noisy pixels in the level2.evt file, extra rows are filled as -1
| Pixel properties | Quadrant properties | ||||||
|---|---|---|---|---|---|---|---|
| Quadrant | DetID | PixID | Counts | Sigma | Mean | Median | Sigma |
| A | 8 | 15 | 3492430 | 5936.32 | 2716 | 2663 | 587.9 |
| A | 13 | 251 | 1480778 | 2514.37 | 2716 | 2663 | 587.9 |
| A | 1 | 162 | 760718 | 1289.5 | 2716 | 2663 | 587.9 |
| B | 0 | 85 | 1853876 | 3611.78 | 2711 | 2638 | 512.6 |
| B | 4 | 239 | 1113565 | 2167.43 | 2711 | 2638 | 512.6 |
| B | 3 | 64 | 334764 | 647.98 | 2711 | 2638 | 512.6 |
| C | 4 | 254 | 1700645 | 2876.97 | 2671 | 2634 | 590.2 |
| C | 15 | 208 | 186504 | 311.53 | 2671 | 2634 | 590.2 |
| C | 4 | 112 | 26533 | 40.49 | 2671 | 2634 | 590.2 |
| D | 1 | 52 | 4472372 | 7167.38 | 2685 | 2587 | 623.6 |
| D | 14 | 34 | 862044 | 1378.15 | 2685 | 2587 | 623.6 |
| D | 10 | 253 | 289308 | 459.76 | 2685 | 2587 | 623.6 |
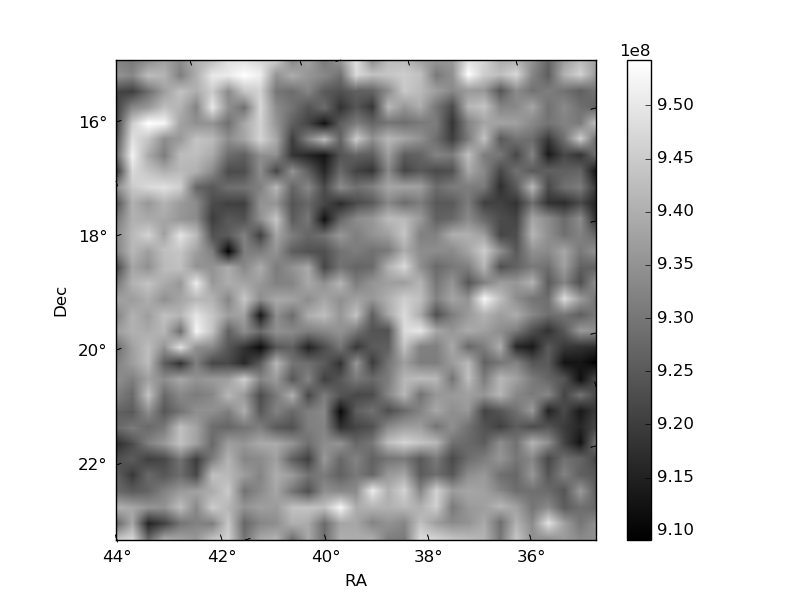
Histogram calculated using DETX and DETY for each event in the final _common_clean file
| Quadrant A | 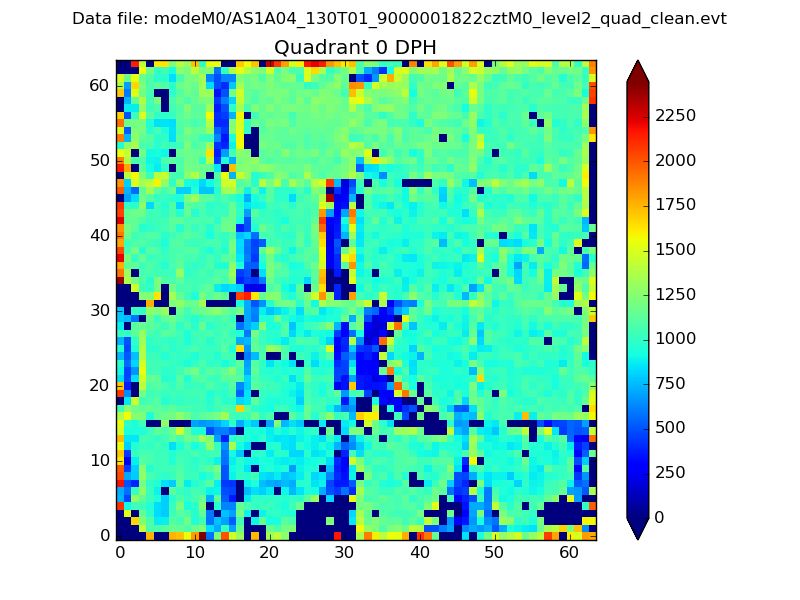 |
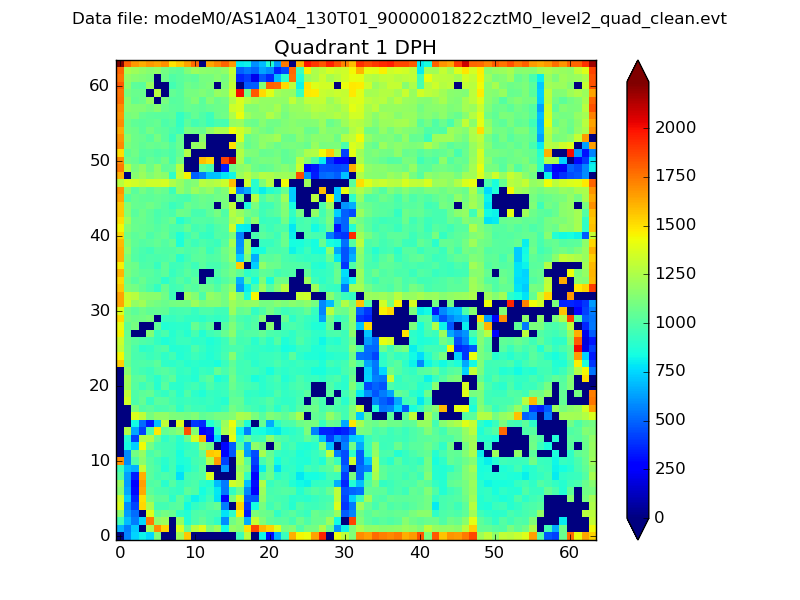 |
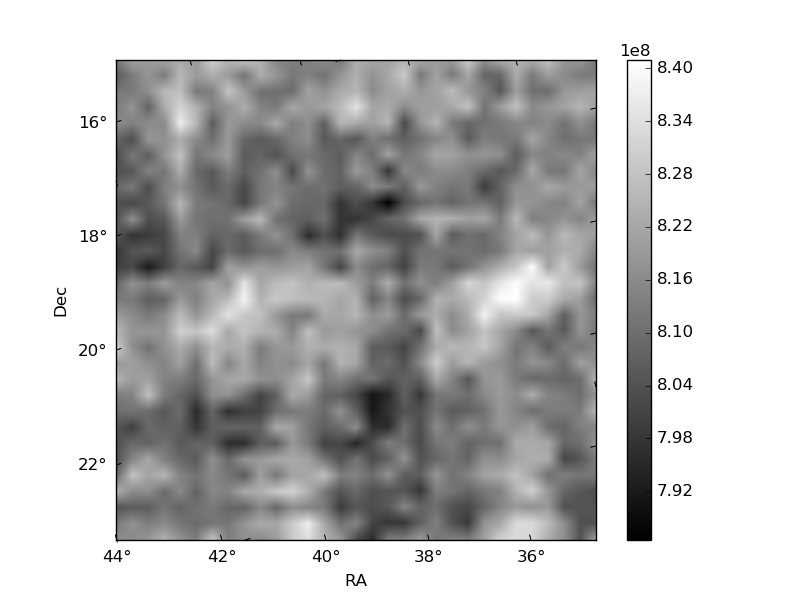
Quadrant B |
|---|---|---|---|
| Quadrant D |  |
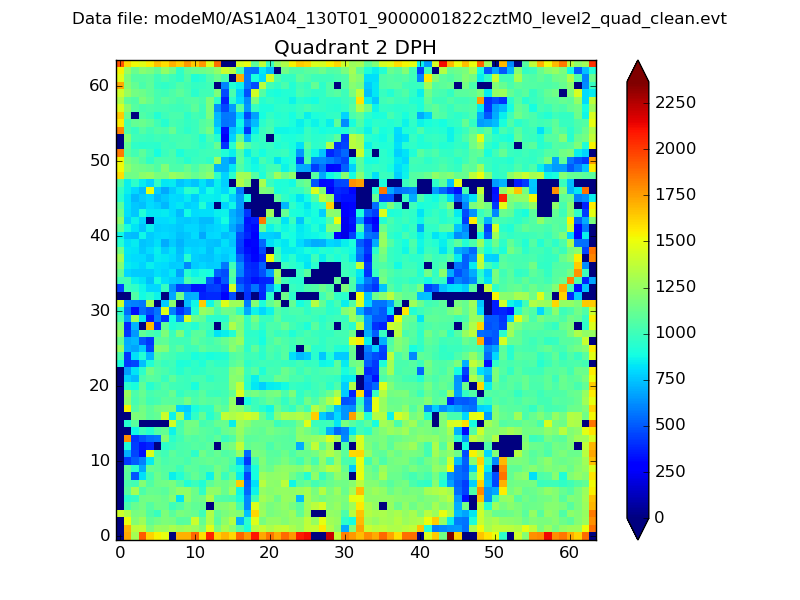 |
Quadrant C |
| Plot type | Count rate plots | Images |
|---|---|---|
| Comparison with Poisson distribution Blue bars denote a histogram of data divided into 1 sec bins. Red curve is a Poisson curve with rate = median count rate of data. |
 |
 |
| Quadrant-wise count rates Data is divided into 100 sec bins |
 |
|
| Module-wise count rates for Quadrant A Data is divided into 100 sec bins |
 |
 |
| Module-wise count rates for Quadrant B Data is divided into 100 sec bins |
 |
 |
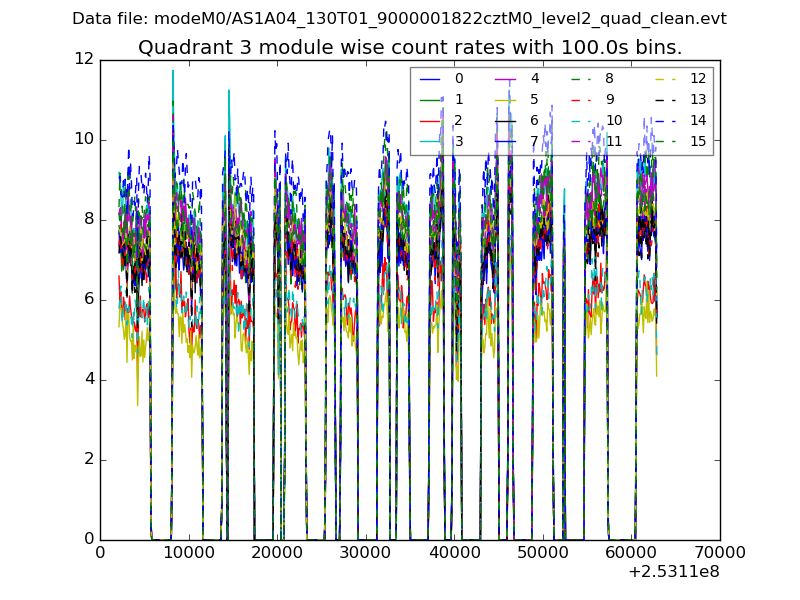
| Module-wise count rates for Quadrant C Data is divided into 100 sec bins |
 |
 |
| Module-wise count rates for Quadrant D Data is divided into 100 sec bins |
 |
 |
| Parameter | Plot |
|---|---|
| CZT HV Monitor | 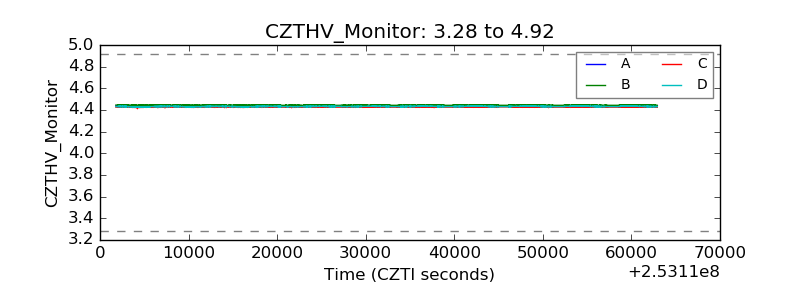 |
| D_VDD | 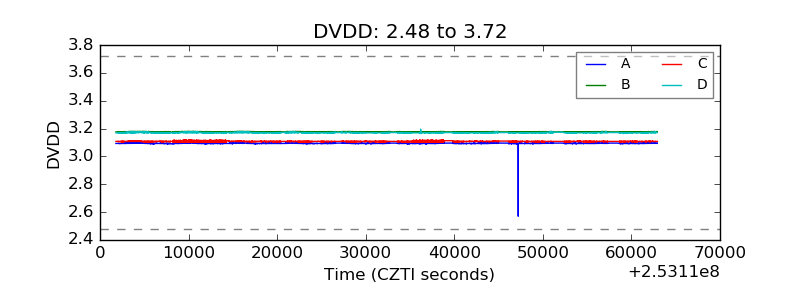 |
| Temperature 1 |  |
| Veto HV Monitor | 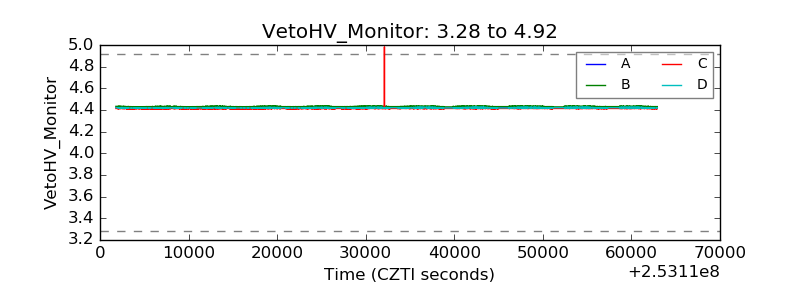 |
| Veto LLD |  |
| Alpha Counter |  |
| _CPM_Rate |  |
| CZT Counter |  |
| +2.5 Volts monitor |  |
| +5 Volts monitor | 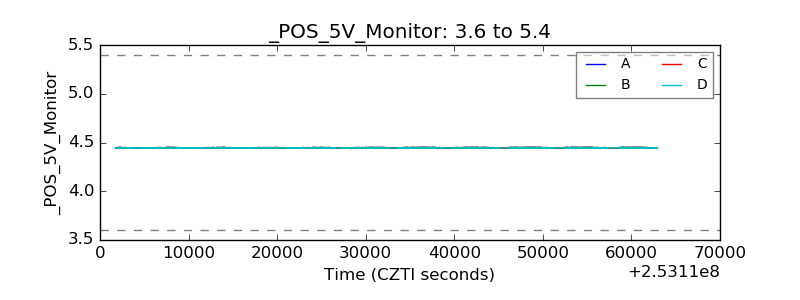 |
| _ROLL_ROT | 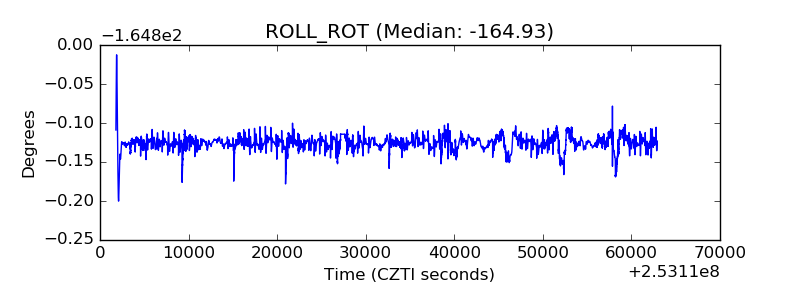 |
| _Roll_DEC |  |
| _Roll_RA | 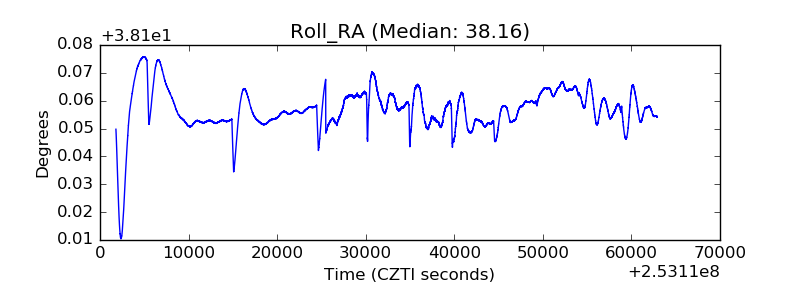 |
| Veto Counter | 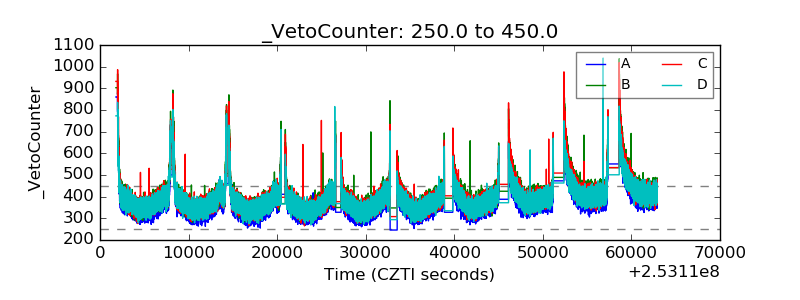 |