| Param | Original file | Final file |
|---|---|---|
| Filename | modeM0/AS1A04_210T03_9000001830cztM0_level2_bc.evt | modeM0/AS1A04_210T03_9000001830cztM0_level2_quad_clean.evt |
| Size (bytes) | 805,993,920 | 223,922,880 |
| Size | 768.7 MB | 213.5 MB |
| Events in quadrant A | 7,000,156 | 1,357,227 |
| Events in quadrant B | 4,853,679 | 1,405,911 |
| Events in quadrant C | 4,095,206 | 1,387,112 |
| Events in quadrant D | 7,131,873 | 1,292,799 |
| Mode M0 | |||
|---|---|---|---|
| Quadrant | BADHDUFLAG | Total packets | Discarded packets |
| A | 0 | 54327 | 0 |
| B | 0 | 43559 | 0 |
| C | 0 | 40832 | 0 |
| D | 0 | 50702 | 0 |
| Mode M9 | |||
|---|---|---|---|
| Quadrant | BADHDUFLAG | Total packets | Discarded packets |
| A | 0 | 39 | 0 |
| B | 0 | 39 | 0 |
| C | 0 | 39 | 0 |
| D | 0 | 39 | 0 |
| Mode SS | |||
|---|---|---|---|
| Quadrant | BADHDUFLAG | Total packets | Discarded packets |
| A | 0 | 394 | 0 |
| B | 0 | 394 | 0 |
| C | 0 | 394 | 0 |
| D | 0 | 394 | 0 |
| Quadrant | Total seconds | Saturated seconds | Saturation percentage |
|---|---|---|---|
| A | 19439 | 459 | 2.361233% |
| B | 19439 | 271 | 1.394105% |
| C | 19439 | 118 | 0.607027% |
| D | 19439 | 773 | 3.976542% |
Noise dominated data is calculated using 1-second bins in cleaned event files. If a bin has >2000 counts, and if more than 50% of those come from <1% of pixels, then it is considered to be noise-dominated and hence unusable.
| Quadrant | # 1 sec bins | Bins with >0 counts | Bins with >2000 counts | High rate bins dominated by noise | Noise dominated (total time) | Noise dominated (detector-on time) | Marked lightcurve |
|---|---|---|---|---|---|---|---|
| A | 23245 | 19440 | 0 | 0 | 0.00% | 0.00% |  |
| B | 23245 | 19440 | 1 | 1 | 0.00% | 0.01% | 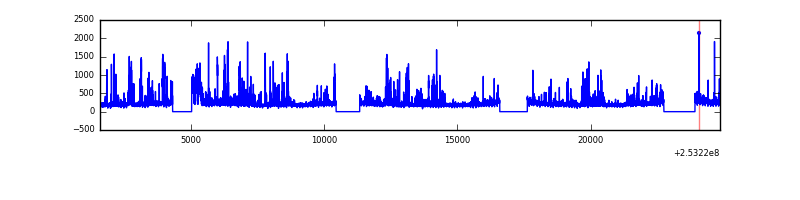 |
| C | 23245 | 19440 | 8 | 8 | 0.03% | 0.04% |  |
| D | 23245 | 19440 | 347 | 347 | 1.49% | 1.78% | 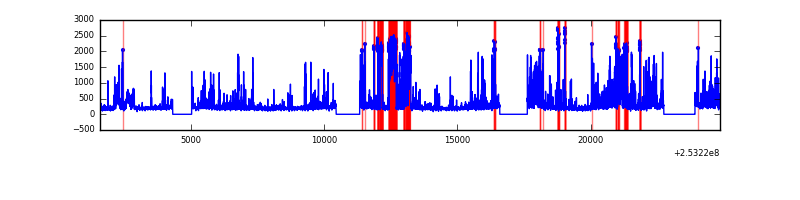 |
Top three noisy pixels from each quadrant. If the there are fewer than three noisy pixels in the level2.evt file, extra rows are filled as -1
| Pixel properties | Quadrant properties | ||||||
|---|---|---|---|---|---|---|---|
| Quadrant | DetID | PixID | Counts | Sigma | Mean | Median | Sigma |
| A | 8 | 15 | 1758051 | 8409.4 | 945 | 923 | 208.9 |
| A | 13 | 251 | 1119278 | 5352.31 | 945 | 923 | 208.9 |
| A | 1 | 162 | 371014 | 1771.21 | 945 | 923 | 208.9 |
| B | 4 | 239 | 479372 | 2556.5 | 968 | 939 | 187.1 |
| B | 0 | 85 | 313193 | 1668.53 | 968 | 939 | 187.1 |
| B | 0 | 230 | 74327 | 392.15 | 968 | 939 | 187.1 |
| C | 15 | 208 | 374381 | 1765.73 | 947 | 933 | 211.5 |
| C | 14 | 234 | 7482 | 30.96 | 947 | 933 | 211.5 |
| C | 8 | 222 | 6255 | 25.16 | 947 | 933 | 211.5 |
| D | 1 | 52 | 2614571 | 11952.44 | 936 | 902 | 218.7 |
| D | 5 | 222 | 339280 | 1547.42 | 936 | 902 | 218.7 |
| D | 13 | 104 | 190182 | 865.59 | 936 | 902 | 218.7 |
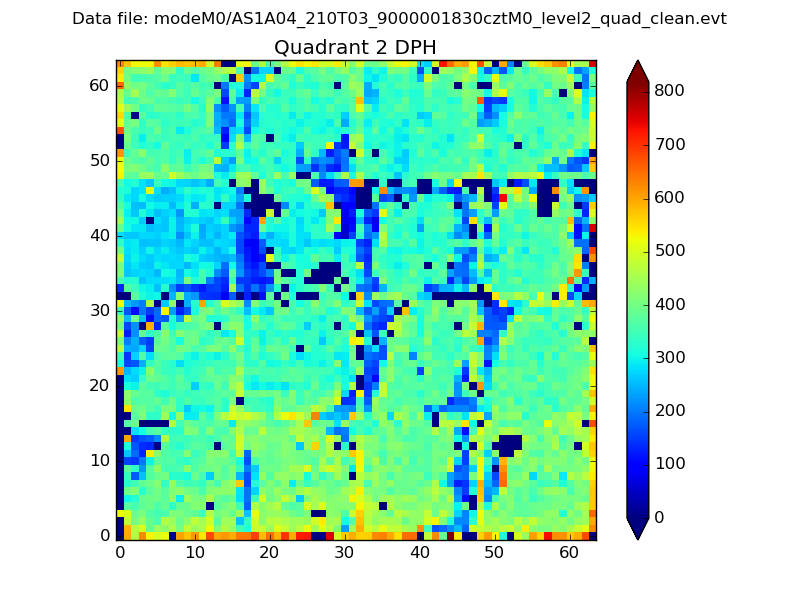
Histogram calculated using DETX and DETY for each event in the final _common_clean file
| Quadrant A | 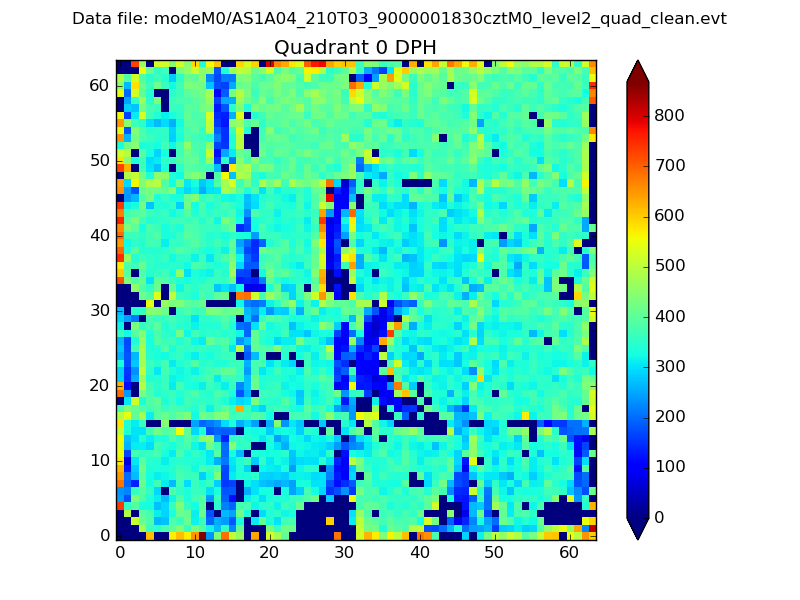 |
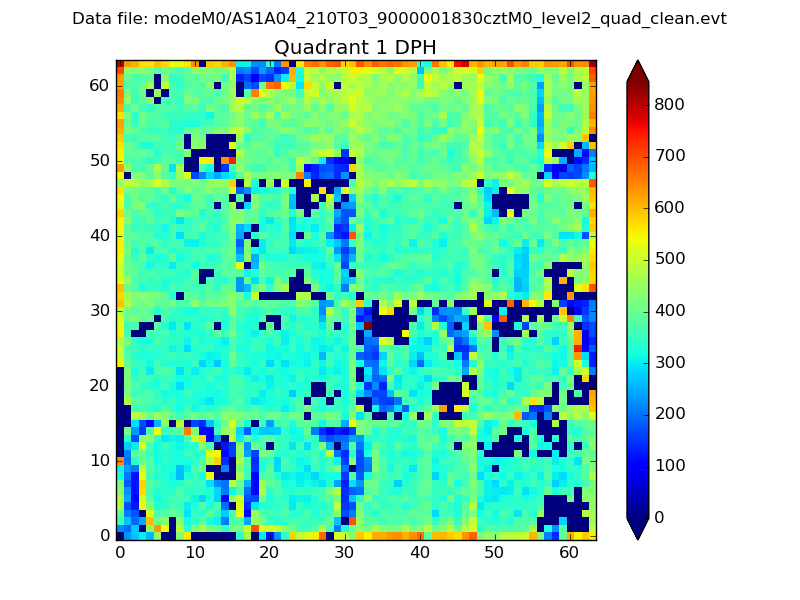 |
Quadrant B |
|---|---|---|---|
| Quadrant D |  |
 |
Quadrant C |
| Plot type | Count rate plots | Images |
|---|---|---|
| Comparison with Poisson distribution Blue bars denote a histogram of data divided into 1 sec bins. Red curve is a Poisson curve with rate = median count rate of data. |
 |
 |
| Quadrant-wise count rates Data is divided into 100 sec bins |
 |
|
| Module-wise count rates for Quadrant A Data is divided into 100 sec bins |
 |
 |
| Module-wise count rates for Quadrant B Data is divided into 100 sec bins |
 |
 |
| Module-wise count rates for Quadrant C Data is divided into 100 sec bins |
 |
 |
| Module-wise count rates for Quadrant D Data is divided into 100 sec bins |
 |
 |
| Parameter | Plot |
|---|---|
| CZT HV Monitor |  |
| D_VDD |  |
| Temperature 1 |  |
| Veto HV Monitor |  |
| Veto LLD |  |
| Alpha Counter |  |
| _CPM_Rate |  |
| CZT Counter |  |
| +2.5 Volts monitor | 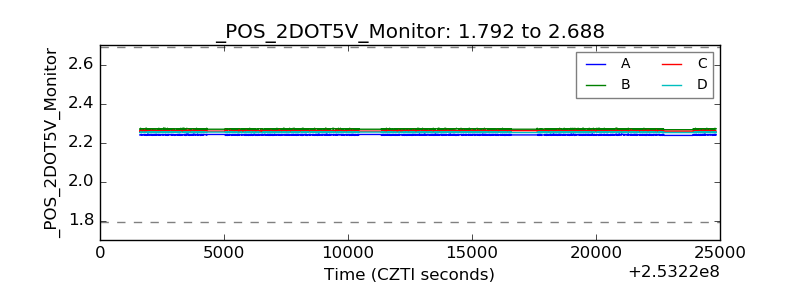 |
| +5 Volts monitor |  |
| _ROLL_ROT |  |
| _Roll_DEC |  |
| _Roll_RA | 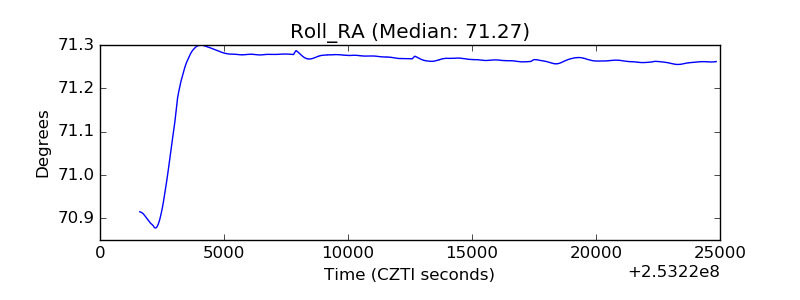 |
| Veto Counter |  |