| Param | Original file | Final file |
|---|---|---|
| Filename | modeM0/AS1A04_210T04_9000001828cztM0_level2_bc.evt | modeM0/AS1A04_210T04_9000001828cztM0_level2_quad_clean.evt |
| Size (bytes) | 453,772,800 | 138,335,040 |
| Size | 432.8 MB | 131.9 MB |
| Events in quadrant A | 3,418,725 | 843,959 |
| Events in quadrant B | 2,857,378 | 860,865 |
| Events in quadrant C | 2,312,983 | 862,191 |
| Events in quadrant D | 4,359,159 | 822,480 |
| Mode SS | |||
|---|---|---|---|
| Quadrant | BADHDUFLAG | Total packets | Discarded packets |
| A | 0 | 236 | 0 |
| B | 0 | 236 | 0 |
| C | 0 | 236 | 0 |
| D | 0 | 236 | 0 |
| Mode M0 | |||
|---|---|---|---|
| Quadrant | BADHDUFLAG | Total packets | Discarded packets |
| A | 0 | 29890 | 0 |
| B | 0 | 26090 | 0 |
| C | 0 | 24094 | 0 |
| D | 0 | 30343 | 0 |
| Mode M9 | |||
|---|---|---|---|
| Quadrant | BADHDUFLAG | Total packets | Discarded packets |
| A | 0 | 9 | 0 |
| B | 0 | 9 | 0 |
| C | 0 | 9 | 0 |
| D | 0 | 9 | 0 |
| Quadrant | Total seconds | Saturated seconds | Saturation percentage |
|---|---|---|---|
| A | 11557 | 316 | 2.734274% |
| B | 11557 | 263 | 2.275677% |
| C | 11557 | 73 | 0.631652% |
| D | 11557 | 305 | 2.639093% |
Noise dominated data is calculated using 1-second bins in cleaned event files. If a bin has >2000 counts, and if more than 50% of those come from <1% of pixels, then it is considered to be noise-dominated and hence unusable.
| Quadrant | # 1 sec bins | Bins with >0 counts | Bins with >2000 counts | High rate bins dominated by noise | Noise dominated (total time) | Noise dominated (detector-on time) | Marked lightcurve |
|---|---|---|---|---|---|---|---|
| A | 12478 | 11558 | 13 | 13 | 0.10% | 0.11% |  |
| B | 12478 | 11558 | 1 | 1 | 0.01% | 0.01% |  |
| C | 12478 | 11558 | 4 | 4 | 0.03% | 0.03% |  |
| D | 12478 | 11558 | 41 | 41 | 0.33% | 0.35% |  |
Top three noisy pixels from each quadrant. If the there are fewer than three noisy pixels in the level2.evt file, extra rows are filled as -1
| Pixel properties | Quadrant properties | ||||||
|---|---|---|---|---|---|---|---|
| Quadrant | DetID | PixID | Counts | Sigma | Mean | Median | Sigma |
| A | 13 | 251 | 549295 | 4437.63 | 550 | 537 | 123.7 |
| A | 8 | 15 | 414330 | 3346.21 | 550 | 537 | 123.7 |
| A | 1 | 162 | 240452 | 1940.12 | 550 | 537 | 123.7 |
| B | 4 | 239 | 253900 | 2306.47 | 558 | 540 | 109.8 |
| B | 10 | 245 | 242103 | 2199.07 | 558 | 540 | 109.8 |
| B | 0 | 85 | 47965 | 431.73 | 558 | 540 | 109.8 |
| C | 15 | 208 | 157097 | 1258.59 | 549 | 540 | 124.4 |
| C | 8 | 222 | 5193 | 37.41 | 549 | 540 | 124.4 |
| C | 13 | 61 | 3290 | 22.11 | 549 | 540 | 124.4 |
| D | 1 | 52 | 1520398 | 11527.27 | 549 | 527 | 131.9 |
| D | 10 | 253 | 185697 | 1404.4 | 549 | 527 | 131.9 |
| D | 13 | 104 | 168989 | 1277.68 | 549 | 527 | 131.9 |
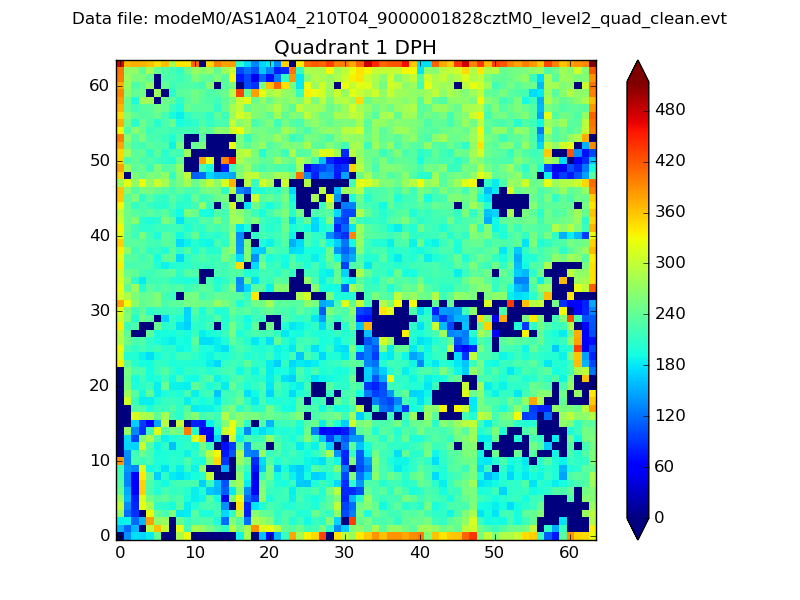
Histogram calculated using DETX and DETY for each event in the final _common_clean file
| Quadrant A |  |
 |
Quadrant B |
|---|---|---|---|
| Quadrant D | 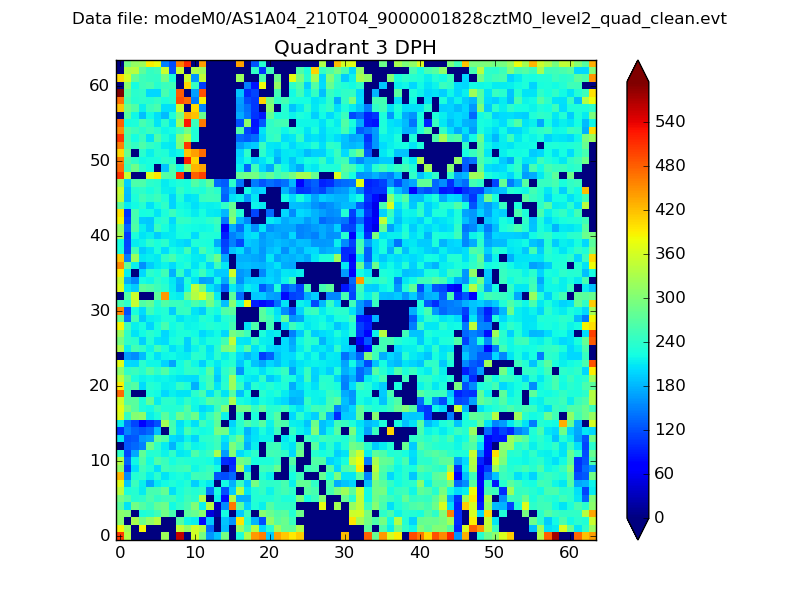 |
 |
Quadrant C |
| Plot type | Count rate plots | Images |
|---|---|---|
| Comparison with Poisson distribution Blue bars denote a histogram of data divided into 1 sec bins. Red curve is a Poisson curve with rate = median count rate of data. |
 |
 |
| Quadrant-wise count rates Data is divided into 100 sec bins |
 |
|
| Module-wise count rates for Quadrant A Data is divided into 100 sec bins |
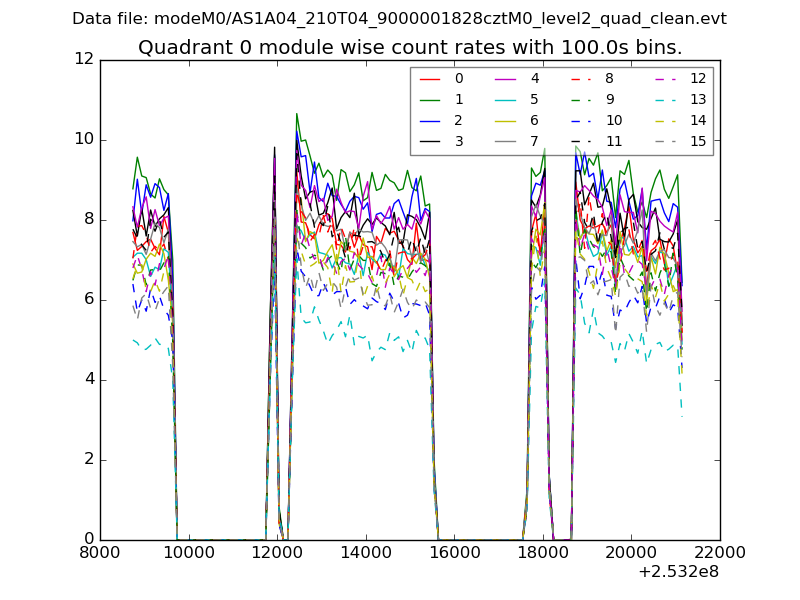 |
 |
| Module-wise count rates for Quadrant B Data is divided into 100 sec bins |
 |
 |
| Module-wise count rates for Quadrant C Data is divided into 100 sec bins |
 |
 |
| Module-wise count rates for Quadrant D Data is divided into 100 sec bins |
 |
 |
| Parameter | Plot |
|---|---|
| CZT HV Monitor |  |
| D_VDD | 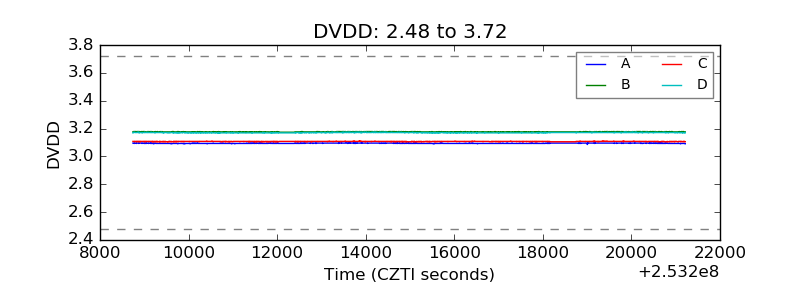 |
| Temperature 1 |  |
| Veto HV Monitor |  |
| Veto LLD | 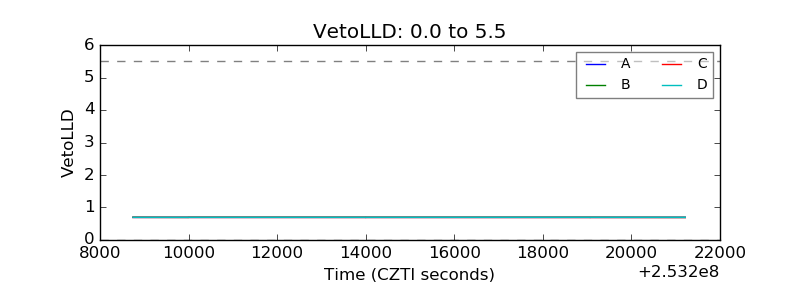 |
| Alpha Counter |  |
| _CPM_Rate | 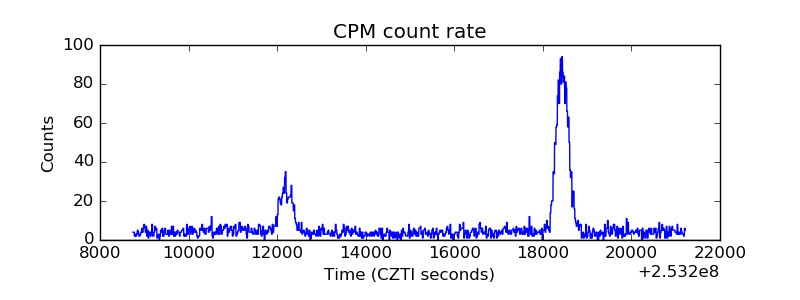 |
| CZT Counter |  |
| +2.5 Volts monitor |  |
| +5 Volts monitor |  |
| _ROLL_ROT |  |
| _Roll_DEC |  |
| _Roll_RA | 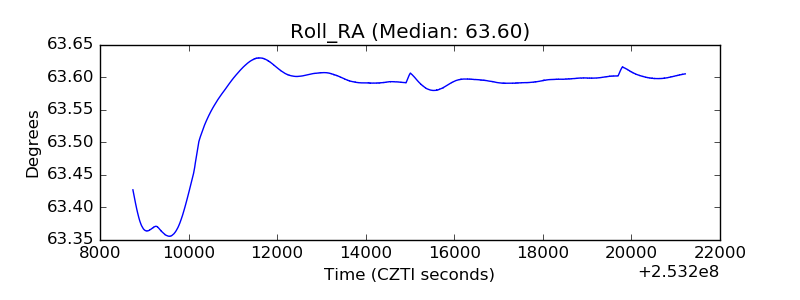 |
| Veto Counter | 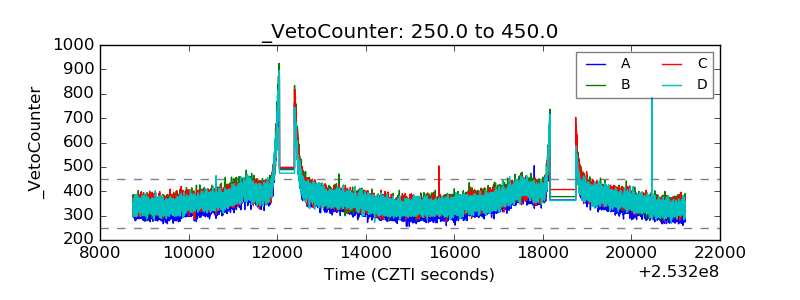 |