| Param | Original file | Final file |
|---|---|---|
| Filename | modeM0/AS1G08_083T02_9000001840cztM0_level2_bc.evt | modeM0/AS1G08_083T02_9000001840cztM0_level2_quad_clean.evt |
| Size (bytes) | 2,173,688,640 | 655,352,640 |
| Size | 2.0 GB | 625.0 MB |
| Events in quadrant A | 19,427,057 | 4,032,561 |
| Events in quadrant B | 14,803,759 | 4,155,911 |
| Events in quadrant C | 10,629,202 | 4,103,092 |
| Events in quadrant D | 17,310,982 | 3,873,208 |
| Mode M0 | |||
|---|---|---|---|
| Quadrant | BADHDUFLAG | Total packets | Discarded packets |
| A | 0 | 153101 | 0 |
| B | 0 | 127275 | 0 |
| C | 0 | 109932 | 0 |
| D | 0 | 131658 | 0 |
| Mode M9 | |||
|---|---|---|---|
| Quadrant | BADHDUFLAG | Total packets | Discarded packets |
| A | 0 | 102 | 0 |
| B | 0 | 102 | 0 |
| C | 0 | 102 | 0 |
| D | 0 | 102 | 0 |
| Mode SS | |||
|---|---|---|---|
| Quadrant | BADHDUFLAG | Total packets | Discarded packets |
| A | 0 | 1092 | 0 |
| B | 0 | 1092 | 0 |
| C | 0 | 1092 | 0 |
| D | 0 | 1092 | 0 |
| Quadrant | Total seconds | Saturated seconds | Saturation percentage |
|---|---|---|---|
| A | 53705 | 2188 | 4.074109% |
| B | 53705 | 1879 | 3.498743% |
| C | 53705 | 365 | 0.679639% |
| D | 53705 | 1702 | 3.169165% |
Noise dominated data is calculated using 1-second bins in cleaned event files. If a bin has >2000 counts, and if more than 50% of those come from <1% of pixels, then it is considered to be noise-dominated and hence unusable.
| Quadrant | # 1 sec bins | Bins with >0 counts | Bins with >2000 counts | High rate bins dominated by noise | Noise dominated (total time) | Noise dominated (detector-on time) | Marked lightcurve |
|---|---|---|---|---|---|---|---|
| A | 63941 | 53700 | 4 | 4 | 0.01% | 0.01% |  |
| B | 63941 | 53700 | 8 | 8 | 0.01% | 0.01% |  |
| C | 63941 | 53702 | 0 | 0 | 0.00% | 0.00% |  |
| D | 63941 | 53701 | 542 | 542 | 0.85% | 1.01% |  |
Top three noisy pixels from each quadrant. If the there are fewer than three noisy pixels in the level2.evt file, extra rows are filled as -1
| Pixel properties | Quadrant properties | ||||||
|---|---|---|---|---|---|---|---|
| Quadrant | DetID | PixID | Counts | Sigma | Mean | Median | Sigma |
| A | 8 | 15 | 2913446 | 4972.63 | 2703 | 2648 | 585.4 |
| A | 13 | 251 | 2756550 | 4704.6 | 2703 | 2648 | 585.4 |
| A | 14 | 237 | 1192832 | 2033.24 | 2703 | 2648 | 585.4 |
| B | 4 | 239 | 2958751 | 5698.68 | 2748 | 2677 | 518.7 |
| B | 0 | 219 | 275440 | 525.83 | 2748 | 2677 | 518.7 |
| B | 3 | 209 | 191436 | 363.89 | 2748 | 2677 | 518.7 |
| C | 15 | 208 | 82486 | 136.08 | 2685 | 2641 | 586.7 |
| C | 8 | 112 | 16390 | 23.43 | 2685 | 2641 | 586.7 |
| C | 13 | 61 | 16275 | 23.24 | 2685 | 2641 | 586.7 |
| D | 1 | 52 | 3984145 | 6467.06 | 2669 | 2569 | 615.7 |
| D | 10 | 199 | 864839 | 1400.54 | 2669 | 2569 | 615.7 |
| D | 10 | 50 | 671139 | 1085.92 | 2669 | 2569 | 615.7 |
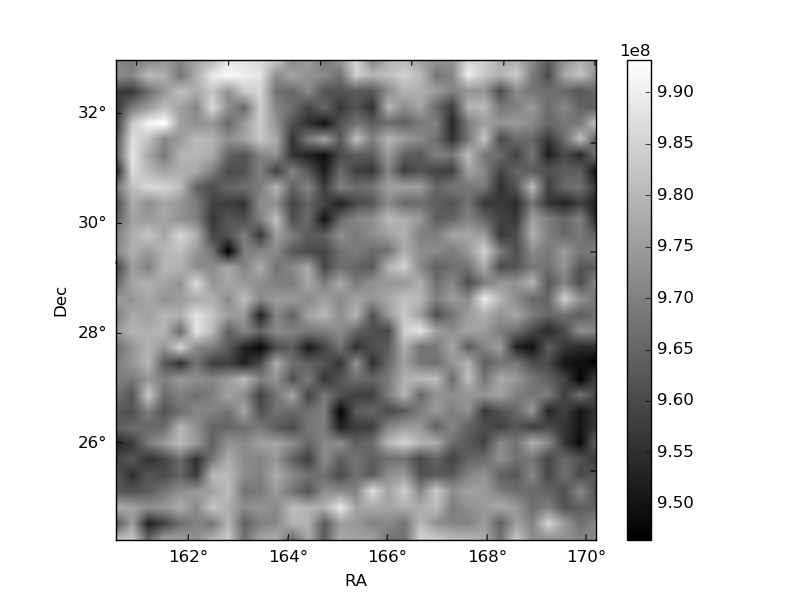
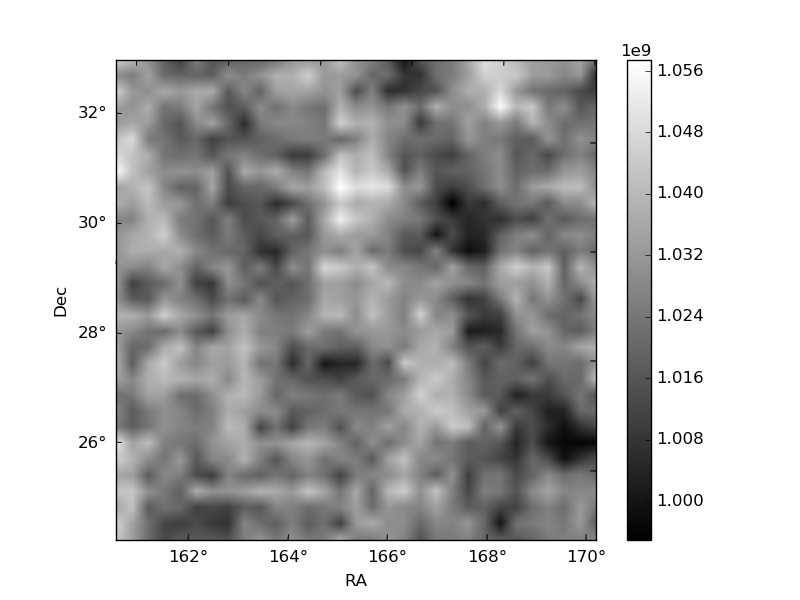
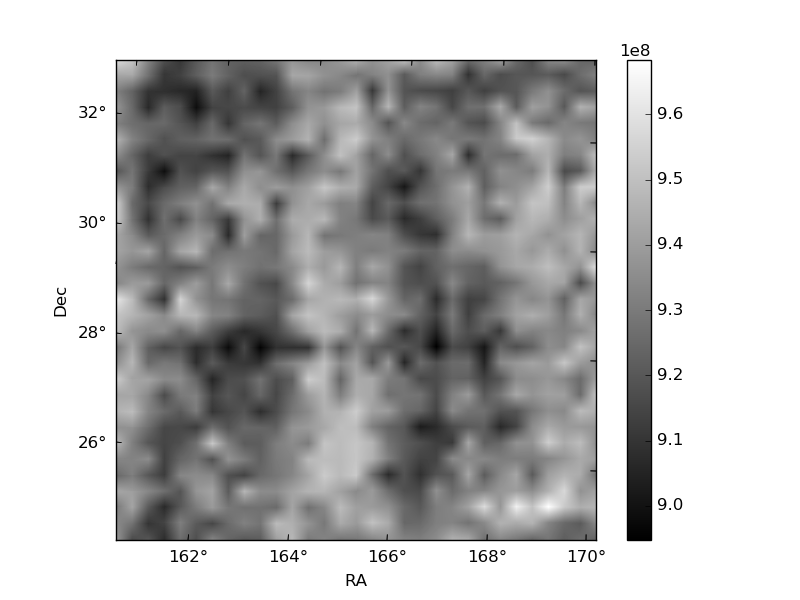
Histogram calculated using DETX and DETY for each event in the final _common_clean file
| Quadrant A | 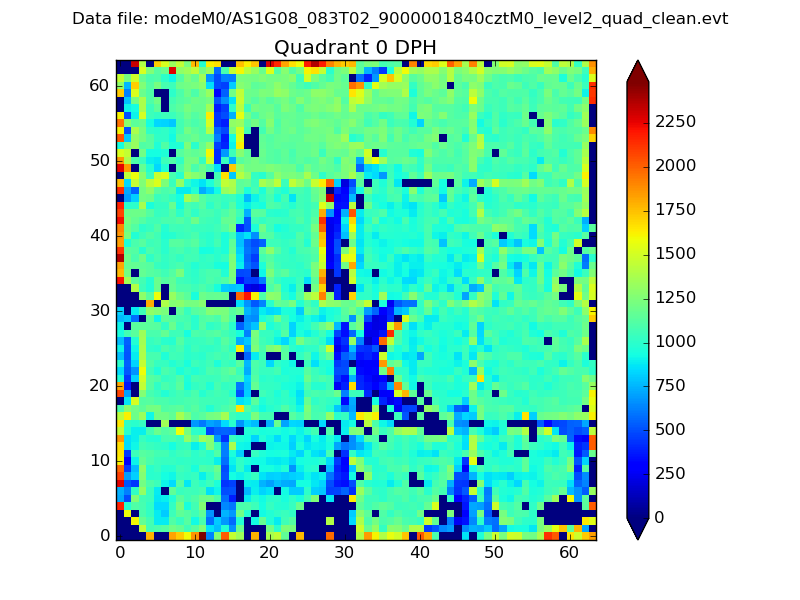 |
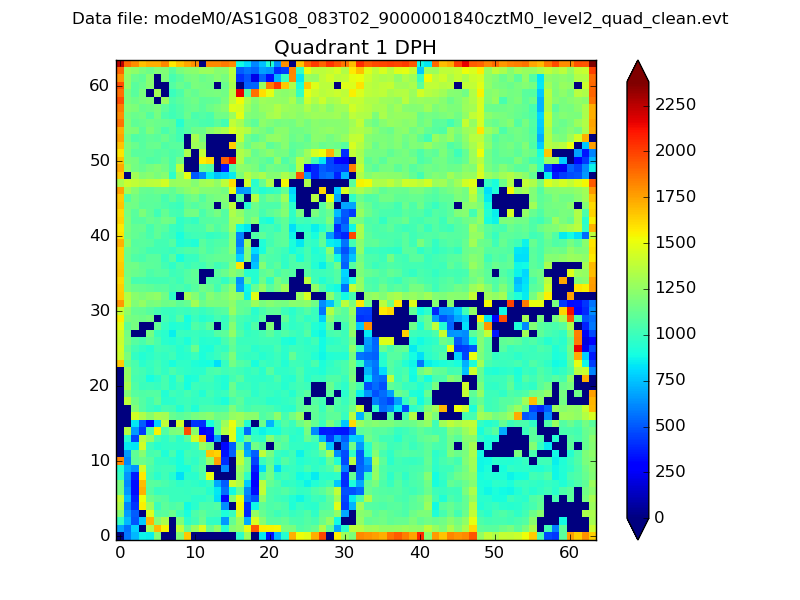 |
Quadrant B |
|---|---|---|---|
| Quadrant D |  |
 |
Quadrant C |
| Plot type | Count rate plots | Images |
|---|---|---|
| Comparison with Poisson distribution Blue bars denote a histogram of data divided into 1 sec bins. Red curve is a Poisson curve with rate = median count rate of data. |
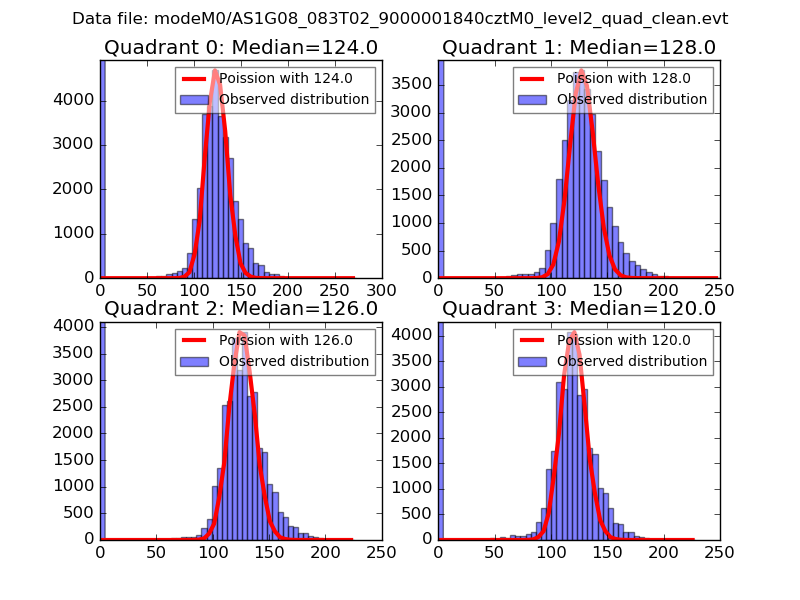 |
 |
| Quadrant-wise count rates Data is divided into 100 sec bins |
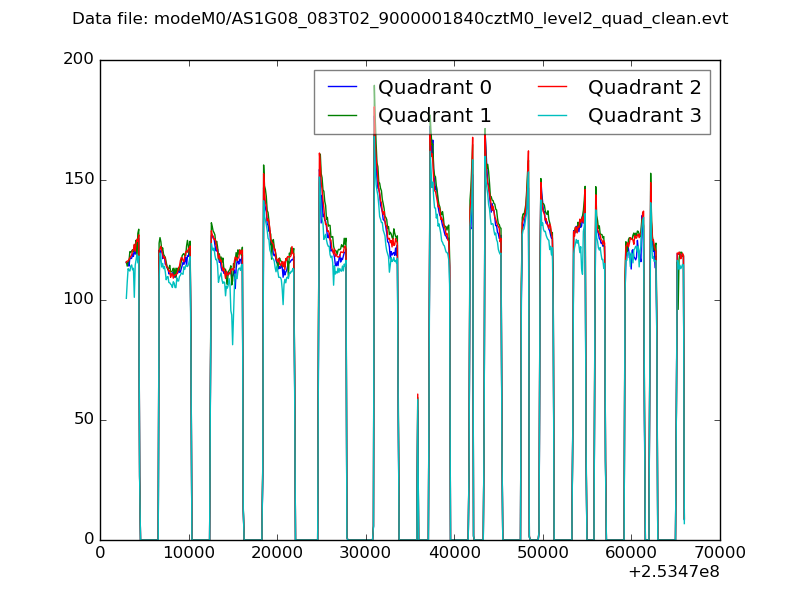 |
|
| Module-wise count rates for Quadrant A Data is divided into 100 sec bins |
 |
 |
| Module-wise count rates for Quadrant B Data is divided into 100 sec bins |
 |
 |
| Module-wise count rates for Quadrant C Data is divided into 100 sec bins |
 |
 |
| Module-wise count rates for Quadrant D Data is divided into 100 sec bins |
 |
 |
| Parameter | Plot |
|---|---|
| CZT HV Monitor | 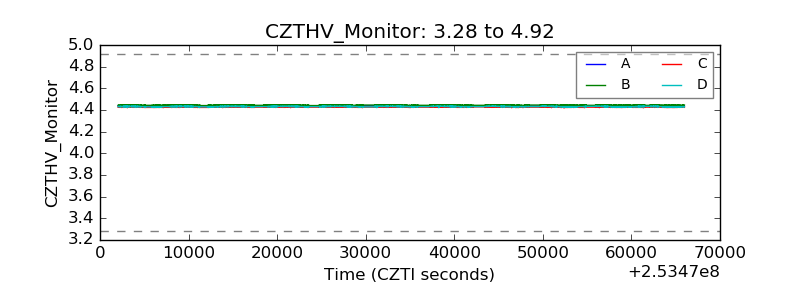 |
| D_VDD |  |
| Temperature 1 |  |
| Veto HV Monitor |  |
| Veto LLD | 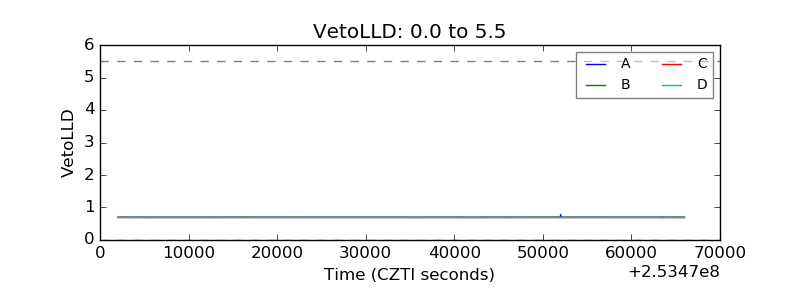 |
| Alpha Counter |  |
| _CPM_Rate |  |
| CZT Counter |  |
| +2.5 Volts monitor |  |
| +5 Volts monitor |  |
| _ROLL_ROT | 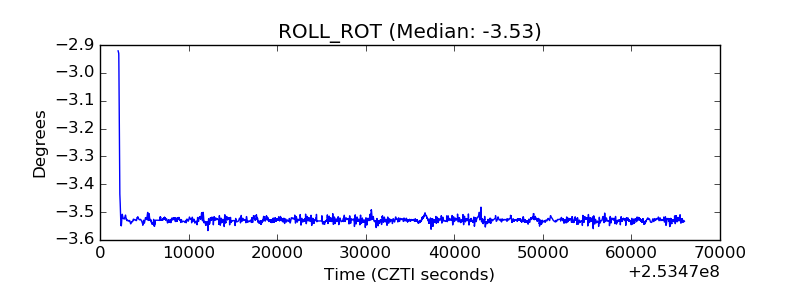 |
| _Roll_DEC |  |
| _Roll_RA | 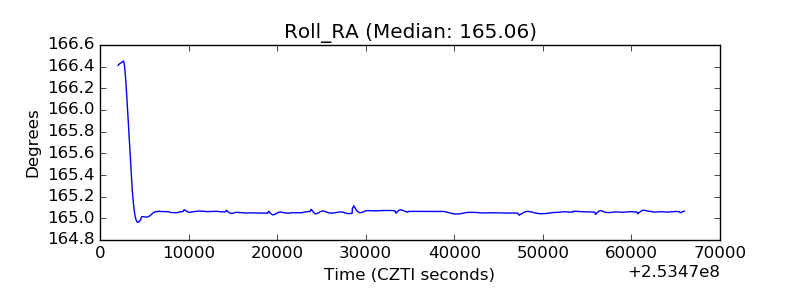 |
| Veto Counter | 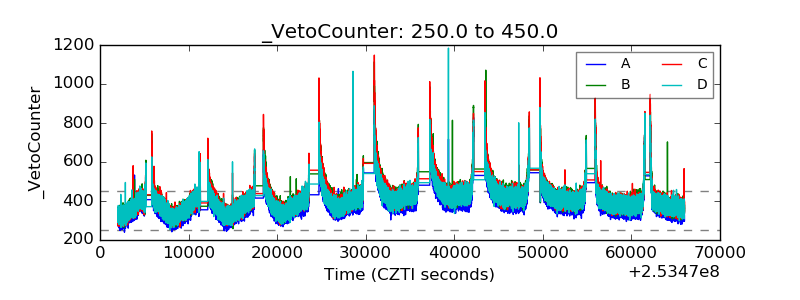 |