| Param | Original file | Final file |
|---|---|---|
| Filename | modeM0/AS1A04_023T01_9000001842cztM0_level2_bc.evt | modeM0/AS1A04_023T01_9000001842cztM0_level2_quad_clean.evt |
| Size (bytes) | 826,591,680 | 277,896,960 |
| Size | 788.3 MB | 265.0 MB |
| Events in quadrant A | 5,838,005 | 1,720,409 |
| Events in quadrant B | 6,329,016 | 1,733,657 |
| Events in quadrant C | 4,252,812 | 1,741,169 |
| Events in quadrant D | 7,072,177 | 1,670,703 |
| Mode M0 | |||
|---|---|---|---|
| Quadrant | BADHDUFLAG | Total packets | Discarded packets |
| A | 0 | 53041 | 0 |
| B | 0 | 54372 | 0 |
| C | 0 | 46409 | 0 |
| D | 0 | 55497 | 0 |
| Mode SS | |||
|---|---|---|---|
| Quadrant | BADHDUFLAG | Total packets | Discarded packets |
| A | 0 | 460 | 0 |
| B | 0 | 460 | 0 |
| C | 0 | 460 | 0 |
| D | 0 | 460 | 0 |
| Mode M9 | |||
|---|---|---|---|
| Quadrant | BADHDUFLAG | Total packets | Discarded packets |
| A | 0 | 14 | 0 |
| B | 0 | 14 | 0 |
| C | 0 | 14 | 0 |
| D | 0 | 14 | 0 |
| Quadrant | Total seconds | Saturated seconds | Saturation percentage |
|---|---|---|---|
| A | 22521 | 659 | 2.926158% |
| B | 22521 | 1090 | 4.839927% |
| C | 22521 | 349 | 1.549665% |
| D | 22521 | 728 | 3.232539% |
Noise dominated data is calculated using 1-second bins in cleaned event files. If a bin has >2000 counts, and if more than 50% of those come from <1% of pixels, then it is considered to be noise-dominated and hence unusable.
| Quadrant | # 1 sec bins | Bins with >0 counts | Bins with >2000 counts | High rate bins dominated by noise | Noise dominated (total time) | Noise dominated (detector-on time) | Marked lightcurve |
|---|---|---|---|---|---|---|---|
| A | 24002 | 22521 | 4 | 4 | 0.02% | 0.02% |  |
| B | 24002 | 22519 | 22 | 22 | 0.09% | 0.10% | 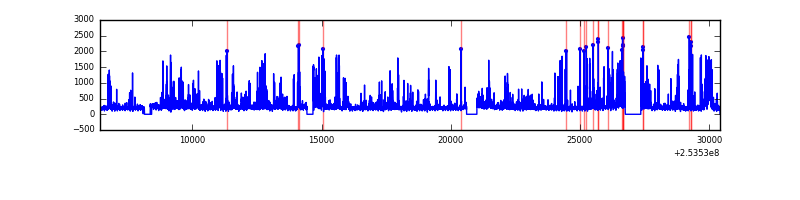 |
| C | 24002 | 22522 | 0 | 0 | 0.00% | 0.00% | 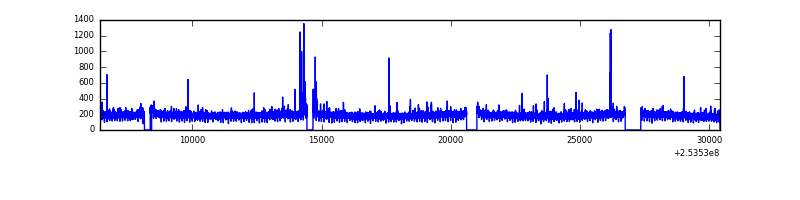 |
| D | 24002 | 22518 | 46 | 46 | 0.19% | 0.20% |  |
Top three noisy pixels from each quadrant. If the there are fewer than three noisy pixels in the level2.evt file, extra rows are filled as -1
| Pixel properties | Quadrant properties | ||||||
|---|---|---|---|---|---|---|---|
| Quadrant | DetID | PixID | Counts | Sigma | Mean | Median | Sigma |
| A | 14 | 237 | 585602 | 2423.92 | 1081 | 1054 | 241.2 |
| A | 13 | 251 | 430429 | 1780.47 | 1081 | 1054 | 241.2 |
| A | 12 | 189 | 280351 | 1158.15 | 1081 | 1054 | 241.2 |
| B | 4 | 239 | 1012241 | 4781.01 | 1079 | 1046 | 211.5 |
| B | 3 | 64 | 621104 | 2931.68 | 1079 | 1046 | 211.5 |
| B | 3 | 209 | 151823 | 712.88 | 1079 | 1046 | 211.5 |
| C | 15 | 208 | 20754 | 82.78 | 1069 | 1047 | 238.1 |
| C | 8 | 128 | 18146 | 71.82 | 1069 | 1047 | 238.1 |
| C | 14 | 234 | 13866 | 53.84 | 1069 | 1047 | 238.1 |
| D | 1 | 52 | 1910335 | 7469.0 | 1071 | 1026 | 255.6 |
| D | 7 | 80 | 176387 | 685.99 | 1071 | 1026 | 255.6 |
| D | 13 | 104 | 134175 | 520.86 | 1071 | 1026 | 255.6 |
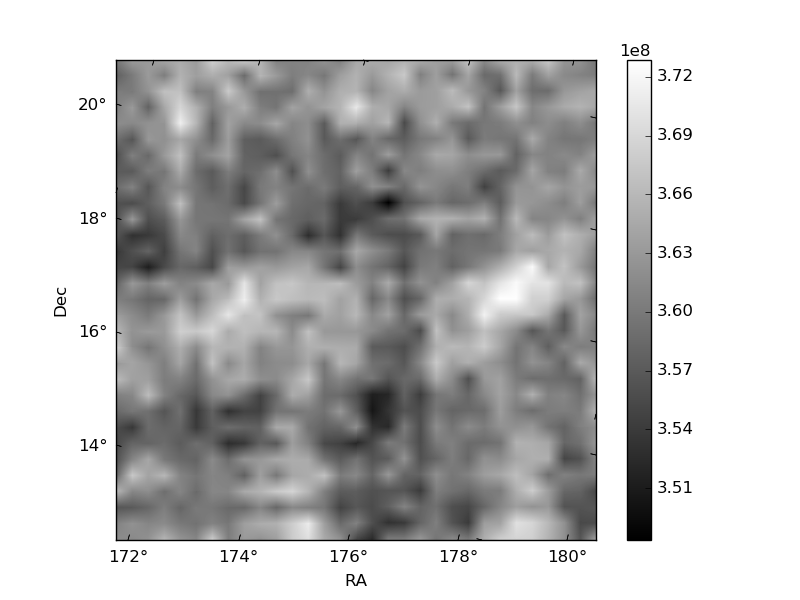
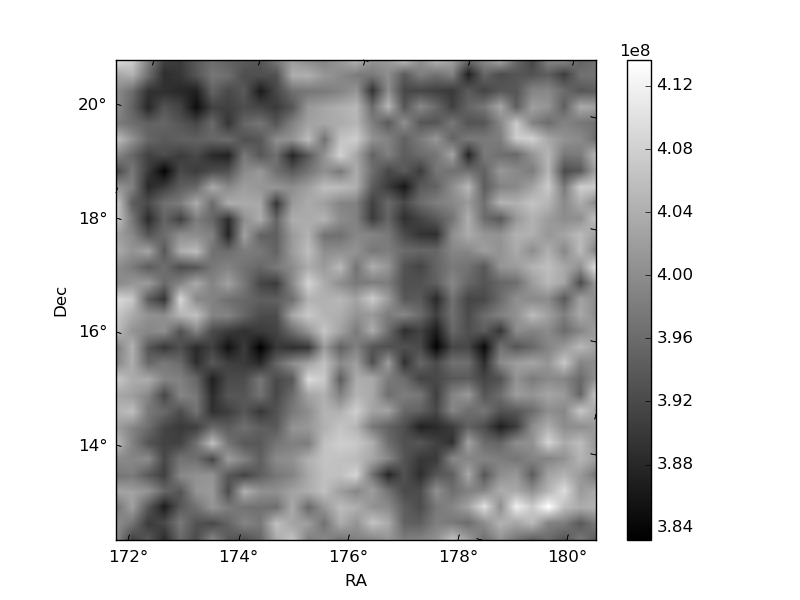
Histogram calculated using DETX and DETY for each event in the final _common_clean file
| Quadrant A | 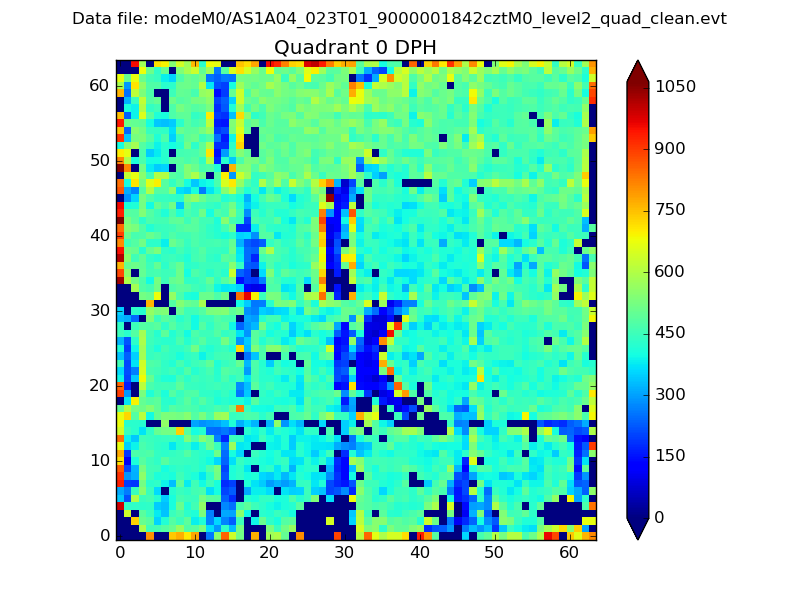 |
 |
Quadrant B |
|---|---|---|---|
| Quadrant D | 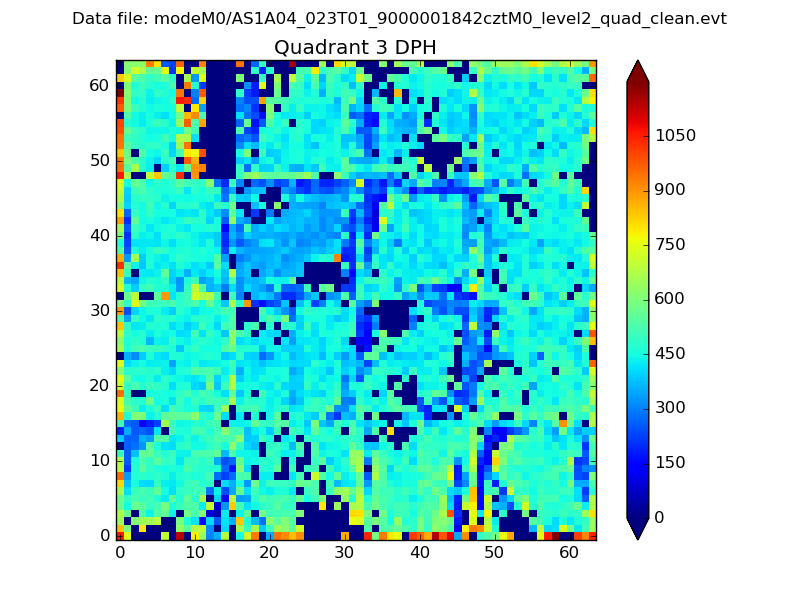 |
 |
Quadrant C |
| Plot type | Count rate plots | Images |
|---|---|---|
| Comparison with Poisson distribution Blue bars denote a histogram of data divided into 1 sec bins. Red curve is a Poisson curve with rate = median count rate of data. |
 |
 |
| Quadrant-wise count rates Data is divided into 100 sec bins |
 |
|
| Module-wise count rates for Quadrant A Data is divided into 100 sec bins |
 |
 |
| Module-wise count rates for Quadrant B Data is divided into 100 sec bins |
 |
 |
| Module-wise count rates for Quadrant C Data is divided into 100 sec bins |
 |
 |
| Module-wise count rates for Quadrant D Data is divided into 100 sec bins |
 |
 |
| Parameter | Plot |
|---|---|
| CZT HV Monitor | 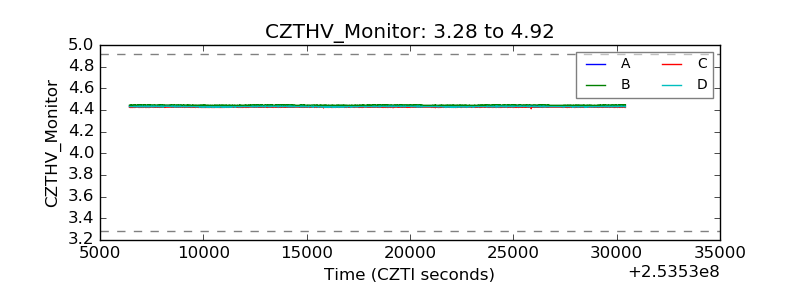 |
| D_VDD |  |
| Temperature 1 |  |
| Veto HV Monitor | 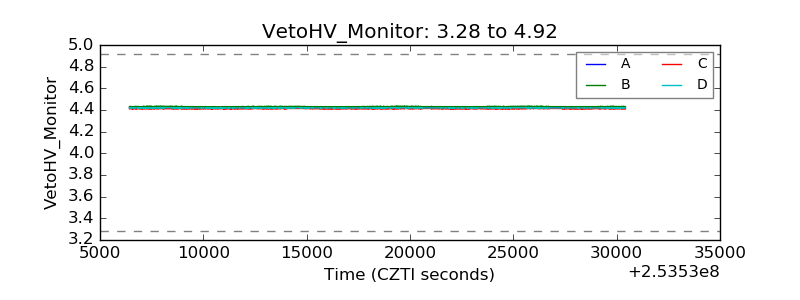 |
| Veto LLD |  |
| Alpha Counter |  |
| _CPM_Rate |  |
| CZT Counter |  |
| +2.5 Volts monitor |  |
| +5 Volts monitor | 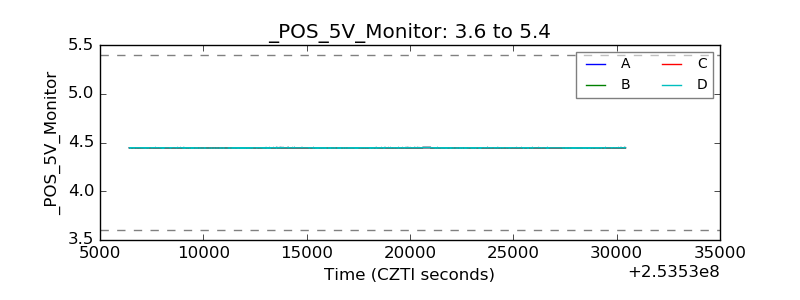 |
| _ROLL_ROT | 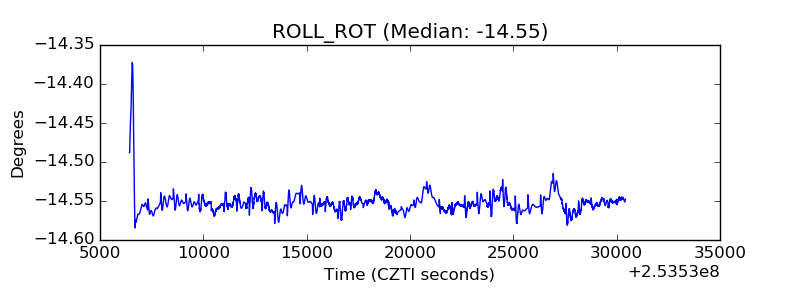 |
| _Roll_DEC | 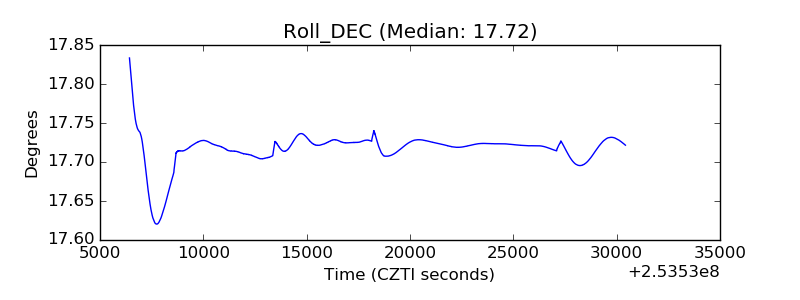 |
| _Roll_RA | 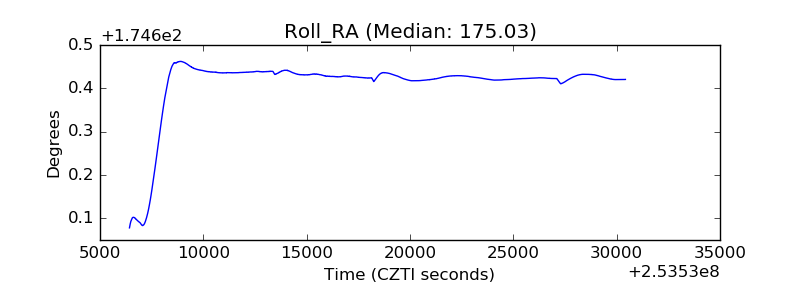 |
| Veto Counter | 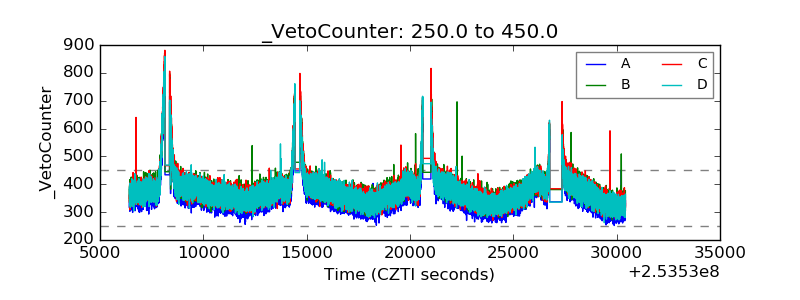 |