| Param | Original file | Final file |
|---|---|---|
| Filename | modeM0/AS1A04_201T01_9000001844cztM0_level2_bc.evt | modeM0/AS1A04_201T01_9000001844cztM0_level2_quad_clean.evt |
| Size (bytes) | 1,601,867,520 | 545,538,240 |
| Size | 1.5 GB | 520.3 MB |
| Events in quadrant A | 11,493,185 | 3,412,954 |
| Events in quadrant B | 12,981,156 | 3,491,332 |
| Events in quadrant C | 8,701,782 | 3,456,169 |
| Events in quadrant D | 12,436,786 | 3,245,044 |
| Mode M9 | |||
|---|---|---|---|
| Quadrant | BADHDUFLAG | Total packets | Discarded packets |
| A | 0 | 87 | 0 |
| B | 0 | 87 | 0 |
| C | 0 | 87 | 0 |
| D | 0 | 87 | 0 |
| Mode SS | |||
|---|---|---|---|
| Quadrant | BADHDUFLAG | Total packets | Discarded packets |
| A | 0 | 870 | 0 |
| B | 0 | 870 | 0 |
| C | 0 | 870 | 0 |
| D | 0 | 870 | 0 |
| Mode M0 | |||
|---|---|---|---|
| Quadrant | BADHDUFLAG | Total packets | Discarded packets |
| A | 0 | 99539 | 0 |
| B | 0 | 106242 | 0 |
| C | 0 | 87743 | 0 |
| D | 0 | 102234 | 0 |
| Quadrant | Total seconds | Saturated seconds | Saturation percentage |
|---|---|---|---|
| A | 42500 | 547 | 1.287059% |
| B | 42500 | 1898 | 4.465882% |
| C | 42500 | 211 | 0.496471% |
| D | 42500 | 1157 | 2.722353% |
Noise dominated data is calculated using 1-second bins in cleaned event files. If a bin has >2000 counts, and if more than 50% of those come from <1% of pixels, then it is considered to be noise-dominated and hence unusable.
| Quadrant | # 1 sec bins | Bins with >0 counts | Bins with >2000 counts | High rate bins dominated by noise | Noise dominated (total time) | Noise dominated (detector-on time) | Marked lightcurve |
|---|---|---|---|---|---|---|---|
| A | 51406 | 42498 | 11 | 11 | 0.02% | 0.03% | 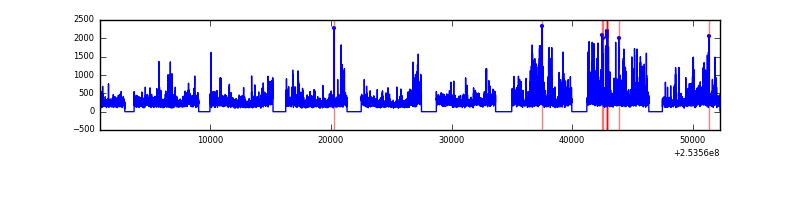 |
| B | 51406 | 42492 | 56 | 56 | 0.11% | 0.13% |  |
| C | 51406 | 42497 | 5 | 5 | 0.01% | 0.01% |  |
| D | 51406 | 42497 | 124 | 124 | 0.24% | 0.29% |  |
Top three noisy pixels from each quadrant. If the there are fewer than three noisy pixels in the level2.evt file, extra rows are filled as -1
| Pixel properties | Quadrant properties | ||||||
|---|---|---|---|---|---|---|---|
| Quadrant | DetID | PixID | Counts | Sigma | Mean | Median | Sigma |
| A | 13 | 251 | 1774359 | 3707.61 | 2192 | 2145 | 478.0 |
| A | 12 | 189 | 632708 | 1319.18 | 2192 | 2145 | 478.0 |
| A | 1 | 162 | 313616 | 651.62 | 2192 | 2145 | 478.0 |
| B | 4 | 239 | 3076340 | 7474.19 | 2186 | 2126 | 411.3 |
| B | 3 | 64 | 635210 | 1539.19 | 2186 | 2126 | 411.3 |
| B | 3 | 209 | 169649 | 407.29 | 2186 | 2126 | 411.3 |
| C | 15 | 208 | 188489 | 392.96 | 2163 | 2132 | 474.2 |
| C | 14 | 234 | 40002 | 79.85 | 2163 | 2132 | 474.2 |
| C | 1 | 16 | 18153 | 33.78 | 2163 | 2132 | 474.2 |
| D | 1 | 52 | 3023920 | 6211.1 | 2130 | 2056 | 486.5 |
| D | 8 | 195 | 362185 | 740.2 | 2130 | 2056 | 486.5 |
| D | 2 | 14 | 292566 | 597.11 | 2130 | 2056 | 486.5 |
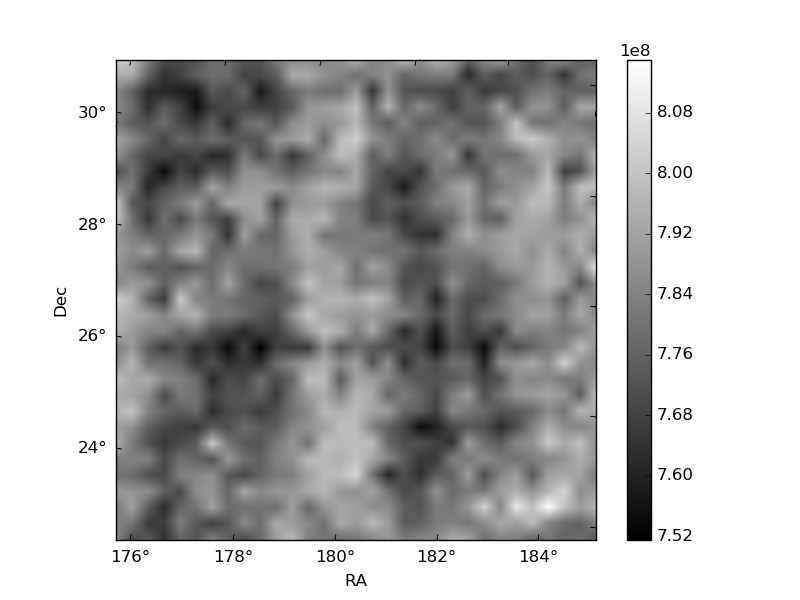
Histogram calculated using DETX and DETY for each event in the final _common_clean file
| Quadrant A | 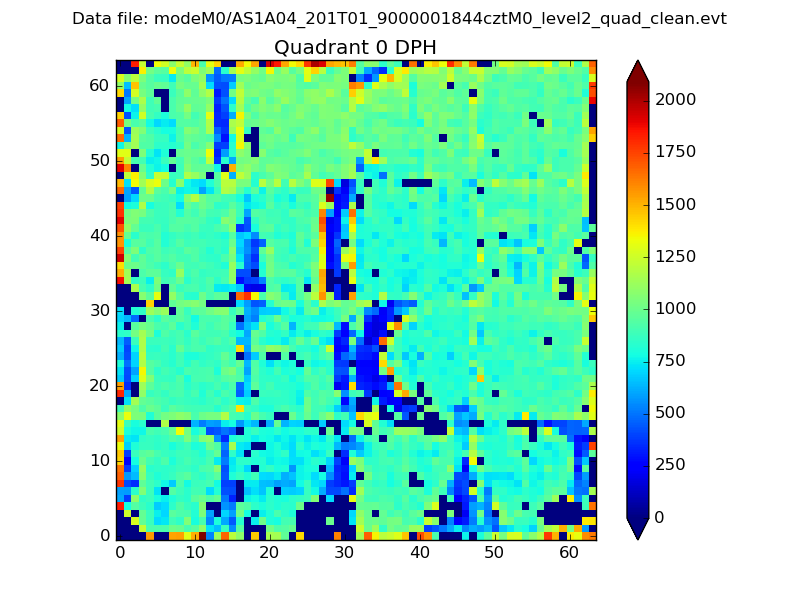 |
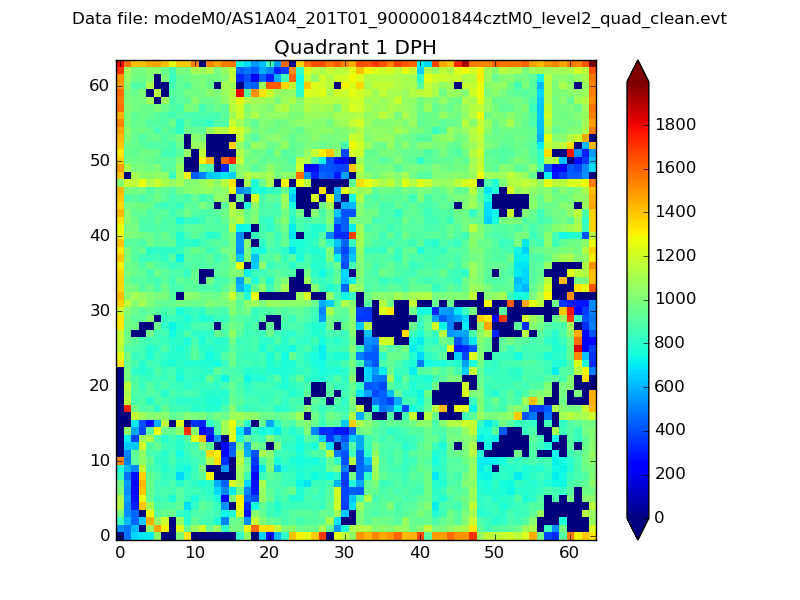 |
Quadrant B |
|---|---|---|---|
| Quadrant D | 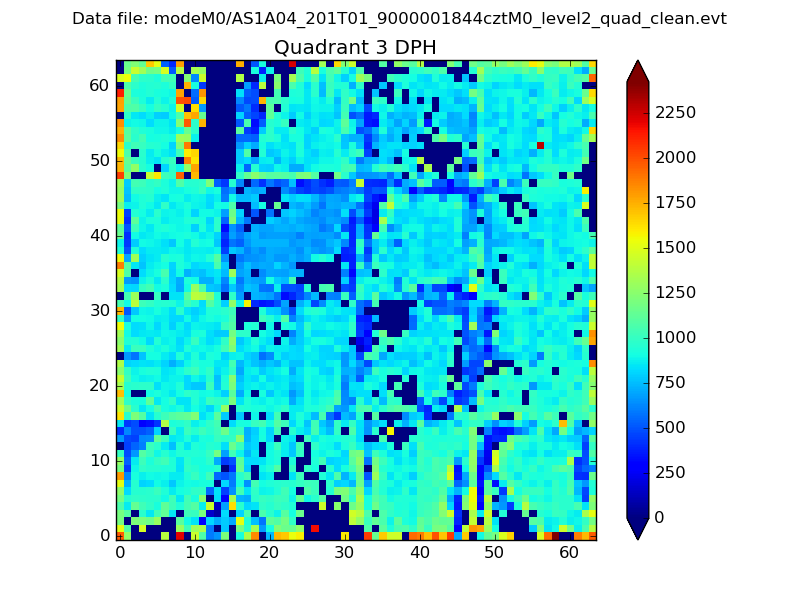 |
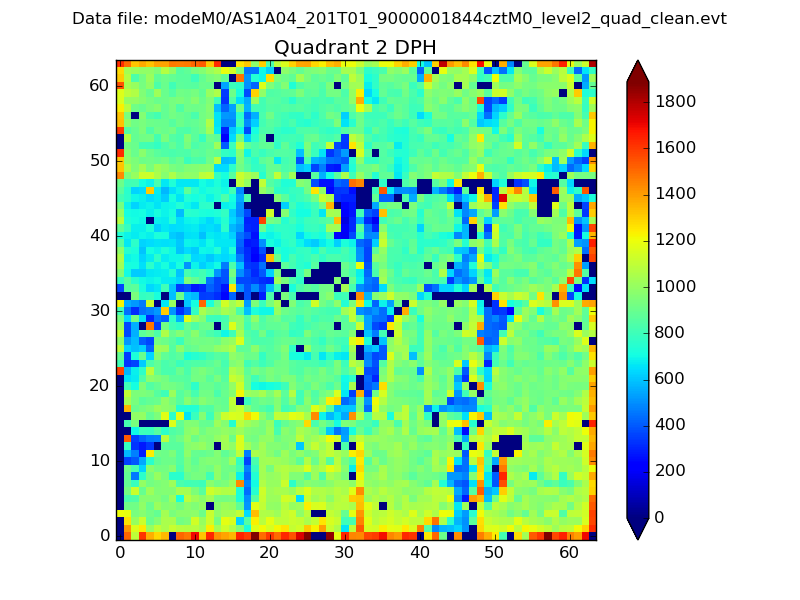 |
Quadrant C |
| Plot type | Count rate plots | Images |
|---|---|---|
| Comparison with Poisson distribution Blue bars denote a histogram of data divided into 1 sec bins. Red curve is a Poisson curve with rate = median count rate of data. |
 |
 |
| Quadrant-wise count rates Data is divided into 100 sec bins |
 |
|
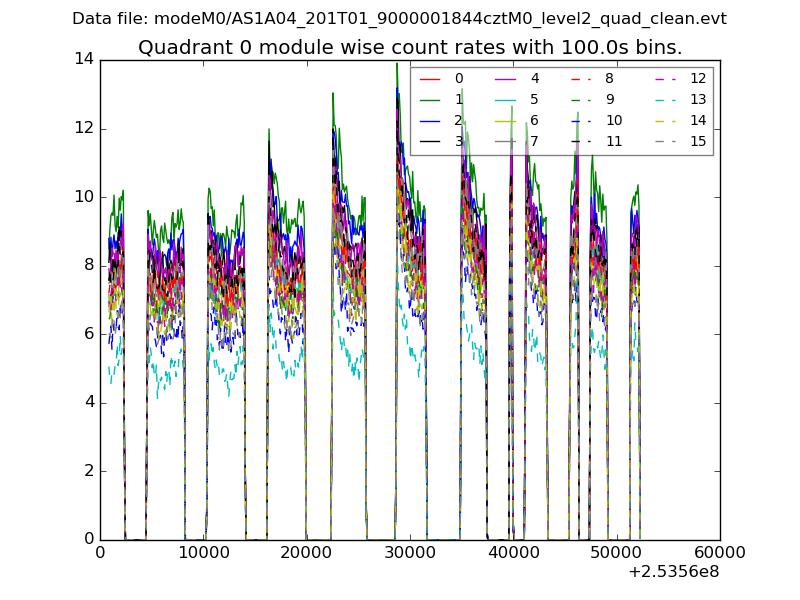
| Module-wise count rates for Quadrant A Data is divided into 100 sec bins |
 |
 |
| Module-wise count rates for Quadrant B Data is divided into 100 sec bins |
 |
 |
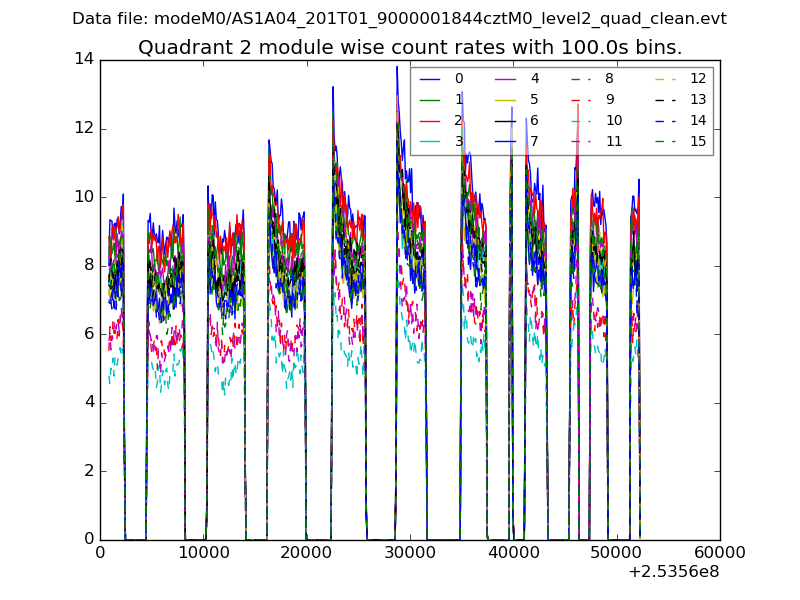
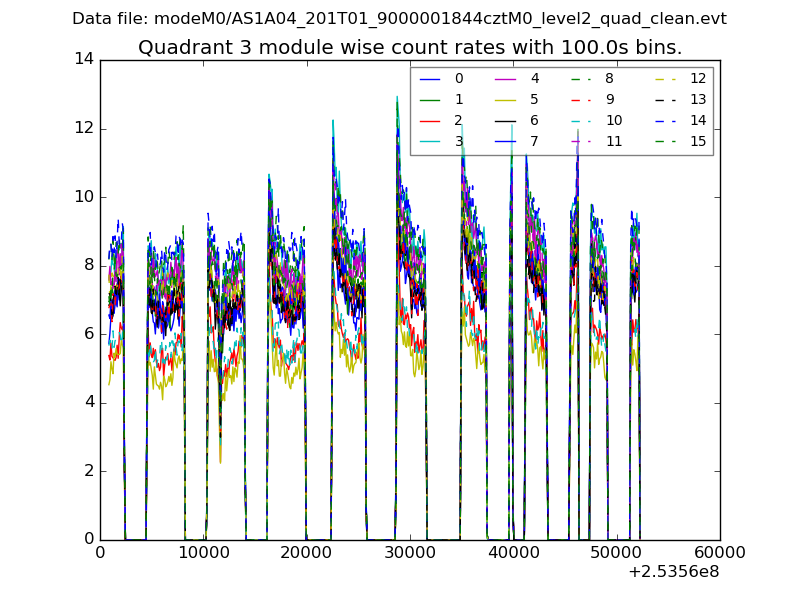
| Module-wise count rates for Quadrant C Data is divided into 100 sec bins |
 |
 |
| Module-wise count rates for Quadrant D Data is divided into 100 sec bins |
 |
 |
| Parameter | Plot |
|---|---|
| CZT HV Monitor |  |
| D_VDD | 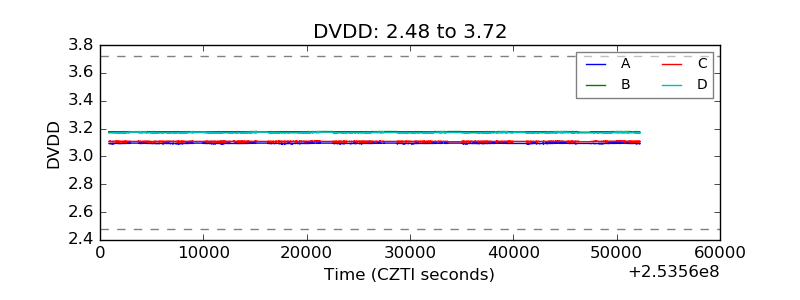 |
| Temperature 1 |  |
| Veto HV Monitor |  |
| Veto LLD |  |
| Alpha Counter |  |
| _CPM_Rate |  |
| CZT Counter |  |
| +2.5 Volts monitor |  |
| +5 Volts monitor |  |
| _ROLL_ROT | 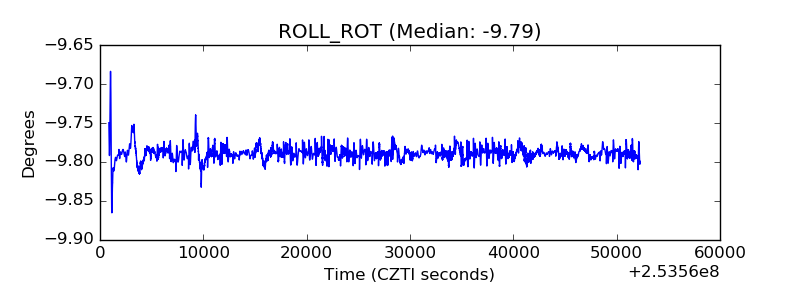 |
| _Roll_DEC |  |
| _Roll_RA | 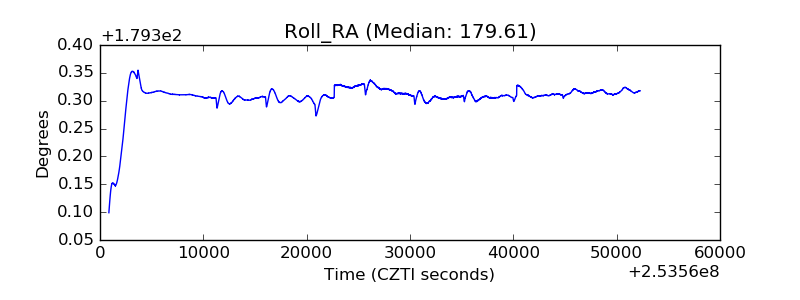 |
| Veto Counter |  |