| Param | Original file | Final file |
|---|---|---|
| Filename | modeM0/AS1A04_141T01_9000001848cztM0_level2_bc.evt | modeM0/AS1A04_141T01_9000001848cztM0_level2_quad_clean.evt |
| Size (bytes) | 3,110,976,000 | 838,215,360 |
| Size | 2.9 GB | 799.4 MB |
| Events in quadrant A | 21,644,462 | 5,239,796 |
| Events in quadrant B | 20,159,120 | 5,216,134 |
| Events in quadrant C | 14,275,748 | 5,328,298 |
| Events in quadrant D | 33,437,929 | 4,867,200 |
| Mode M0 | |||
|---|---|---|---|
| Quadrant | BADHDUFLAG | Total packets | Discarded packets |
| A | 0 | 173888 | 0 |
| B | 0 | 169061 | 0 |
| C | 0 | 143504 | 0 |
| D | 0 | 201797 | 0 |
| Mode SS | |||
|---|---|---|---|
| Quadrant | BADHDUFLAG | Total packets | Discarded packets |
| A | 0 | 1410 | 0 |
| B | 0 | 1410 | 0 |
| C | 0 | 1410 | 0 |
| D | 0 | 1410 | 0 |
| Mode M9 | |||
|---|---|---|---|
| Quadrant | BADHDUFLAG | Total packets | Discarded packets |
| A | 0 | 112 | 0 |
| B | 0 | 112 | 0 |
| C | 0 | 112 | 0 |
| D | 0 | 112 | 0 |
| Quadrant | Total seconds | Saturated seconds | Saturation percentage |
|---|---|---|---|
| A | 69041 | 1716 | 2.485480% |
| B | 69041 | 3613 | 5.233122% |
| C | 69041 | 711 | 1.029823% |
| D | 69041 | 4952 | 7.172550% |
Noise dominated data is calculated using 1-second bins in cleaned event files. If a bin has >2000 counts, and if more than 50% of those come from <1% of pixels, then it is considered to be noise-dominated and hence unusable.
| Quadrant | # 1 sec bins | Bins with >0 counts | Bins with >2000 counts | High rate bins dominated by noise | Noise dominated (total time) | Noise dominated (detector-on time) | Marked lightcurve |
|---|---|---|---|---|---|---|---|
| A | 80352 | 69032 | 17 | 17 | 0.02% | 0.02% |  |
| B | 80352 | 69032 | 92 | 92 | 0.11% | 0.13% |  |
| C | 80352 | 69039 | 8 | 8 | 0.01% | 0.01% |  |
| D | 80352 | 69038 | 3195 | 3195 | 3.98% | 4.63% | 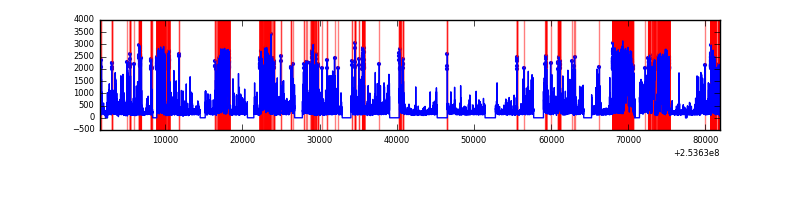 |
Top three noisy pixels from each quadrant. If the there are fewer than three noisy pixels in the level2.evt file, extra rows are filled as -1
| Pixel properties | Quadrant properties | ||||||
|---|---|---|---|---|---|---|---|
| Quadrant | DetID | PixID | Counts | Sigma | Mean | Median | Sigma |
| A | 13 | 251 | 4617802 | 6071.46 | 3475 | 3405 | 760.0 |
| A | 15 | 239 | 2077170 | 2728.59 | 3475 | 3405 | 760.0 |
| A | 1 | 162 | 628337 | 822.26 | 3475 | 3405 | 760.0 |
| B | 4 | 239 | 4929268 | 7564.77 | 3491 | 3397 | 651.2 |
| B | 3 | 64 | 773737 | 1183.03 | 3491 | 3397 | 651.2 |
| B | 0 | 187 | 248160 | 375.89 | 3491 | 3397 | 651.2 |
| C | 15 | 208 | 586741 | 764.88 | 3479 | 3429 | 762.6 |
| C | 14 | 234 | 46142 | 56.01 | 3479 | 3429 | 762.6 |
| C | 13 | 61 | 20872 | 22.87 | 3479 | 3429 | 762.6 |
| D | 1 | 52 | 18885029 | 24510.93 | 3385 | 3268 | 770.3 |
| D | 8 | 195 | 298555 | 383.32 | 3385 | 3268 | 770.3 |
| D | 13 | 104 | 273497 | 350.79 | 3385 | 3268 | 770.3 |
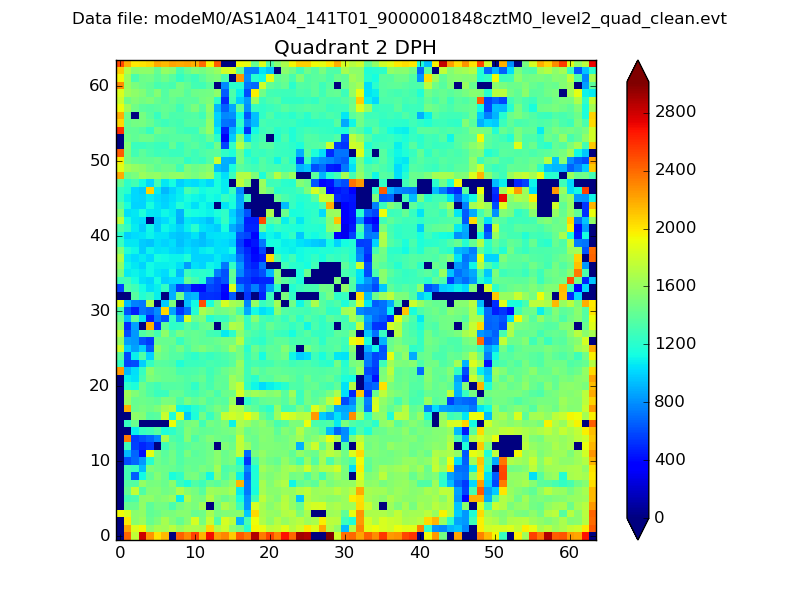
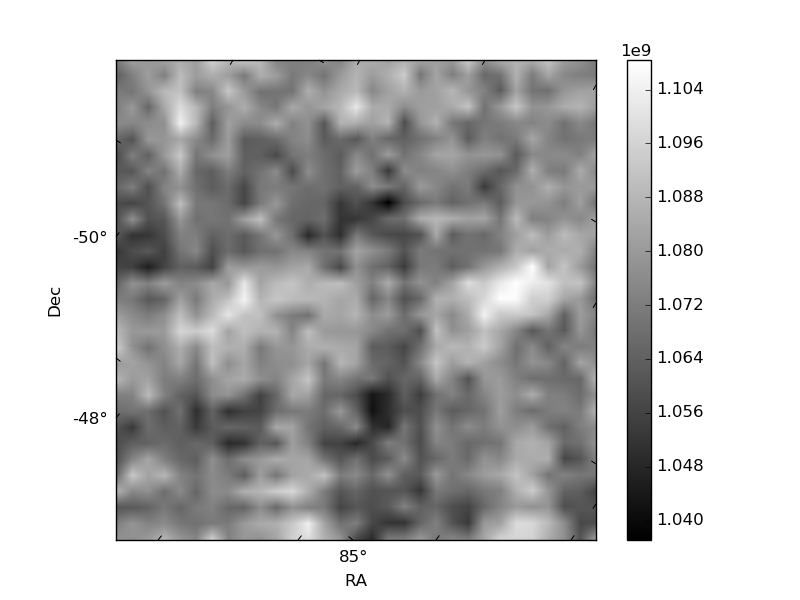
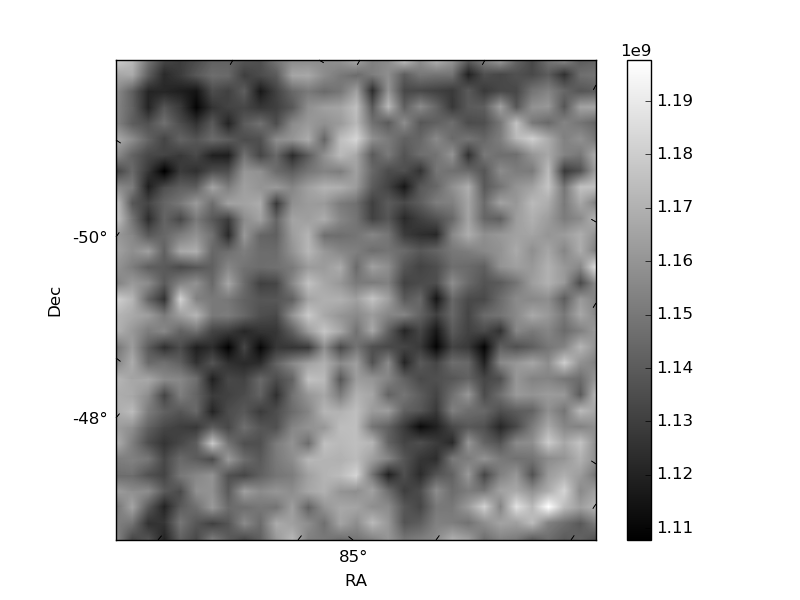
Histogram calculated using DETX and DETY for each event in the final _common_clean file
| Quadrant A | 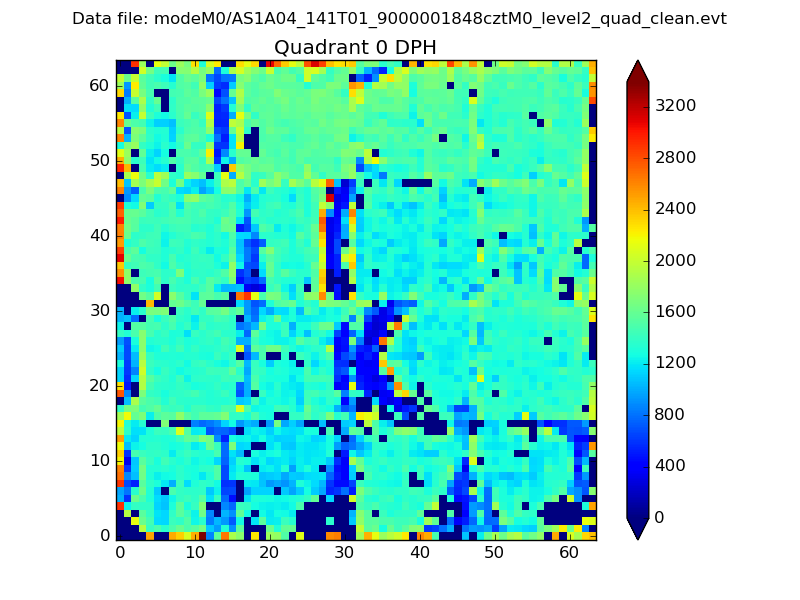 |
 |
Quadrant B |
|---|---|---|---|
| Quadrant D |  |
 |
Quadrant C |
| Plot type | Count rate plots | Images |
|---|---|---|
| Comparison with Poisson distribution Blue bars denote a histogram of data divided into 1 sec bins. Red curve is a Poisson curve with rate = median count rate of data. |
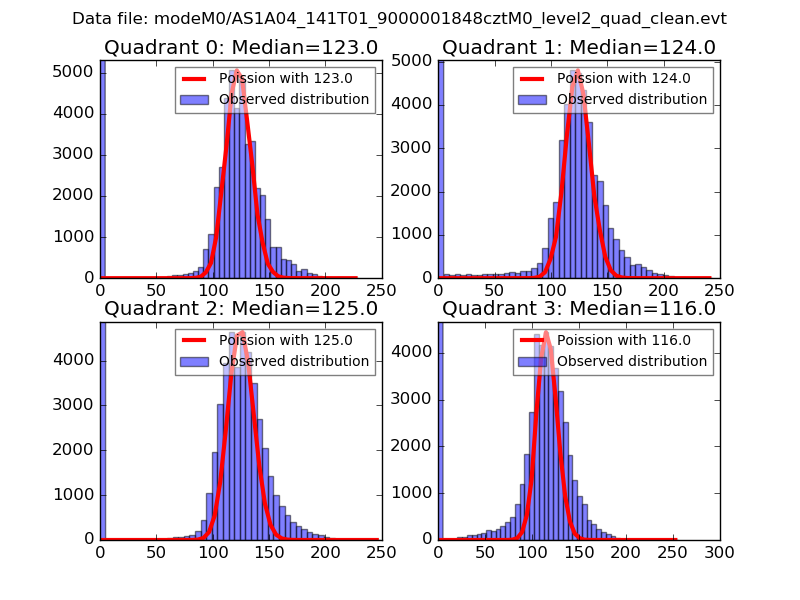 |
 |
| Quadrant-wise count rates Data is divided into 100 sec bins |
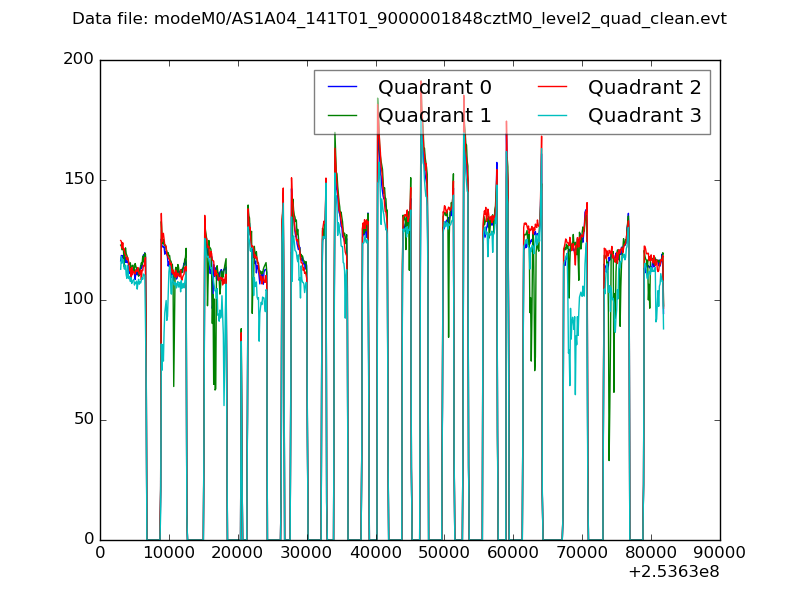 |
|
| Module-wise count rates for Quadrant A Data is divided into 100 sec bins |
 |
 |
| Module-wise count rates for Quadrant B Data is divided into 100 sec bins |
 |
 |
| Module-wise count rates for Quadrant C Data is divided into 100 sec bins |
 |
 |
| Module-wise count rates for Quadrant D Data is divided into 100 sec bins |
 |
 |
| Parameter | Plot |
|---|---|
| CZT HV Monitor |  |
| D_VDD |  |
| Temperature 1 | 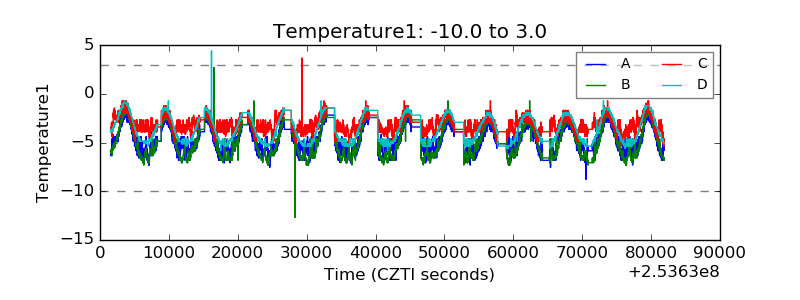 |
| Veto HV Monitor |  |
| Veto LLD | 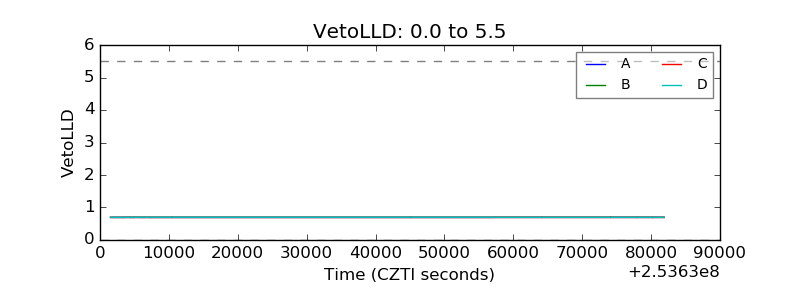 |
| Alpha Counter |  |
| _CPM_Rate |  |
| CZT Counter |  |
| +2.5 Volts monitor |  |
| +5 Volts monitor |  |
| _ROLL_ROT |  |
| _Roll_DEC |  |
| _Roll_RA |  |
| Veto Counter | 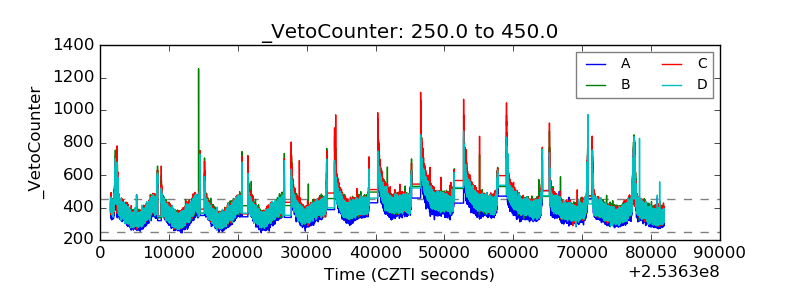 |