| Param | Original file | Final file |
|---|---|---|
| Filename | modeM0/AS1A04_230T01_9000001854cztM0_level2_bc.evt | modeM0/AS1A04_230T01_9000001854cztM0_level2_quad_clean.evt |
| Size (bytes) | 2,866,999,680 | 1,067,212,800 |
| Size | 2.7 GB | 1017.8 MB |
| Events in quadrant A | 17,754,122 | 6,823,704 |
| Events in quadrant B | 18,981,640 | 6,940,745 |
| Events in quadrant C | 16,071,742 | 6,824,105 |
| Events in quadrant D | 28,637,368 | 6,321,611 |
| Mode M9 | |||
|---|---|---|---|
| Quadrant | BADHDUFLAG | Total packets | Discarded packets |
| A | 0 | 123 | 0 |
| B | 0 | 123 | 0 |
| C | 0 | 123 | 0 |
| D | 0 | 123 | 0 |
| Mode SS | |||
|---|---|---|---|
| Quadrant | BADHDUFLAG | Total packets | Discarded packets |
| A | 0 | 1606 | 0 |
| B | 0 | 1606 | 0 |
| C | 0 | 1606 | 0 |
| D | 0 | 1606 | 0 |
| Mode M0 | |||
|---|---|---|---|
| Quadrant | BADHDUFLAG | Total packets | Discarded packets |
| A | 0 | 172560 | 0 |
| B | 0 | 174225 | 0 |
| C | 0 | 163680 | 0 |
| D | 0 | 207158 | 0 |
| Quadrant | Total seconds | Saturated seconds | Saturation percentage |
|---|---|---|---|
| A | 78986 | 1063 | 1.345808% |
| B | 78986 | 1582 | 2.002887% |
| C | 78986 | 667 | 0.844453% |
| D | 78986 | 4205 | 5.323728% |
Noise dominated data is calculated using 1-second bins in cleaned event files. If a bin has >2000 counts, and if more than 50% of those come from <1% of pixels, then it is considered to be noise-dominated and hence unusable.
| Quadrant | # 1 sec bins | Bins with >0 counts | Bins with >2000 counts | High rate bins dominated by noise | Noise dominated (total time) | Noise dominated (detector-on time) | Marked lightcurve |
|---|---|---|---|---|---|---|---|
| A | 91003 | 78989 | 0 | 0 | 0.00% | 0.00% |  |
| B | 91003 | 78985 | 14 | 14 | 0.02% | 0.02% | 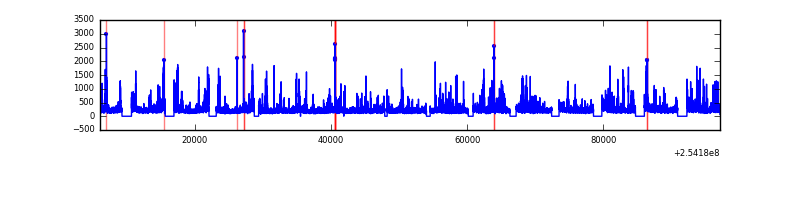 |
| C | 91003 | 78986 | 2 | 2 | 0.00% | 0.00% |  |
| D | 91003 | 78986 | 1185 | 1185 | 1.30% | 1.50% |  |
Top three noisy pixels from each quadrant. If the there are fewer than three noisy pixels in the level2.evt file, extra rows are filled as -1
| Pixel properties | Quadrant properties | ||||||
|---|---|---|---|---|---|---|---|
| Quadrant | DetID | PixID | Counts | Sigma | Mean | Median | Sigma |
| A | 1 | 162 | 674440 | 751.49 | 4108 | 4031 | 892.1 |
| A | 12 | 189 | 557059 | 619.91 | 4108 | 4031 | 892.1 |
| A | 8 | 15 | 343758 | 380.81 | 4108 | 4031 | 892.1 |
| B | 4 | 239 | 1957637 | 2499.61 | 4151 | 4044 | 781.6 |
| B | 0 | 214 | 283391 | 357.42 | 4151 | 4044 | 781.6 |
| B | 3 | 64 | 191419 | 239.75 | 4151 | 4044 | 781.6 |
| C | 15 | 208 | 101596 | 110.14 | 4044 | 3998 | 886.1 |
| C | 3 | 233 | 101282 | 109.79 | 4044 | 3998 | 886.1 |
| C | 13 | 61 | 24026 | 22.6 | 4044 | 3998 | 886.1 |
| D | 1 | 52 | 9297638 | 10146.88 | 3932 | 3798 | 915.9 |
| D | 7 | 80 | 994890 | 1082.06 | 3932 | 3798 | 915.9 |
| D | 8 | 195 | 821059 | 892.27 | 3932 | 3798 | 915.9 |
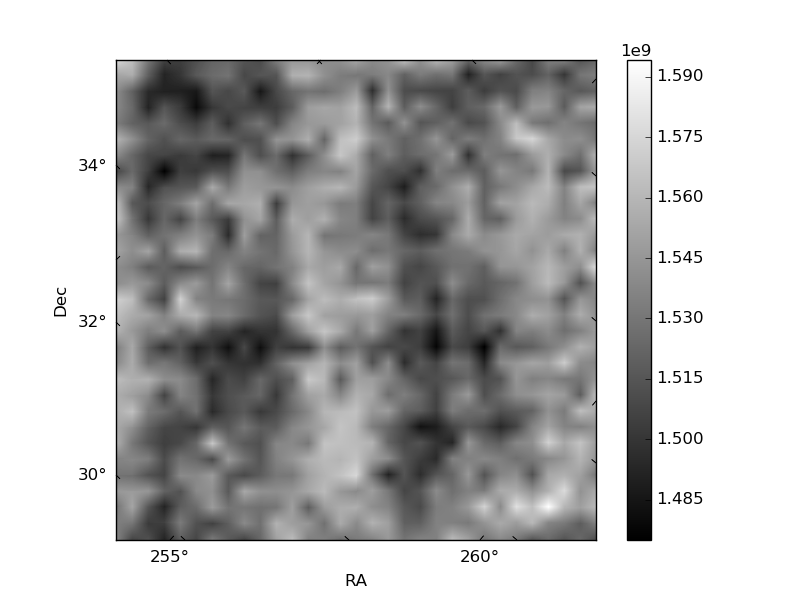
Histogram calculated using DETX and DETY for each event in the final _common_clean file
| Quadrant A | 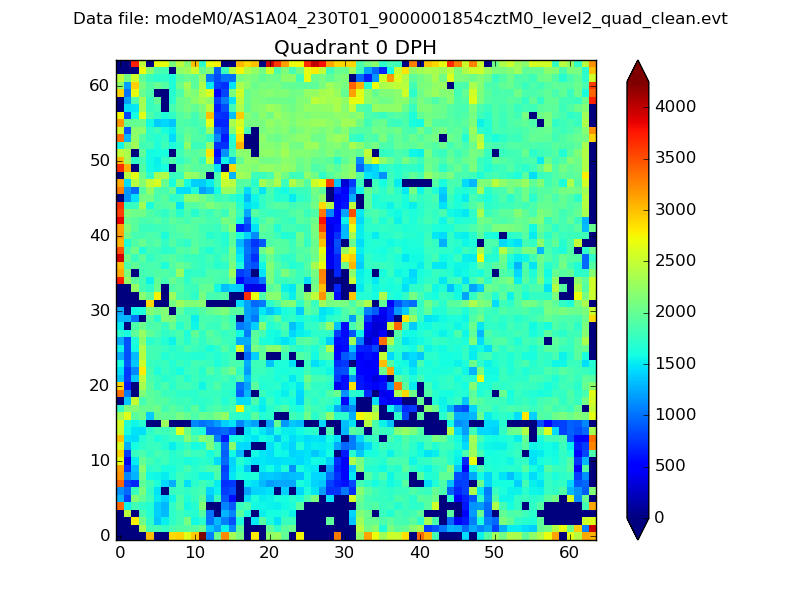 |
 |
Quadrant B |
|---|---|---|---|
| Quadrant D |  |
 |
Quadrant C |
| Plot type | Count rate plots | Images |
|---|---|---|
| Comparison with Poisson distribution Blue bars denote a histogram of data divided into 1 sec bins. Red curve is a Poisson curve with rate = median count rate of data. |
 |
 |
| Quadrant-wise count rates Data is divided into 100 sec bins |
 |
|
| Module-wise count rates for Quadrant A Data is divided into 100 sec bins |
 |
 |
| Module-wise count rates for Quadrant B Data is divided into 100 sec bins |
 |
 |
| Module-wise count rates for Quadrant C Data is divided into 100 sec bins |
 |
 |
| Module-wise count rates for Quadrant D Data is divided into 100 sec bins |
 |
 |
| Parameter | Plot |
|---|---|
| CZT HV Monitor |  |
| D_VDD | 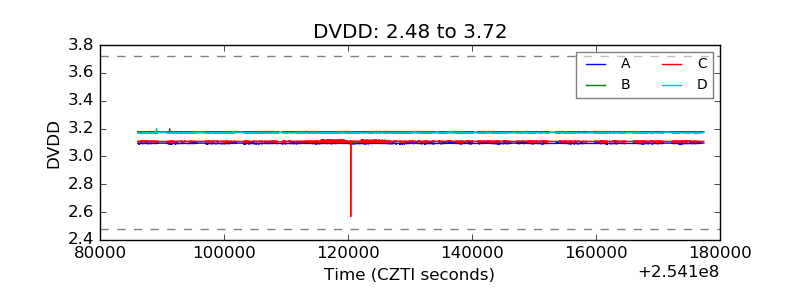 |
| Temperature 1 |  |
| Veto HV Monitor |  |
| Veto LLD |  |
| Alpha Counter |  |
| _CPM_Rate |  |
| CZT Counter |  |
| +2.5 Volts monitor |  |
| +5 Volts monitor |  |
| _ROLL_ROT | 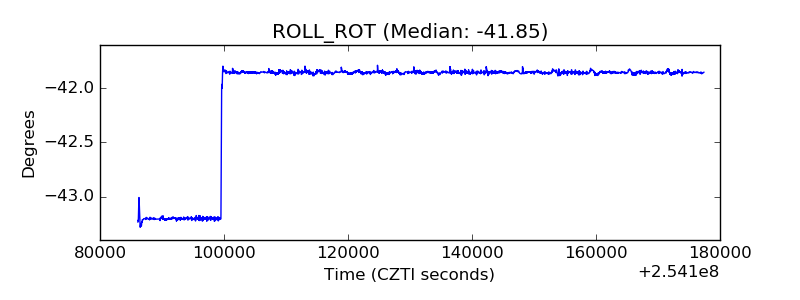 |
| _Roll_DEC | 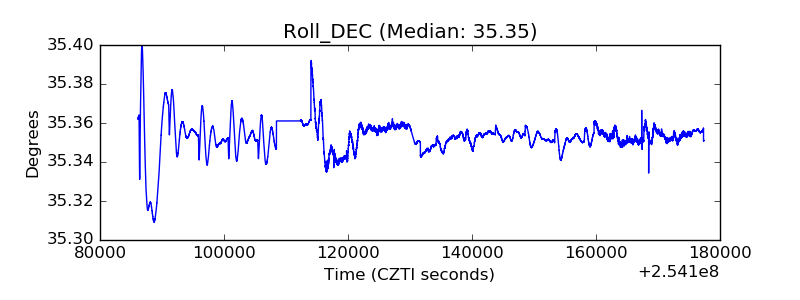 |
| _Roll_RA |  |
| Veto Counter |  |