| Param | Original file | Final file |
|---|---|---|
| Filename | modeM0/AS1A04_130T01_9000001856cztM0_level2_bc.evt | modeM0/AS1A04_130T01_9000001856cztM0_level2_quad_clean.evt |
| Size (bytes) | 1,814,186,880 | 624,896,640 |
| Size | 1.7 GB | 595.9 MB |
| Events in quadrant A | 12,101,422 | 3,881,760 |
| Events in quadrant B | 14,977,380 | 3,850,808 |
| Events in quadrant C | 10,187,233 | 3,872,040 |
| Events in quadrant D | 14,105,610 | 3,731,084 |
| Mode M0 | |||
|---|---|---|---|
| Quadrant | BADHDUFLAG | Total packets | Discarded packets |
| A | 0 | 117902 | 0 |
| B | 0 | 123601 | 0 |
| C | 0 | 107251 | 0 |
| D | 0 | 118545 | 0 |
| Mode M9 | |||
|---|---|---|---|
| Quadrant | BADHDUFLAG | Total packets | Discarded packets |
| A | 0 | 57 | 0 |
| B | 0 | 57 | 0 |
| C | 0 | 57 | 0 |
| D | 0 | 57 | 0 |
| Mode SS | |||
|---|---|---|---|
| Quadrant | BADHDUFLAG | Total packets | Discarded packets |
| A | 0 | 1062 | 0 |
| B | 0 | 1062 | 0 |
| C | 0 | 1062 | 0 |
| D | 0 | 1062 | 0 |
| Quadrant | Total seconds | Saturated seconds | Saturation percentage |
|---|---|---|---|
| A | 52354 | 1093 | 2.087711% |
| B | 52354 | 2555 | 4.880238% |
| C | 52354 | 452 | 0.863353% |
| D | 52354 | 1004 | 1.917714% |
Noise dominated data is calculated using 1-second bins in cleaned event files. If a bin has >2000 counts, and if more than 50% of those come from <1% of pixels, then it is considered to be noise-dominated and hence unusable.
| Quadrant | # 1 sec bins | Bins with >0 counts | Bins with >2000 counts | High rate bins dominated by noise | Noise dominated (total time) | Noise dominated (detector-on time) | Marked lightcurve |
|---|---|---|---|---|---|---|---|
| A | 57930 | 52355 | 15 | 15 | 0.03% | 0.03% |  |
| B | 57930 | 52351 | 624 | 624 | 1.08% | 1.19% |  |
| C | 57930 | 52355 | 0 | 0 | 0.00% | 0.00% |  |
| D | 57930 | 52354 | 176 | 176 | 0.30% | 0.34% |  |
Top three noisy pixels from each quadrant. If the there are fewer than three noisy pixels in the level2.evt file, extra rows are filled as -1
| Pixel properties | Quadrant properties | ||||||
|---|---|---|---|---|---|---|---|
| Quadrant | DetID | PixID | Counts | Sigma | Mean | Median | Sigma |
| A | 8 | 15 | 1025276 | 1809.29 | 2586 | 2530 | 565.3 |
| A | 1 | 162 | 629626 | 1109.36 | 2586 | 2530 | 565.3 |
| A | 0 | 23 | 150049 | 260.97 | 2586 | 2530 | 565.3 |
| B | 3 | 64 | 2136183 | 4330.95 | 2575 | 2501 | 492.7 |
| B | 4 | 239 | 1843987 | 3737.85 | 2575 | 2501 | 492.7 |
| B | 0 | 230 | 285076 | 573.57 | 2575 | 2501 | 492.7 |
| C | 3 | 0 | 68169 | 115.69 | 2571 | 2531 | 567.4 |
| C | 3 | 233 | 20833 | 32.26 | 2571 | 2531 | 567.4 |
| C | 8 | 128 | 17967 | 27.21 | 2571 | 2531 | 567.4 |
| D | 1 | 52 | 2203322 | 3659.96 | 2578 | 2478 | 601.3 |
| D | 8 | 195 | 643900 | 1066.67 | 2578 | 2478 | 601.3 |
| D | 13 | 104 | 371186 | 613.15 | 2578 | 2478 | 601.3 |
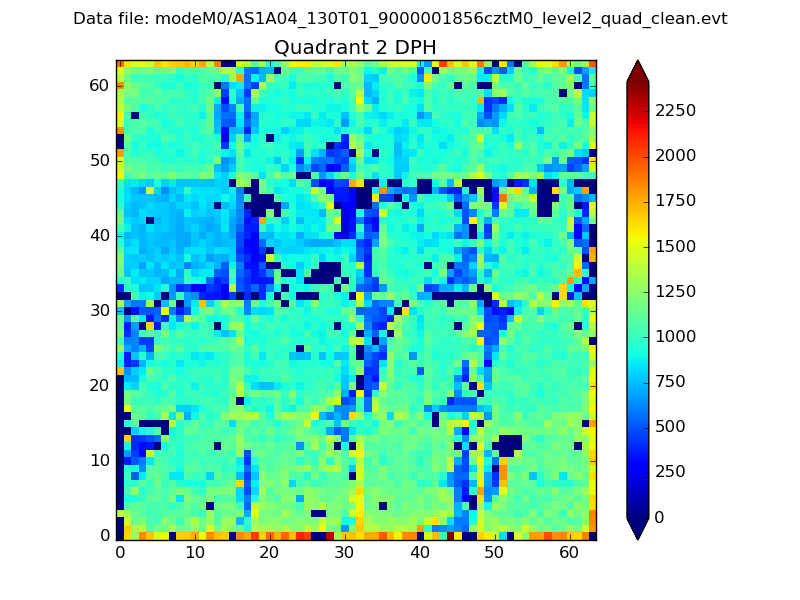
Histogram calculated using DETX and DETY for each event in the final _common_clean file
| Quadrant A |  |
 |
Quadrant B |
|---|---|---|---|
| Quadrant D |  |
 |
Quadrant C |
| Plot type | Count rate plots | Images |
|---|---|---|
| Comparison with Poisson distribution Blue bars denote a histogram of data divided into 1 sec bins. Red curve is a Poisson curve with rate = median count rate of data. |
 |
 |
| Quadrant-wise count rates Data is divided into 100 sec bins |
 |
|
| Module-wise count rates for Quadrant A Data is divided into 100 sec bins |
 |
 |
| Module-wise count rates for Quadrant B Data is divided into 100 sec bins |
 |
 |
| Module-wise count rates for Quadrant C Data is divided into 100 sec bins |
 |
 |
| Module-wise count rates for Quadrant D Data is divided into 100 sec bins |
 |
 |
| Parameter | Plot |
|---|---|
| CZT HV Monitor |  |
| D_VDD | 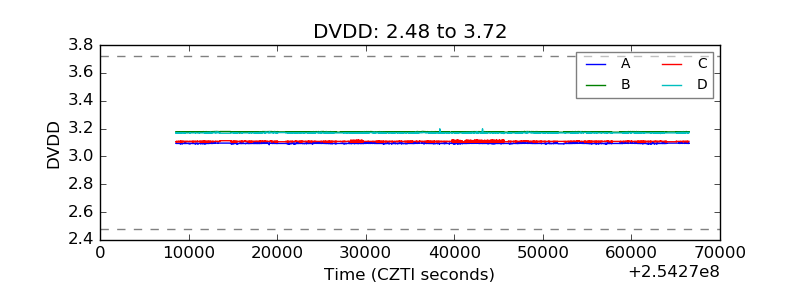 |
| Temperature 1 |  |
| Veto HV Monitor |  |
| Veto LLD |  |
| Alpha Counter |  |
| _CPM_Rate |  |
| CZT Counter |  |
| +2.5 Volts monitor |  |
| +5 Volts monitor |  |
| _ROLL_ROT |  |
| _Roll_DEC |  |
| _Roll_RA |  |
| Veto Counter |  |