| Param | Original file | Final file |
|---|---|---|
| Filename | modeM0/AS1G06_067T01_9000001860cztM0_level2_bc.evt | modeM0/AS1G06_067T01_9000001860cztM0_level2_quad_clean.evt |
| Size (bytes) | 549,408,960 | 228,623,040 |
| Size | 524.0 MB | 218.0 MB |
| Events in quadrant A | 3,729,499 | 1,464,115 |
| Events in quadrant B | 3,856,824 | 1,515,176 |
| Events in quadrant C | 3,434,002 | 1,480,732 |
| Events in quadrant D | 4,533,126 | 1,372,512 |
| Mode SS | |||
|---|---|---|---|
| Quadrant | BADHDUFLAG | Total packets | Discarded packets |
| A | 0 | 322 | 0 |
| B | 0 | 322 | 0 |
| C | 0 | 322 | 0 |
| D | 0 | 322 | 0 |
| Mode M9 | |||
|---|---|---|---|
| Quadrant | BADHDUFLAG | Total packets | Discarded packets |
| A | 0 | 46 | 0 |
| B | 0 | 46 | 0 |
| C | 0 | 46 | 0 |
| D | 0 | 46 | 0 |
| Mode M0 | |||
|---|---|---|---|
| Quadrant | BADHDUFLAG | Total packets | Discarded packets |
| A | 0 | 34376 | 0 |
| B | 0 | 34609 | 0 |
| C | 0 | 33083 | 0 |
| D | 0 | 36993 | 0 |
| Quadrant | Total seconds | Saturated seconds | Saturation percentage |
|---|---|---|---|
| A | 15837 | 100 | 0.631433% |
| B | 15837 | 183 | 1.155522% |
| C | 15837 | 104 | 0.656690% |
| D | 15837 | 248 | 1.565953% |
Noise dominated data is calculated using 1-second bins in cleaned event files. If a bin has >2000 counts, and if more than 50% of those come from <1% of pixels, then it is considered to be noise-dominated and hence unusable.
| Quadrant | # 1 sec bins | Bins with >0 counts | Bins with >2000 counts | High rate bins dominated by noise | Noise dominated (total time) | Noise dominated (detector-on time) | Marked lightcurve |
|---|---|---|---|---|---|---|---|
| A | 19792 | 15838 | 0 | 0 | 0.00% | 0.00% | 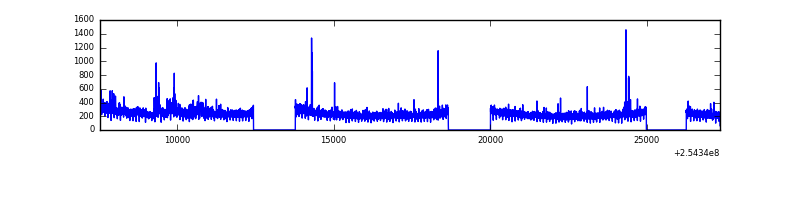 |
| B | 19792 | 15837 | 0 | 0 | 0.00% | 0.00% |  |
| C | 19792 | 15837 | 6 | 6 | 0.03% | 0.04% | 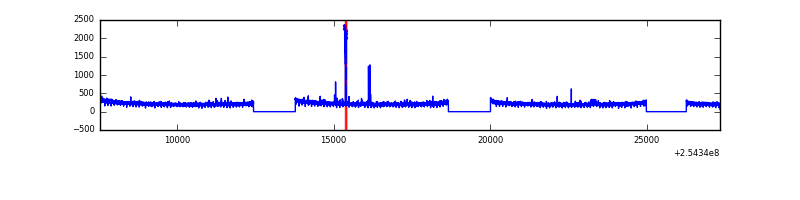 |
| D | 19792 | 15837 | 22 | 22 | 0.11% | 0.14% |  |
Top three noisy pixels from each quadrant. If the there are fewer than three noisy pixels in the level2.evt file, extra rows are filled as -1
| Pixel properties | Quadrant properties | ||||||
|---|---|---|---|---|---|---|---|
| Quadrant | DetID | PixID | Counts | Sigma | Mean | Median | Sigma |
| A | 1 | 162 | 151524 | 801.99 | 862 | 847 | 187.9 |
| A | 0 | 23 | 125674 | 664.4 | 862 | 847 | 187.9 |
| A | 8 | 15 | 70453 | 370.48 | 862 | 847 | 187.9 |
| B | 4 | 239 | 143867 | 874.48 | 886 | 866 | 163.5 |
| B | 11 | 51 | 104844 | 635.85 | 886 | 866 | 163.5 |
| B | 0 | 205 | 82720 | 500.55 | 886 | 866 | 163.5 |
| C | 15 | 208 | 46042 | 239.04 | 860 | 850 | 189.1 |
| C | 3 | 233 | 18432 | 93.0 | 860 | 850 | 189.1 |
| C | 9 | 221 | 6778 | 31.36 | 860 | 850 | 189.1 |
| D | 1 | 52 | 746291 | 3876.67 | 840 | 813 | 192.3 |
| D | 8 | 195 | 213369 | 1105.34 | 840 | 813 | 192.3 |
| D | 13 | 104 | 154447 | 798.94 | 840 | 813 | 192.3 |
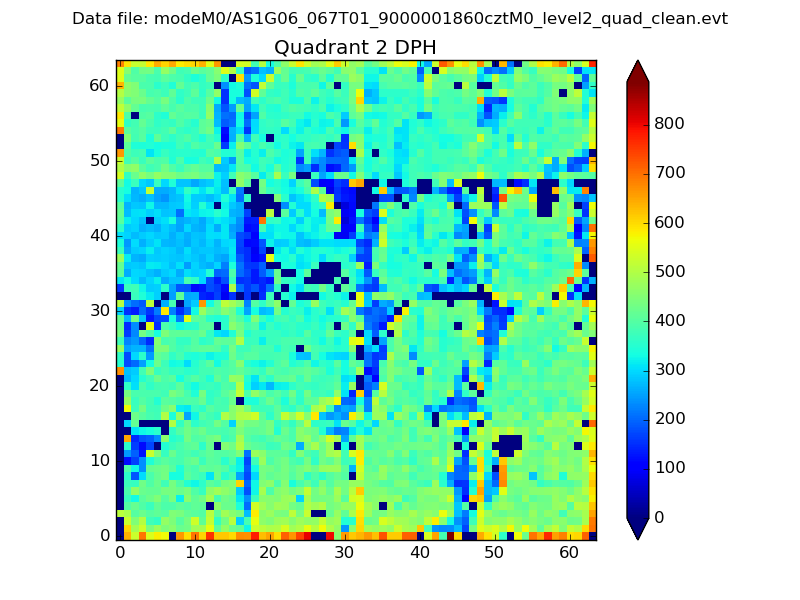
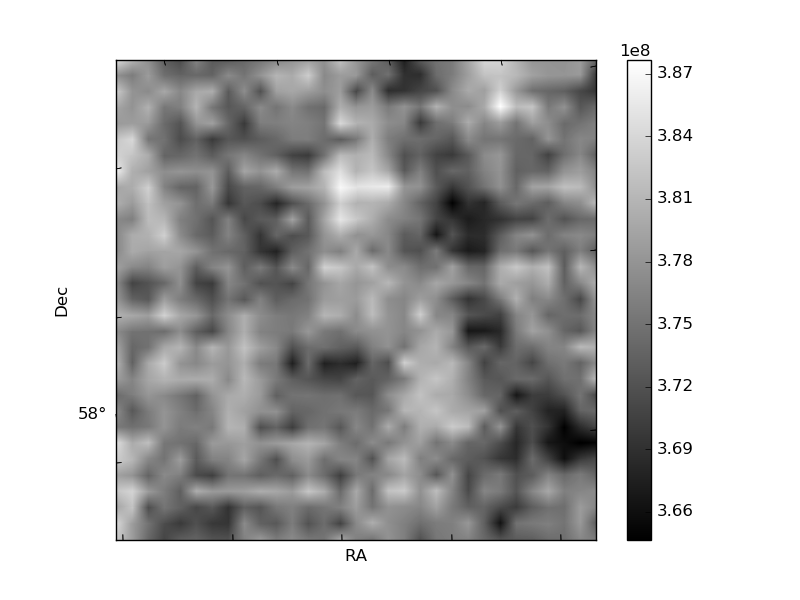
Histogram calculated using DETX and DETY for each event in the final _common_clean file
| Quadrant A | 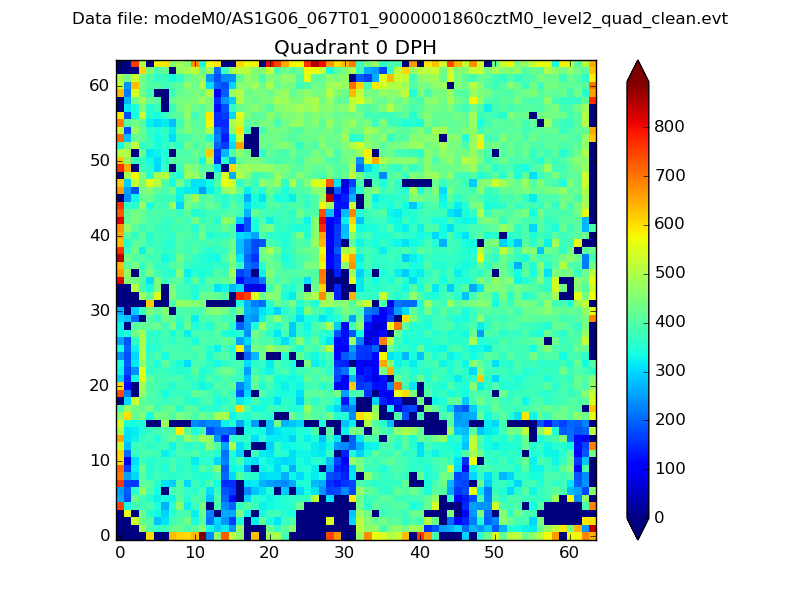 |
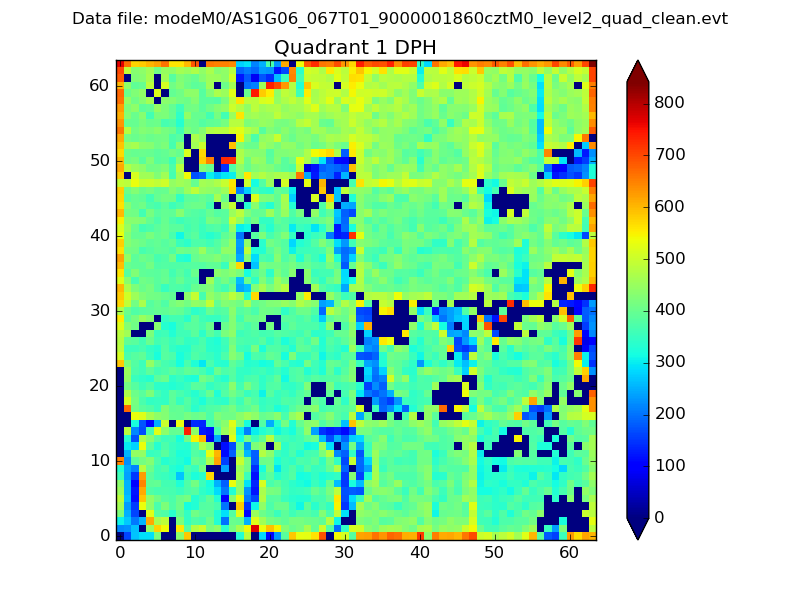 |
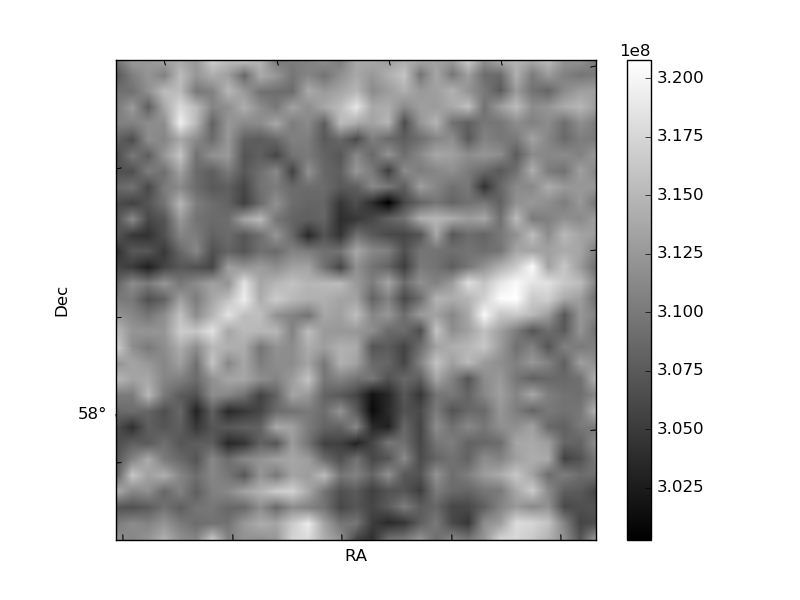
Quadrant B |
|---|---|---|---|
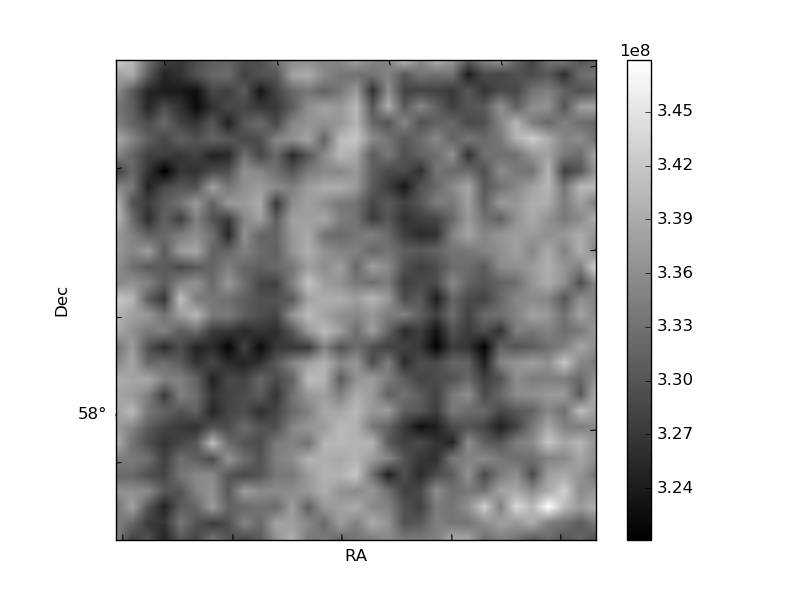
| Quadrant D | 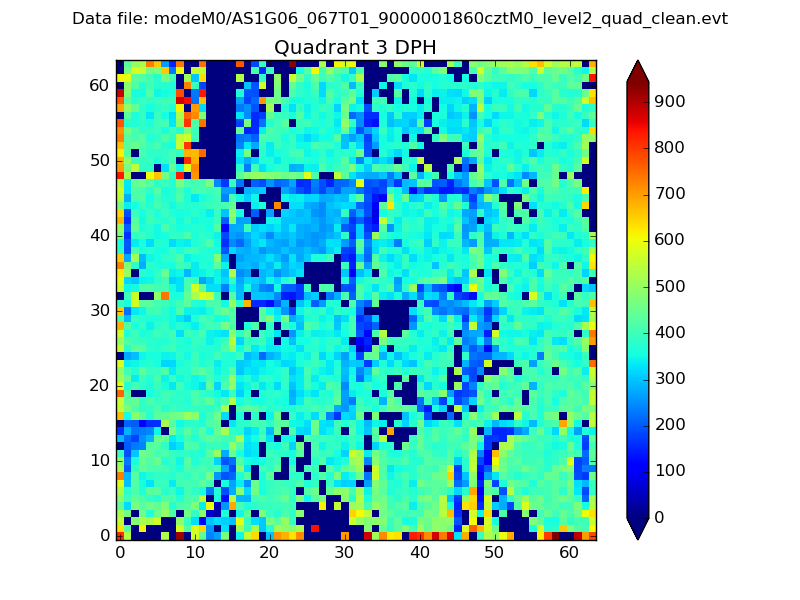 |
 |
Quadrant C |
| Plot type | Count rate plots | Images |
|---|---|---|
| Comparison with Poisson distribution Blue bars denote a histogram of data divided into 1 sec bins. Red curve is a Poisson curve with rate = median count rate of data. |
 |
 |
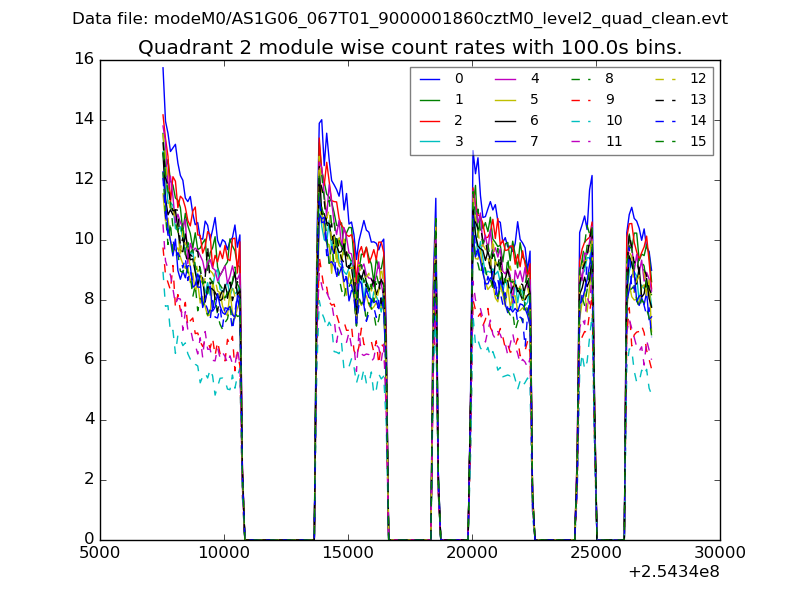
| Quadrant-wise count rates Data is divided into 100 sec bins |
 |
|
| Module-wise count rates for Quadrant A Data is divided into 100 sec bins |
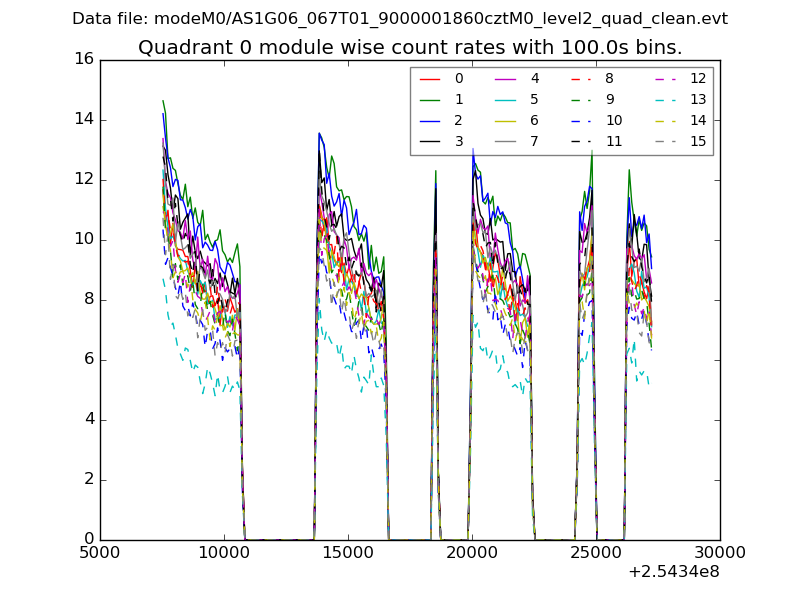 |
 |
| Module-wise count rates for Quadrant B Data is divided into 100 sec bins |
 |
 |
| Module-wise count rates for Quadrant C Data is divided into 100 sec bins |
 |
 |
| Module-wise count rates for Quadrant D Data is divided into 100 sec bins |
 |
 |
| Parameter | Plot |
|---|---|
| CZT HV Monitor |  |
| D_VDD | 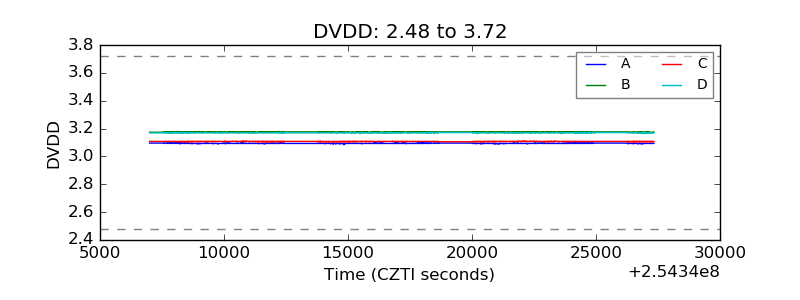 |
| Temperature 1 | 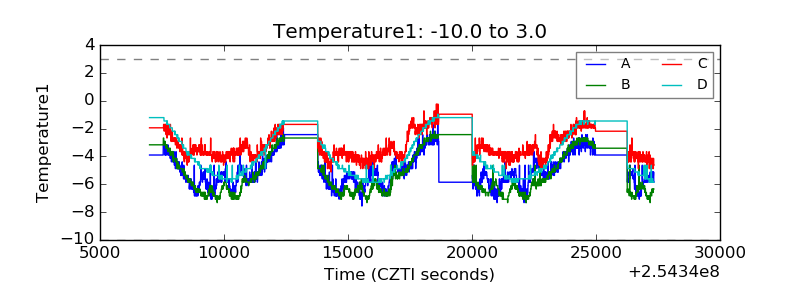 |
| Veto HV Monitor | 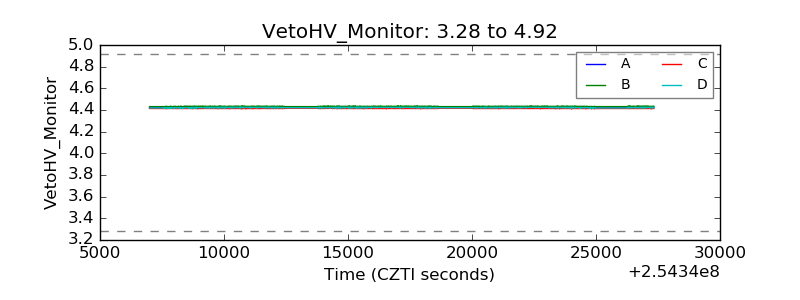 |
| Veto LLD | 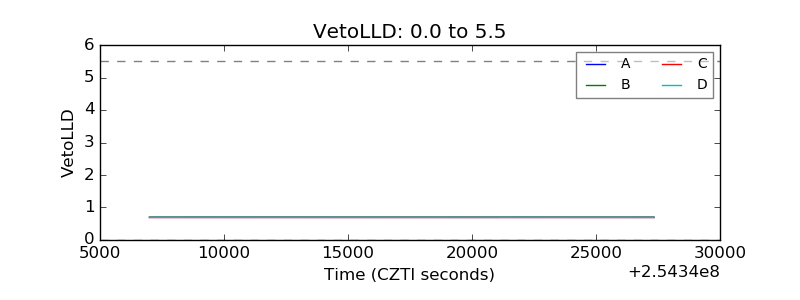 |
| Alpha Counter | 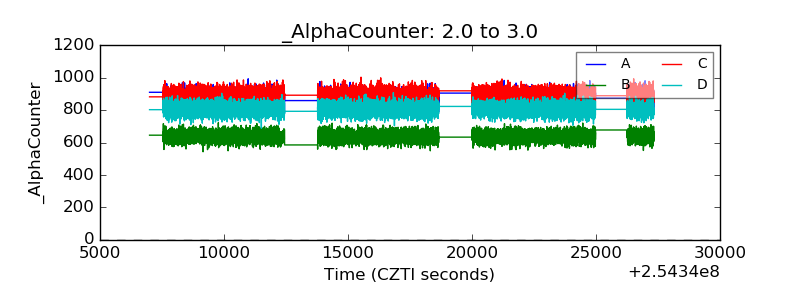 |
| _CPM_Rate | 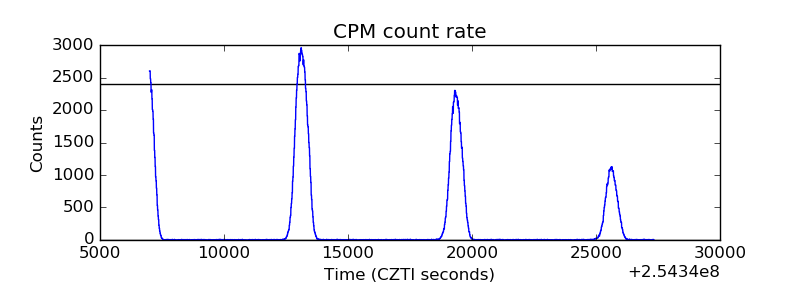 |
| CZT Counter | 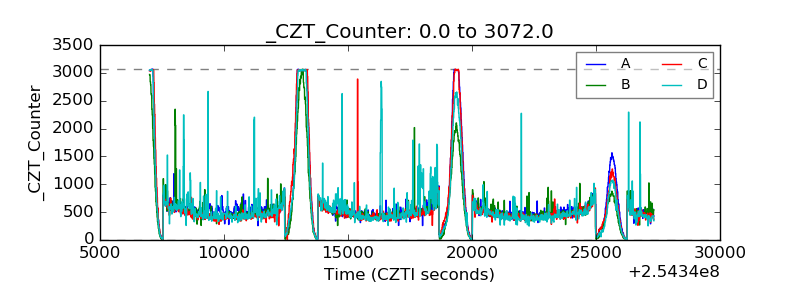 |
| +2.5 Volts monitor | 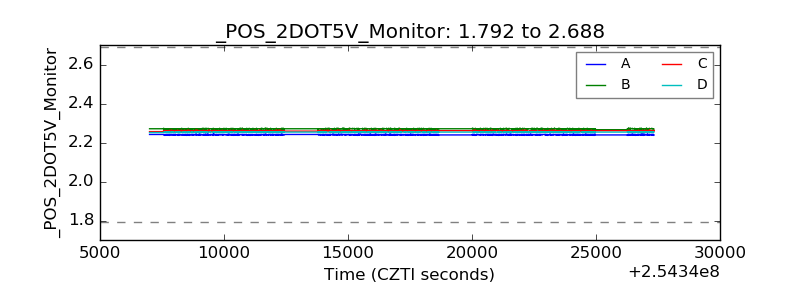 |
| +5 Volts monitor | 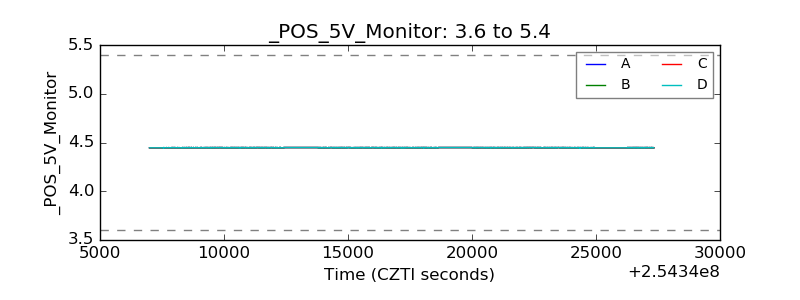 |
| _ROLL_ROT | 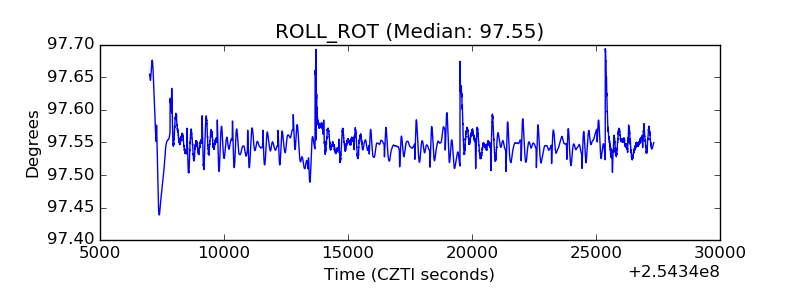 |
| _Roll_DEC | 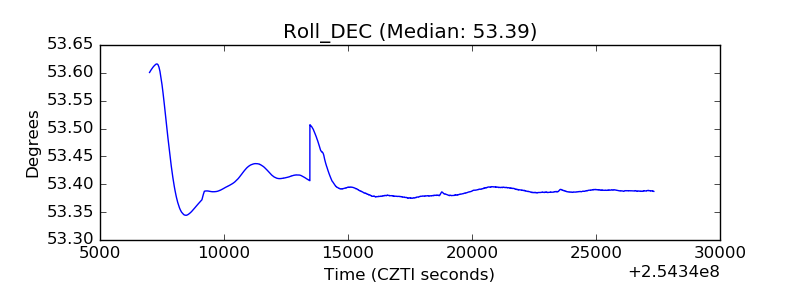 |
| _Roll_RA | 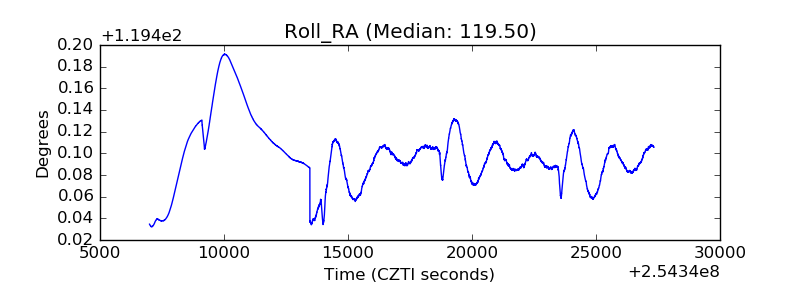 |
| Veto Counter | 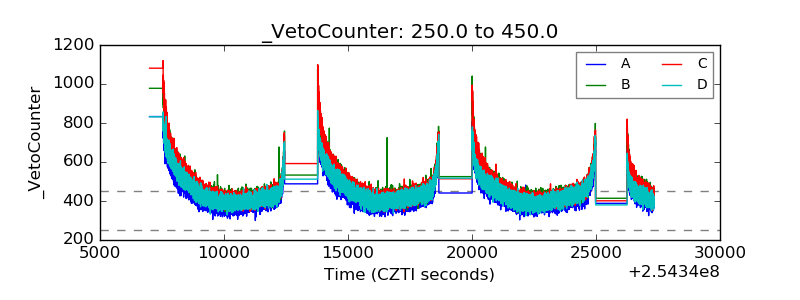 |