| Param | Original file | Final file |
|---|---|---|
| Filename | modeM0/AS1A04_201T03_9000001862cztM0_level2_bc.evt | modeM0/AS1A04_201T03_9000001862cztM0_level2_quad_clean.evt |
| Size (bytes) | 1,042,470,720 | 366,511,680 |
| Size | 994.2 MB | 349.5 MB |
| Events in quadrant A | 6,266,846 | 2,237,385 |
| Events in quadrant B | 8,135,546 | 2,288,283 |
| Events in quadrant C | 6,062,008 | 2,263,137 |
| Events in quadrant D | 8,959,167 | 2,152,258 |
| Mode M0 | |||
|---|---|---|---|
| Quadrant | BADHDUFLAG | Total packets | Discarded packets |
| A | 0 | 65390 | 0 |
| B | 0 | 72646 | 0 |
| C | 0 | 64715 | 0 |
| D | 0 | 73246 | 0 |
| Mode M9 | |||
|---|---|---|---|
| Quadrant | BADHDUFLAG | Total packets | Discarded packets |
| A | 0 | 19 | 0 |
| B | 0 | 19 | 0 |
| C | 0 | 19 | 0 |
| D | 0 | 19 | 0 |
| Mode SS | |||
|---|---|---|---|
| Quadrant | BADHDUFLAG | Total packets | Discarded packets |
| A | 0 | 638 | 0 |
| B | 0 | 638 | 0 |
| C | 0 | 638 | 0 |
| D | 0 | 638 | 0 |
| Quadrant | Total seconds | Saturated seconds | Saturation percentage |
|---|---|---|---|
| A | 31412 | 730 | 2.323953% |
| B | 31413 | 1229 | 3.912393% |
| C | 31413 | 486 | 1.547130% |
| D | 31412 | 888 | 2.826945% |
Noise dominated data is calculated using 1-second bins in cleaned event files. If a bin has >2000 counts, and if more than 50% of those come from <1% of pixels, then it is considered to be noise-dominated and hence unusable.
| Quadrant | # 1 sec bins | Bins with >0 counts | Bins with >2000 counts | High rate bins dominated by noise | Noise dominated (total time) | Noise dominated (detector-on time) | Marked lightcurve |
|---|---|---|---|---|---|---|---|
| A | 33594 | 31414 | 2 | 2 | 0.01% | 0.01% | 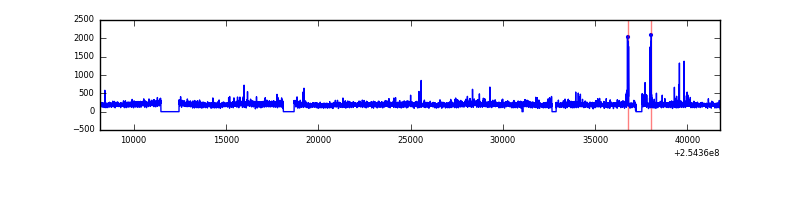 |
| B | 33594 | 31414 | 40 | 40 | 0.12% | 0.13% | 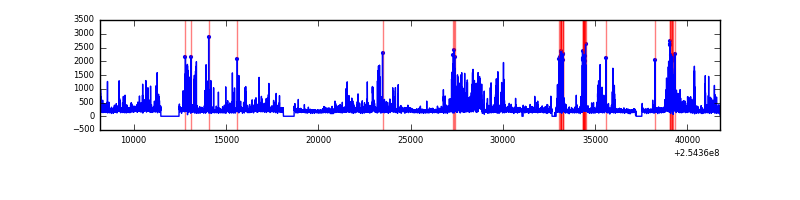 |
| C | 33594 | 31417 | 1 | 1 | 0.00% | 0.00% | 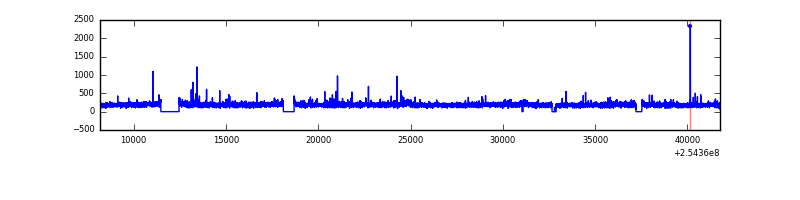 |
| D | 33594 | 31414 | 59 | 59 | 0.18% | 0.19% | 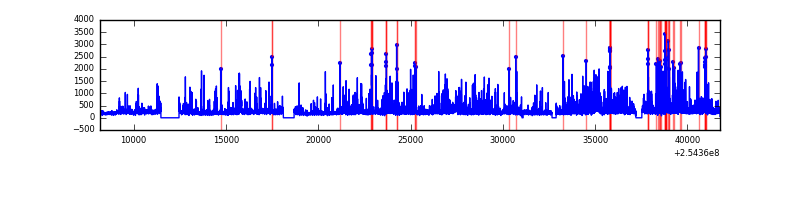 |
Top three noisy pixels from each quadrant. If the there are fewer than three noisy pixels in the level2.evt file, extra rows are filled as -1
| Pixel properties | Quadrant properties | ||||||
|---|---|---|---|---|---|---|---|
| Quadrant | DetID | PixID | Counts | Sigma | Mean | Median | Sigma |
| A | 8 | 15 | 102105 | 298.35 | 1534 | 1496 | 337.2 |
| A | 1 | 162 | 100330 | 293.09 | 1534 | 1496 | 337.2 |
| A | 13 | 248 | 93053 | 271.51 | 1534 | 1496 | 337.2 |
| B | 4 | 239 | 1432388 | 4812.76 | 1549 | 1508 | 297.3 |
| B | 0 | 214 | 156473 | 521.22 | 1549 | 1508 | 297.3 |
| B | 0 | 205 | 116594 | 387.09 | 1549 | 1508 | 297.3 |
| C | 3 | 233 | 63210 | 185.0 | 1517 | 1491 | 333.6 |
| C | 15 | 208 | 27360 | 77.54 | 1517 | 1491 | 333.6 |
| C | 14 | 234 | 14362 | 38.58 | 1517 | 1491 | 333.6 |
| D | 1 | 52 | 1821838 | 5190.63 | 1506 | 1445 | 350.7 |
| D | 11 | 176 | 344809 | 979.06 | 1506 | 1445 | 350.7 |
| D | 8 | 195 | 287995 | 817.06 | 1506 | 1445 | 350.7 |
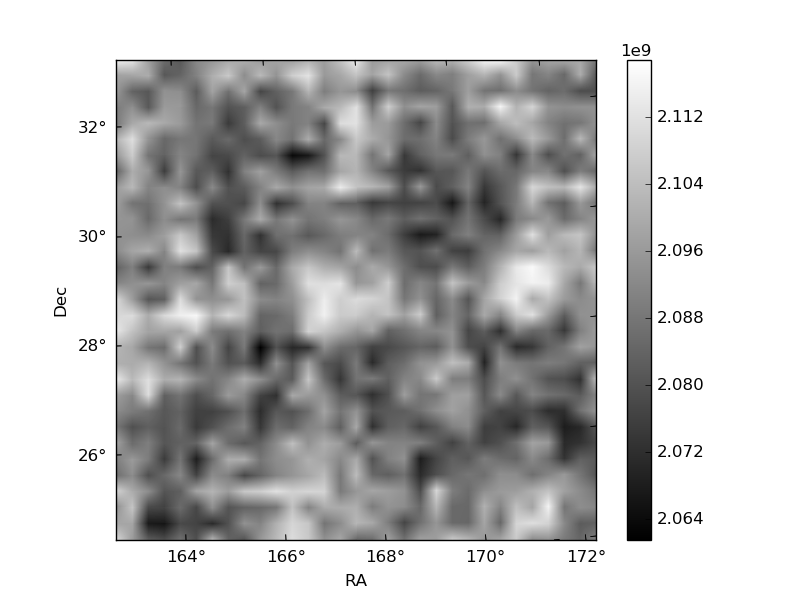
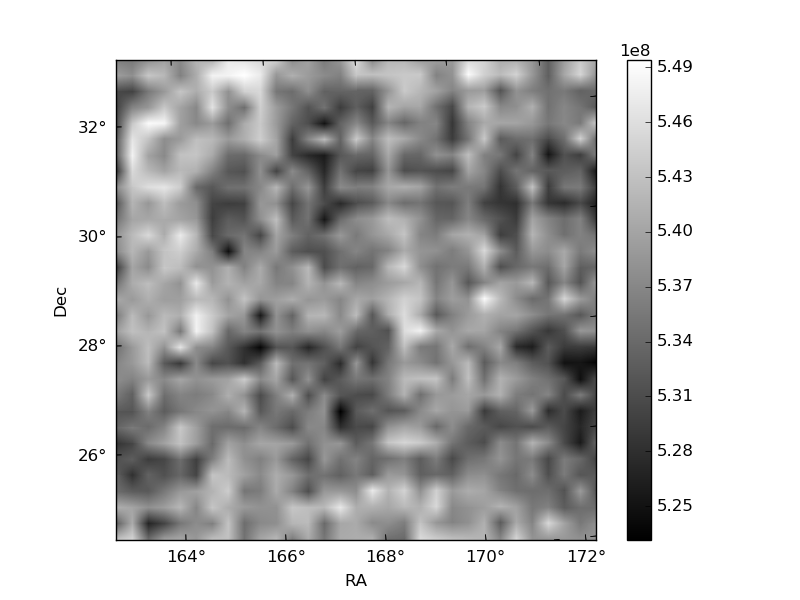
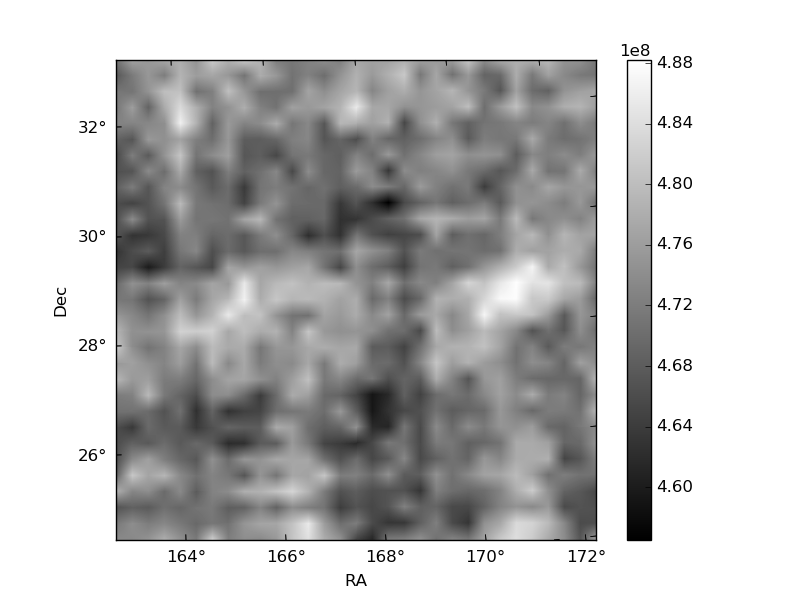
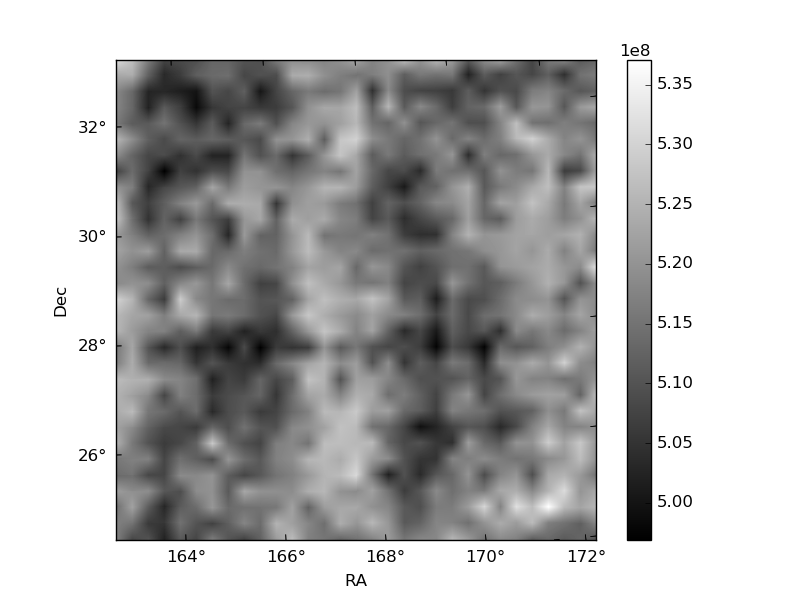
Histogram calculated using DETX and DETY for each event in the final _common_clean file
| Quadrant A | 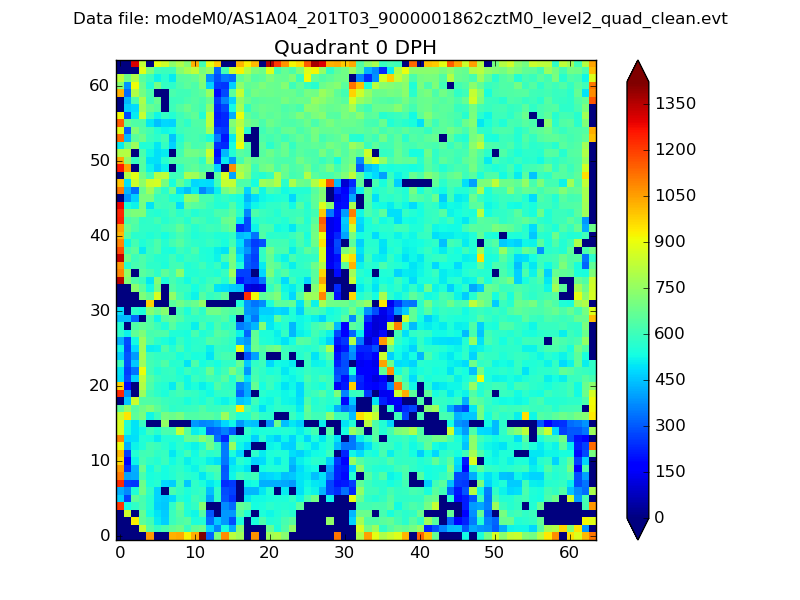 |
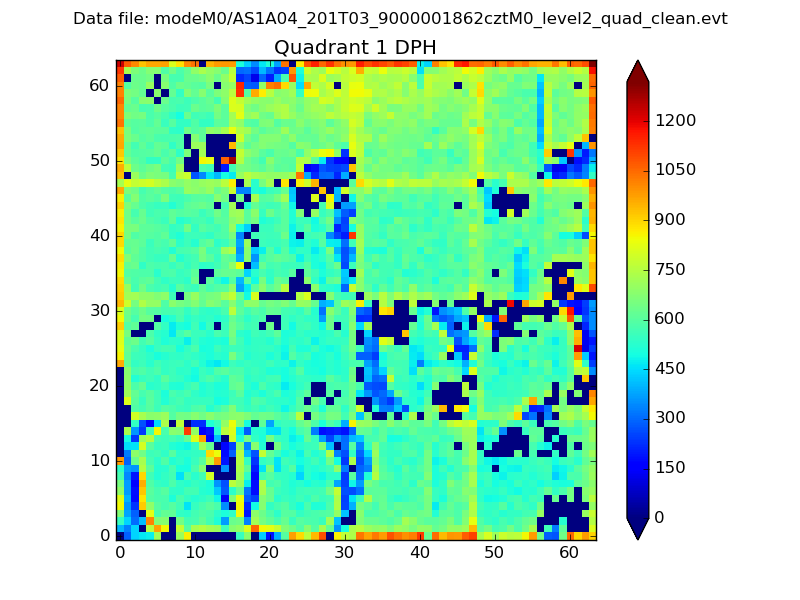 |
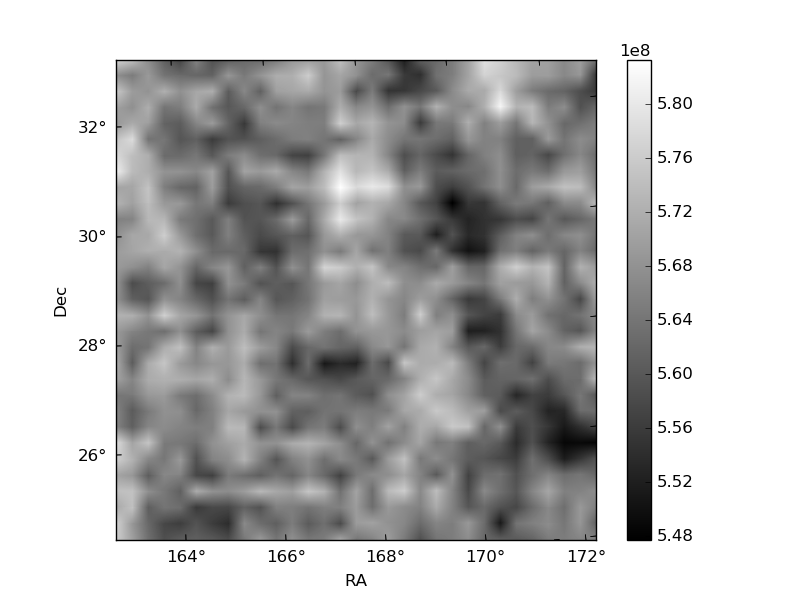
Quadrant B |
|---|---|---|---|
| Quadrant D | 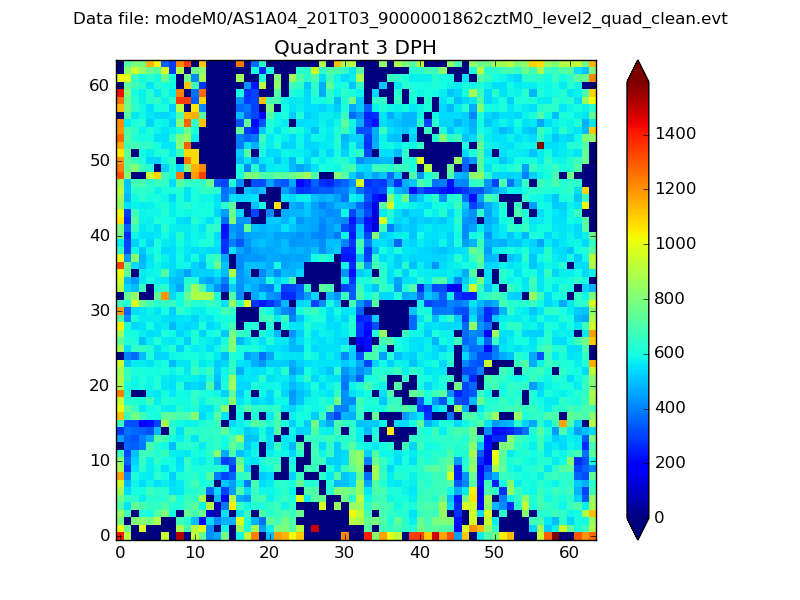 |
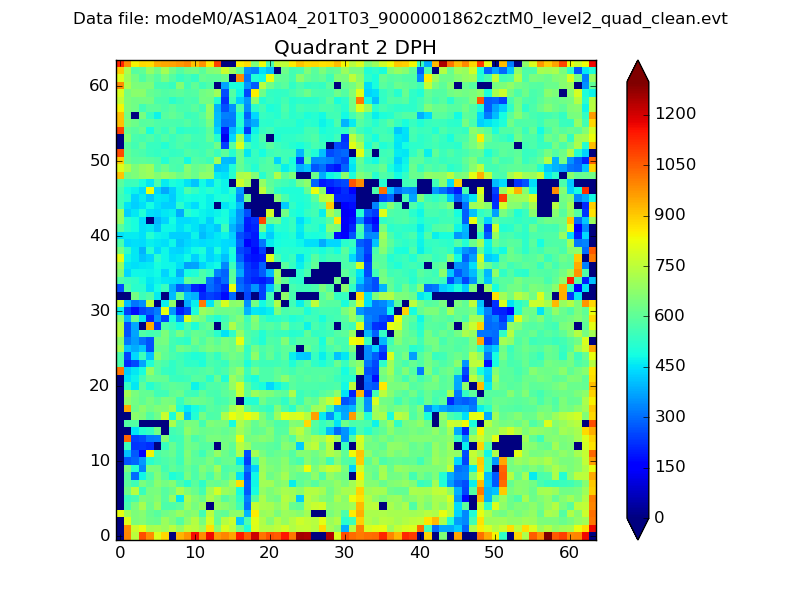 |
Quadrant C |
| Plot type | Count rate plots | Images |
|---|---|---|
| Comparison with Poisson distribution Blue bars denote a histogram of data divided into 1 sec bins. Red curve is a Poisson curve with rate = median count rate of data. |
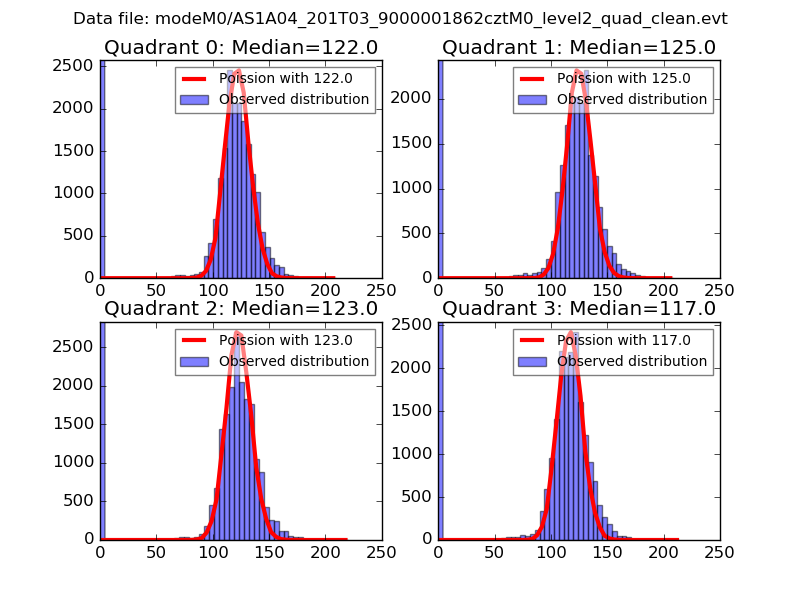 |
 |
| Quadrant-wise count rates Data is divided into 100 sec bins |
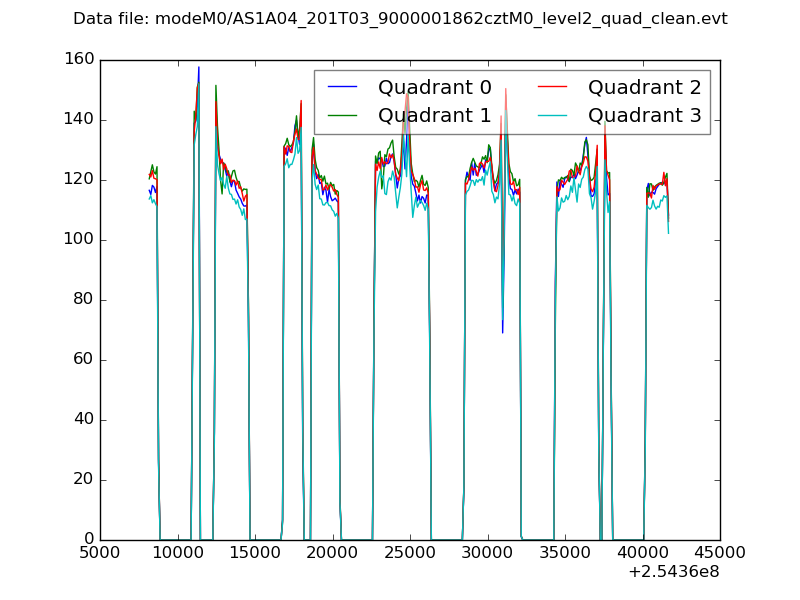 |
|
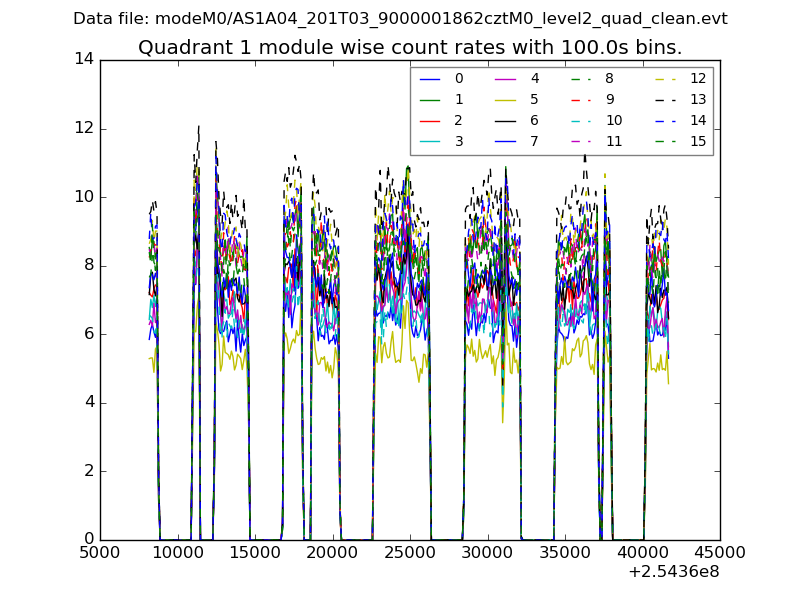
| Module-wise count rates for Quadrant A Data is divided into 100 sec bins |
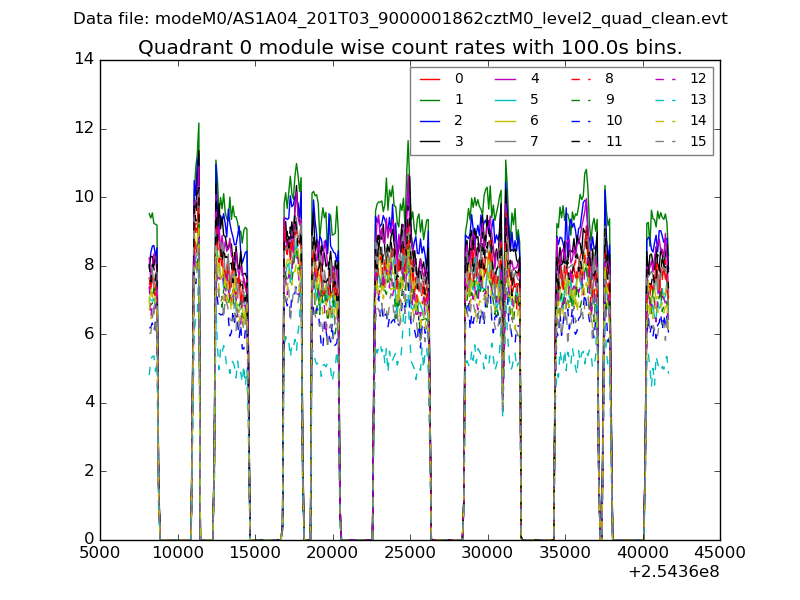 |
 |
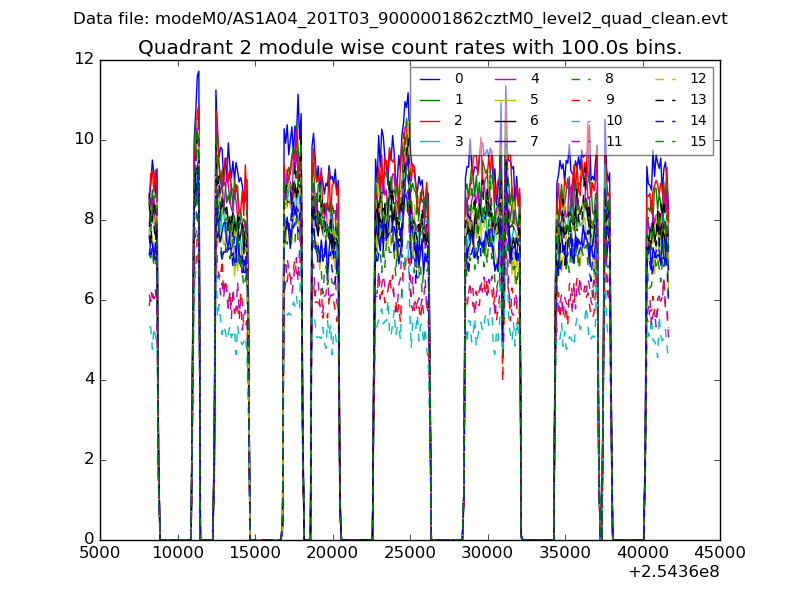
| Module-wise count rates for Quadrant B Data is divided into 100 sec bins |
 |
 |
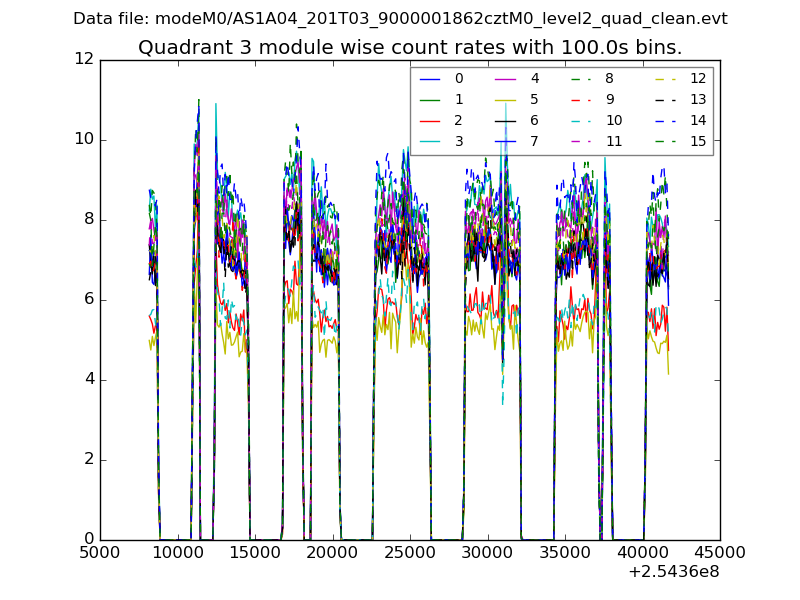
| Module-wise count rates for Quadrant C Data is divided into 100 sec bins |
 |
 |
| Module-wise count rates for Quadrant D Data is divided into 100 sec bins |
 |
 |
| Parameter | Plot |
|---|---|
| CZT HV Monitor | 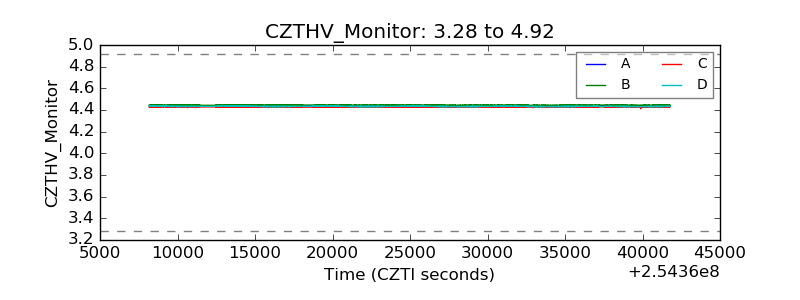 |
| D_VDD | 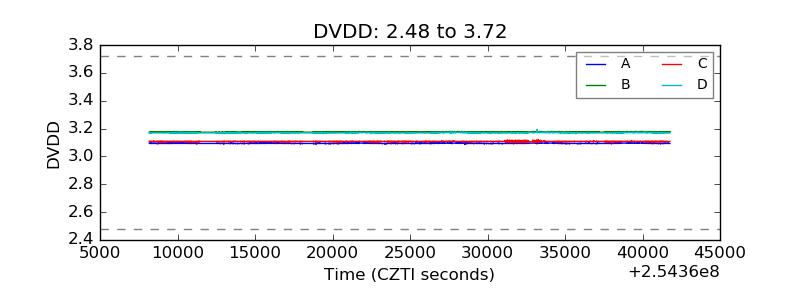 |
| Temperature 1 | 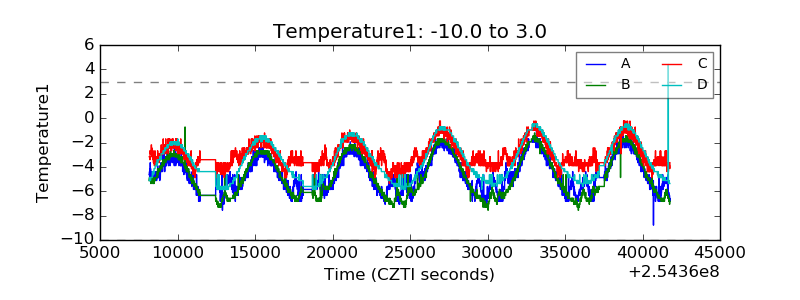 |
| Veto HV Monitor | 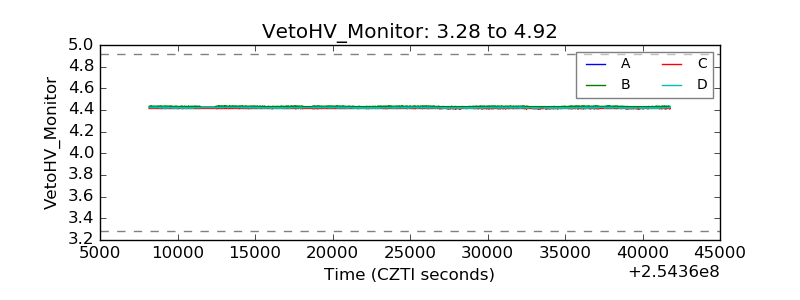 |
| Veto LLD | 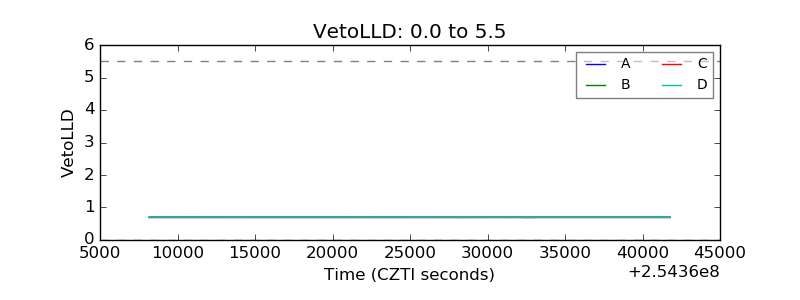 |
| Alpha Counter | 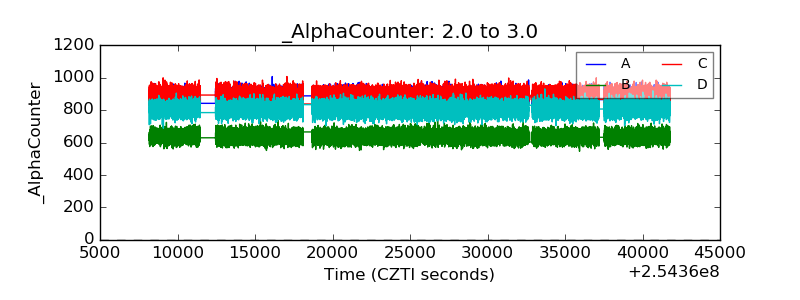 |
| _CPM_Rate | 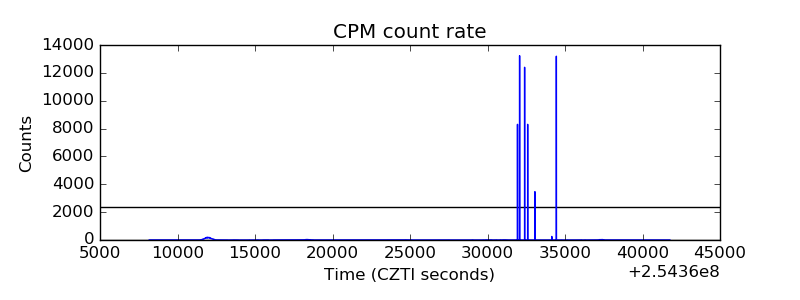 |
| CZT Counter | 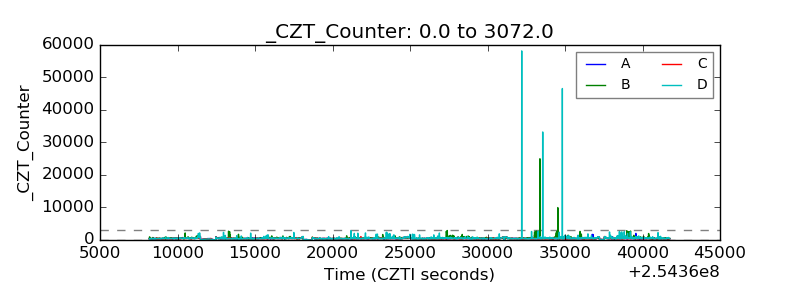 |
| +2.5 Volts monitor | 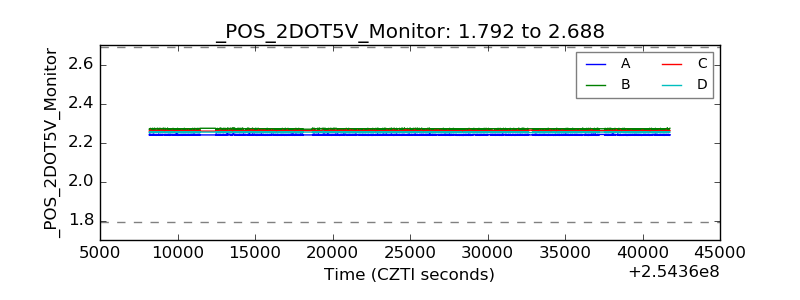 |
| +5 Volts monitor | 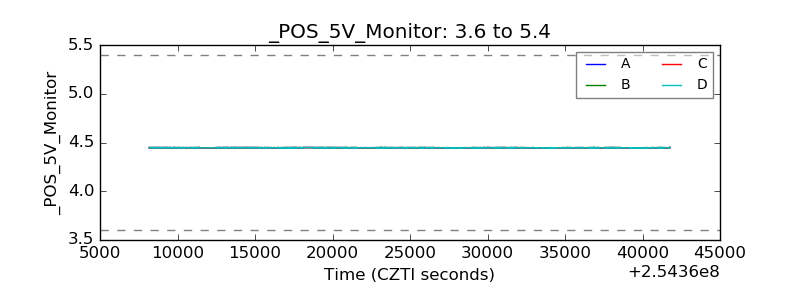 |
| _ROLL_ROT | 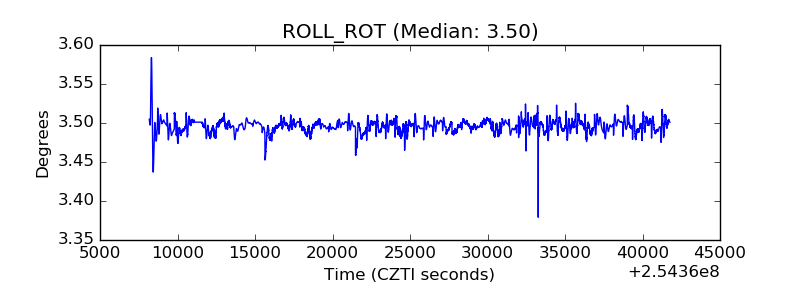 |
| _Roll_DEC | 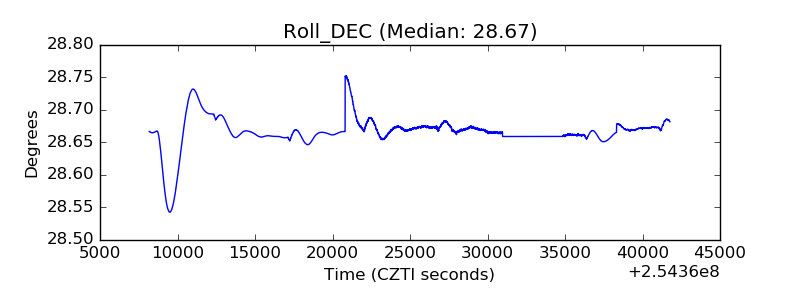 |
| _Roll_RA | 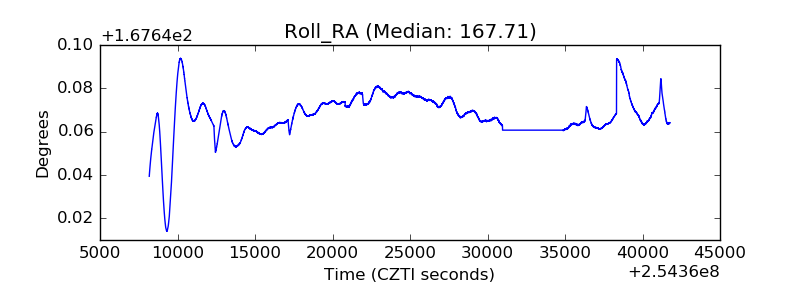 |
| Veto Counter | 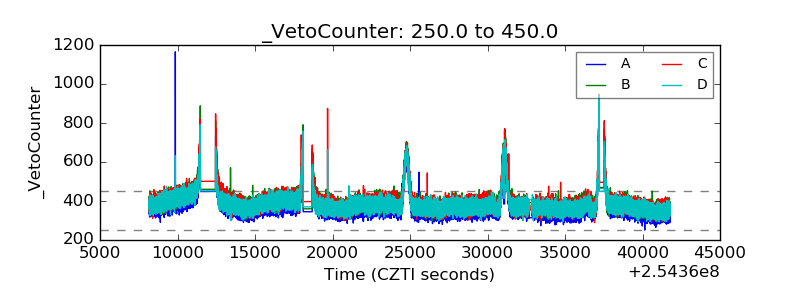 |