| Param | Original file | Final file |
|---|---|---|
| Filename | modeM0/AS1A04_085T01_9000001868cztM0_level2_bc.evt | modeM0/AS1A04_085T01_9000001868cztM0_level2_quad_clean.evt |
| Size (bytes) | 442,869,120 | 210,185,280 |
| Size | 422.4 MB | 200.4 MB |
| Events in quadrant A | 2,855,472 | 1,347,561 |
| Events in quadrant B | 3,081,263 | 1,388,374 |
| Events in quadrant C | 3,011,468 | 1,351,429 |
| Events in quadrant D | 3,491,095 | 1,300,892 |
| Mode M9 | |||
|---|---|---|---|
| Quadrant | BADHDUFLAG | Total packets | Discarded packets |
| A | 0 | 29 | 0 |
| B | 0 | 29 | 0 |
| C | 0 | 29 | 0 |
| D | 0 | 29 | 0 |
| Mode M0 | |||
|---|---|---|---|
| Quadrant | BADHDUFLAG | Total packets | Discarded packets |
| A | 0 | 29400 | 0 |
| B | 0 | 30189 | 0 |
| C | 0 | 29846 | 0 |
| D | 0 | 31142 | 0 |
| Mode SS | |||
|---|---|---|---|
| Quadrant | BADHDUFLAG | Total packets | Discarded packets |
| A | 0 | 290 | 0 |
| B | 0 | 290 | 0 |
| C | 0 | 290 | 0 |
| D | 0 | 290 | 0 |
| Quadrant | Total seconds | Saturated seconds | Saturation percentage |
|---|---|---|---|
| A | 14163 | 156 | 1.101462% |
| B | 14163 | 223 | 1.574525% |
| C | 14163 | 155 | 1.094401% |
| D | 14163 | 239 | 1.687496% |
Noise dominated data is calculated using 1-second bins in cleaned event files. If a bin has >2000 counts, and if more than 50% of those come from <1% of pixels, then it is considered to be noise-dominated and hence unusable.
| Quadrant | # 1 sec bins | Bins with >0 counts | Bins with >2000 counts | High rate bins dominated by noise | Noise dominated (total time) | Noise dominated (detector-on time) | Marked lightcurve |
|---|---|---|---|---|---|---|---|
| A | 17154 | 14161 | 0 | 0 | 0.00% | 0.00% |  |
| B | 17154 | 14161 | 9 | 9 | 0.05% | 0.06% | 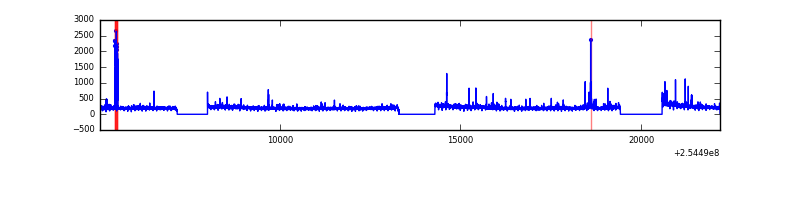 |
| C | 17154 | 14161 | 6 | 6 | 0.03% | 0.04% | 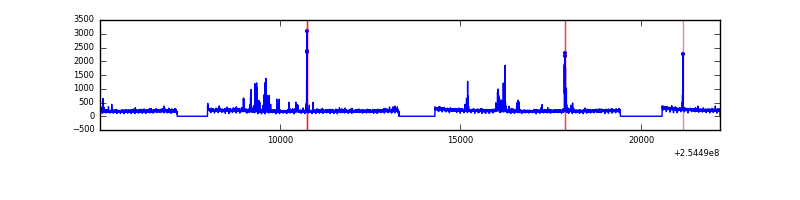 |
| D | 17154 | 14161 | 23 | 23 | 0.13% | 0.16% |  |
Top three noisy pixels from each quadrant. If the there are fewer than three noisy pixels in the level2.evt file, extra rows are filled as -1
| Pixel properties | Quadrant properties | ||||||
|---|---|---|---|---|---|---|---|
| Quadrant | DetID | PixID | Counts | Sigma | Mean | Median | Sigma |
| A | 12 | 189 | 28468 | 174.13 | 724 | 710 | 159.4 |
| A | 12 | 96 | 13286 | 78.89 | 724 | 710 | 159.4 |
| A | 3 | 1 | 9406 | 54.55 | 724 | 710 | 159.4 |
| B | 3 | 64 | 134828 | 944.47 | 740 | 721 | 142.0 |
| B | 3 | 209 | 46646 | 323.43 | 740 | 721 | 142.0 |
| B | 0 | 214 | 26487 | 181.46 | 740 | 721 | 142.0 |
| C | 15 | 208 | 177163 | 1111.57 | 714 | 704 | 158.7 |
| C | 14 | 234 | 23164 | 141.48 | 714 | 704 | 158.7 |
| C | 14 | 67 | 11327 | 66.92 | 714 | 704 | 158.7 |
| D | 1 | 52 | 427670 | 2529.41 | 717 | 690 | 168.8 |
| D | 13 | 249 | 107212 | 631.03 | 717 | 690 | 168.8 |
| D | 2 | 234 | 54812 | 320.61 | 717 | 690 | 168.8 |
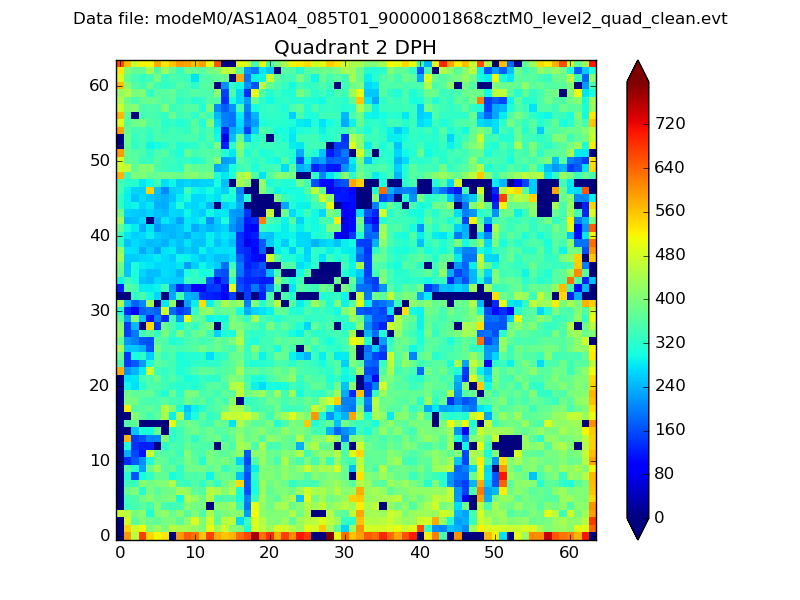
Histogram calculated using DETX and DETY for each event in the final _common_clean file
| Quadrant A | 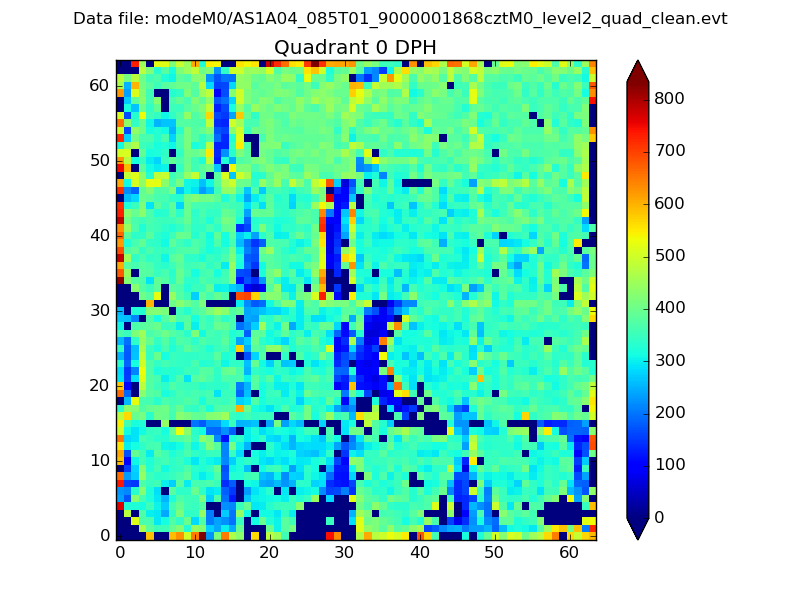 |
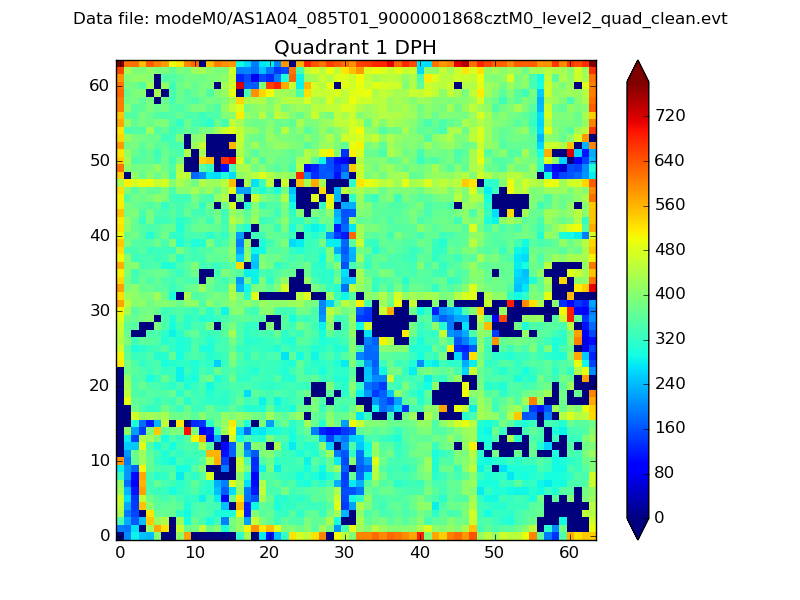 |
Quadrant B |
|---|---|---|---|
| Quadrant D |  |
 |
Quadrant C |
| Plot type | Count rate plots | Images |
|---|---|---|
| Comparison with Poisson distribution Blue bars denote a histogram of data divided into 1 sec bins. Red curve is a Poisson curve with rate = median count rate of data. |
 |
 |
| Quadrant-wise count rates Data is divided into 100 sec bins |
 |
|
| Module-wise count rates for Quadrant A Data is divided into 100 sec bins |
 |
 |
| Module-wise count rates for Quadrant B Data is divided into 100 sec bins |
 |
 |
| Module-wise count rates for Quadrant C Data is divided into 100 sec bins |
 |
 |
| Module-wise count rates for Quadrant D Data is divided into 100 sec bins |
 |
 |
| Parameter | Plot |
|---|---|
| CZT HV Monitor | 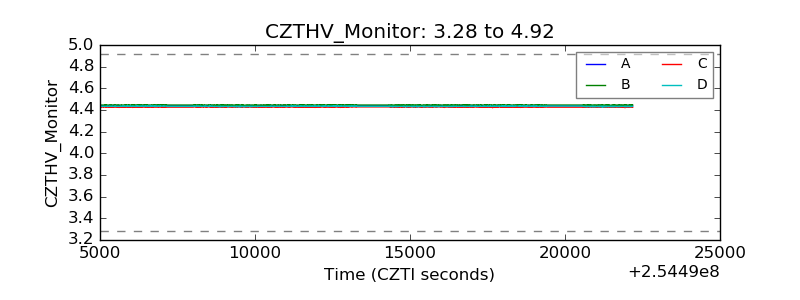 |
| D_VDD | 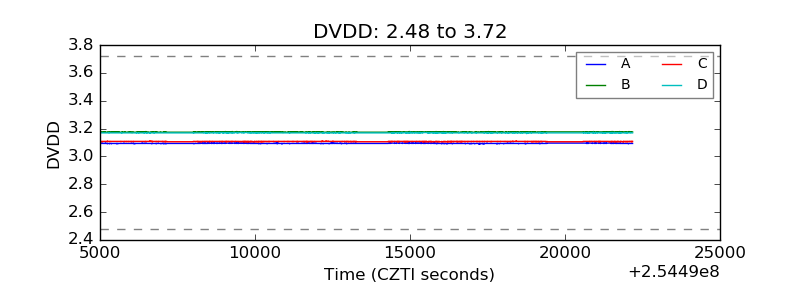 |
| Temperature 1 |  |
| Veto HV Monitor |  |
| Veto LLD | 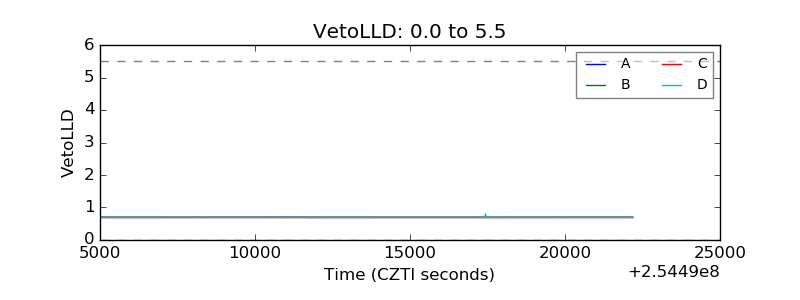 |
| Alpha Counter |  |
| _CPM_Rate |  |
| CZT Counter |  |
| +2.5 Volts monitor |  |
| +5 Volts monitor |  |
| _ROLL_ROT | 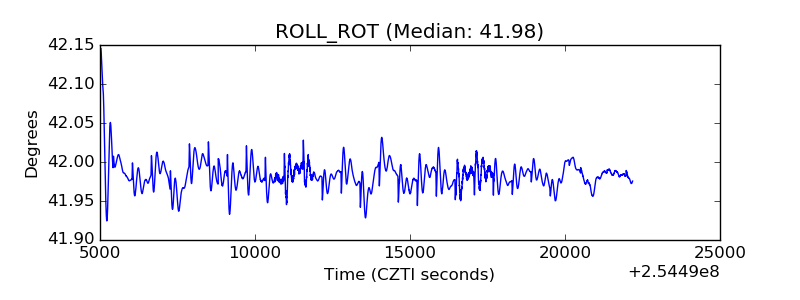 |
| _Roll_DEC |  |
| _Roll_RA |  |
| Veto Counter |  |