| Param | Original file | Final file |
|---|---|---|
| Filename | modeM0/AS1A04_212T03_9000001866cztM0_level2_bc.evt | modeM0/AS1A04_212T03_9000001866cztM0_level2_quad_clean.evt |
| Size (bytes) | 369,656,640 | 140,584,320 |
| Size | 352.5 MB | 134.1 MB |
| Events in quadrant A | 2,443,497 | 855,877 |
| Events in quadrant B | 2,626,093 | 868,568 |
| Events in quadrant C | 2,410,527 | 850,332 |
| Events in quadrant D | 2,852,361 | 816,023 |
| Mode M9 | |||
|---|---|---|---|
| Quadrant | BADHDUFLAG | Total packets | Discarded packets |
| A | 0 | 11 | 0 |
| B | 0 | 11 | 0 |
| C | 0 | 11 | 0 |
| D | 0 | 11 | 0 |
| Mode M0 | |||
|---|---|---|---|
| Quadrant | BADHDUFLAG | Total packets | Discarded packets |
| A | 0 | 25553 | 0 |
| B | 0 | 25947 | 0 |
| C | 0 | 25640 | 0 |
| D | 0 | 26813 | 0 |
| Mode SS | |||
|---|---|---|---|
| Quadrant | BADHDUFLAG | Total packets | Discarded packets |
| A | 0 | 256 | 0 |
| B | 0 | 256 | 0 |
| C | 0 | 256 | 0 |
| D | 0 | 256 | 0 |
| Quadrant | Total seconds | Saturated seconds | Saturation percentage |
|---|---|---|---|
| A | 12534 | 99 | 0.789852% |
| B | 12534 | 93 | 0.741982% |
| C | 12534 | 81 | 0.646242% |
| D | 12534 | 151 | 1.204723% |
Noise dominated data is calculated using 1-second bins in cleaned event files. If a bin has >2000 counts, and if more than 50% of those come from <1% of pixels, then it is considered to be noise-dominated and hence unusable.
| Quadrant | # 1 sec bins | Bins with >0 counts | Bins with >2000 counts | High rate bins dominated by noise | Noise dominated (total time) | Noise dominated (detector-on time) | Marked lightcurve |
|---|---|---|---|---|---|---|---|
| A | 13685 | 12534 | 1 | 1 | 0.01% | 0.01% | 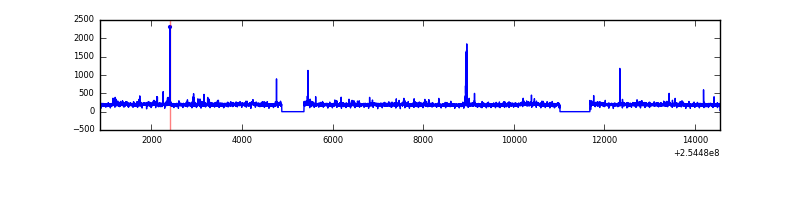 |
| B | 13685 | 12533 | 0 | 0 | 0.00% | 0.00% |  |
| C | 13685 | 12534 | 1 | 1 | 0.01% | 0.01% | 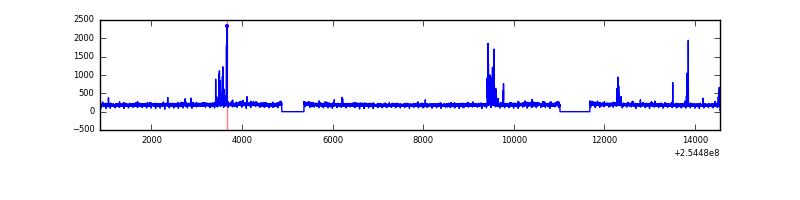 |
| D | 13685 | 12534 | 3 | 3 | 0.02% | 0.02% | 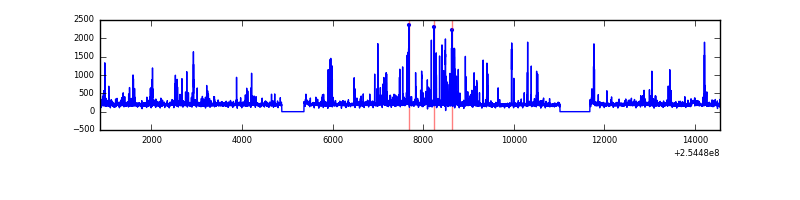 |
Top three noisy pixels from each quadrant. If the there are fewer than three noisy pixels in the level2.evt file, extra rows are filled as -1
| Pixel properties | Quadrant properties | ||||||
|---|---|---|---|---|---|---|---|
| Quadrant | DetID | PixID | Counts | Sigma | Mean | Median | Sigma |
| A | 12 | 189 | 48708 | 353.32 | 601 | 586 | 136.2 |
| A | 13 | 248 | 33954 | 244.99 | 601 | 586 | 136.2 |
| A | 3 | 1 | 15641 | 110.54 | 601 | 586 | 136.2 |
| B | 3 | 209 | 87462 | 732.53 | 607 | 588 | 118.6 |
| B | 0 | 214 | 61073 | 510.01 | 607 | 588 | 118.6 |
| B | 11 | 51 | 60755 | 507.33 | 607 | 588 | 118.6 |
| C | 15 | 208 | 90515 | 685.25 | 584 | 574 | 131.3 |
| C | 14 | 234 | 15024 | 110.09 | 584 | 574 | 131.3 |
| C | 8 | 128 | 8025 | 56.77 | 584 | 574 | 131.3 |
| D | 1 | 52 | 382459 | 2772.29 | 585 | 562 | 137.8 |
| D | 13 | 249 | 50239 | 360.62 | 585 | 562 | 137.8 |
| D | 2 | 234 | 46863 | 336.11 | 585 | 562 | 137.8 |
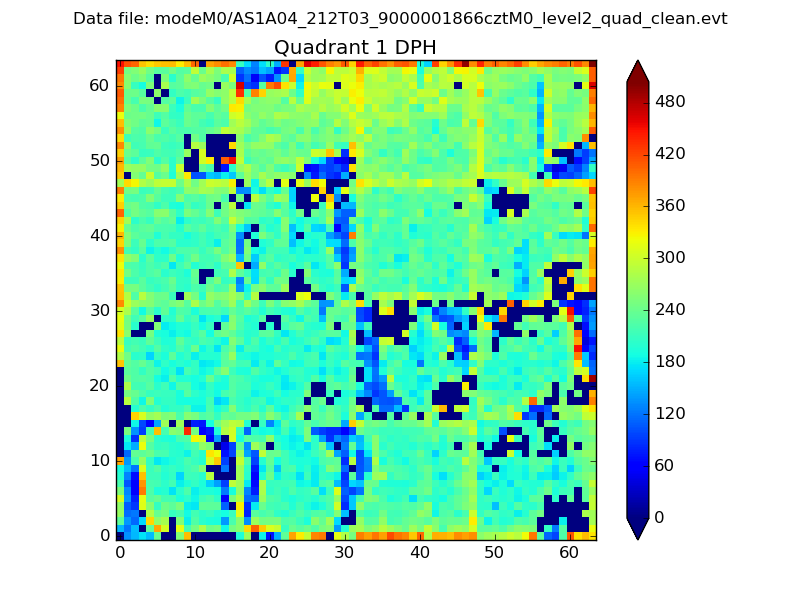
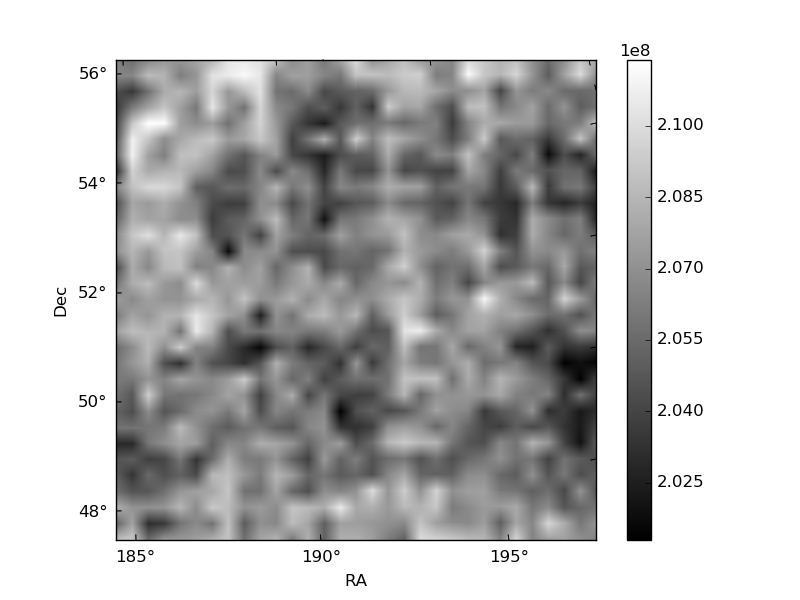
Histogram calculated using DETX and DETY for each event in the final _common_clean file
| Quadrant A |  |
 |
Quadrant B |
|---|---|---|---|
| Quadrant D |  |
 |
Quadrant C |
| Plot type | Count rate plots | Images |
|---|---|---|
| Comparison with Poisson distribution Blue bars denote a histogram of data divided into 1 sec bins. Red curve is a Poisson curve with rate = median count rate of data. |
 |
 |
| Quadrant-wise count rates Data is divided into 100 sec bins |
 |
|
| Module-wise count rates for Quadrant A Data is divided into 100 sec bins |
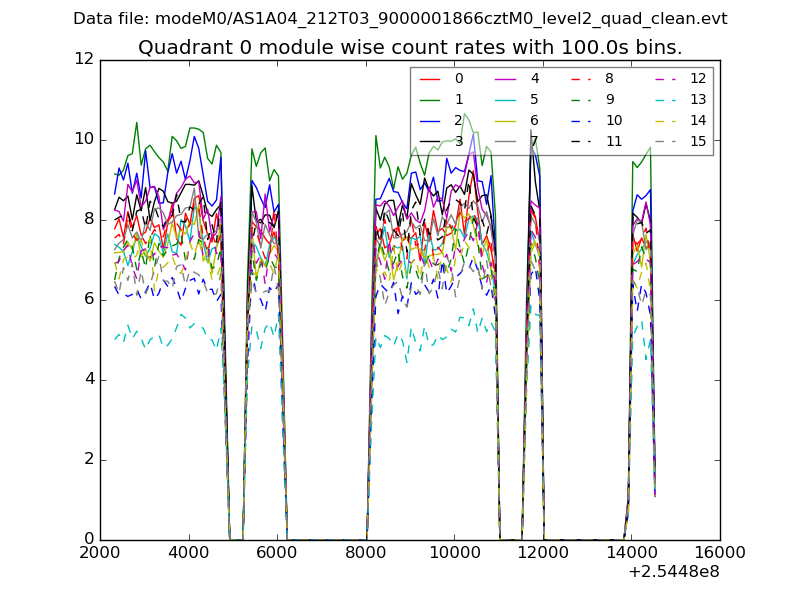 |
 |
| Module-wise count rates for Quadrant B Data is divided into 100 sec bins |
 |
 |
| Module-wise count rates for Quadrant C Data is divided into 100 sec bins |
 |
 |
| Module-wise count rates for Quadrant D Data is divided into 100 sec bins |
 |
 |
| Parameter | Plot |
|---|---|
| CZT HV Monitor |  |
| D_VDD | 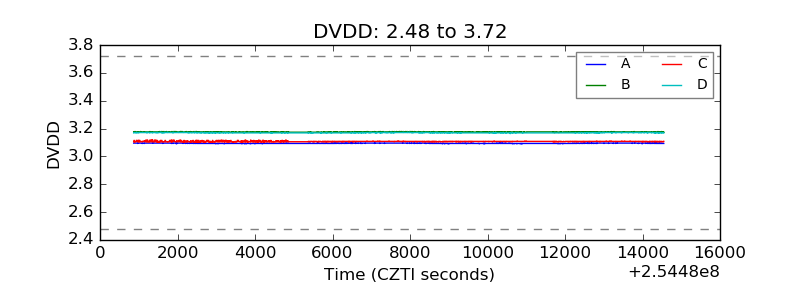 |
| Temperature 1 |  |
| Veto HV Monitor | 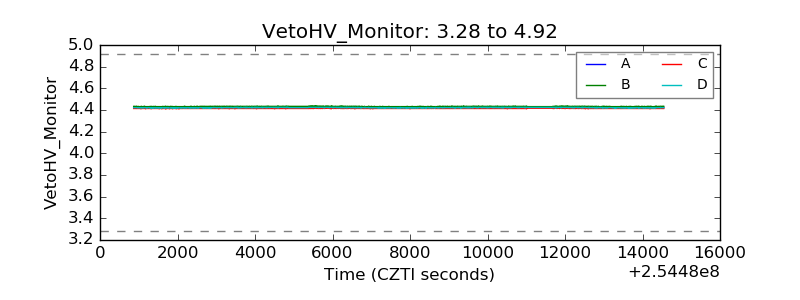 |
| Veto LLD |  |
| Alpha Counter | 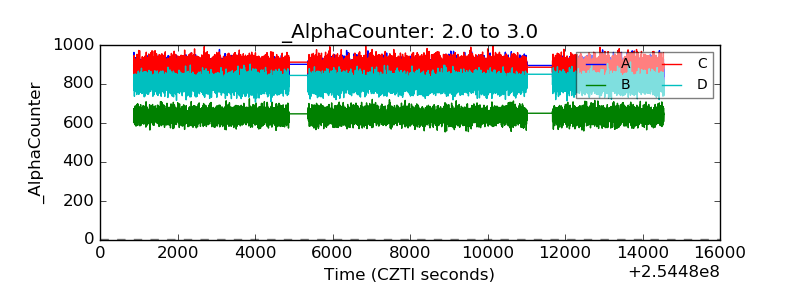 |
| _CPM_Rate |  |
| CZT Counter |  |
| +2.5 Volts monitor |  |
| +5 Volts monitor |  |
| _ROLL_ROT | 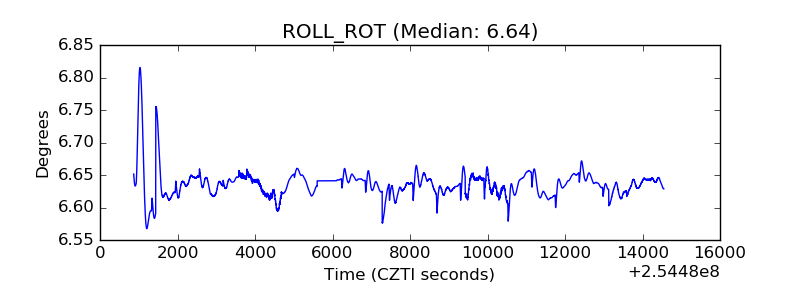 |
| _Roll_DEC | 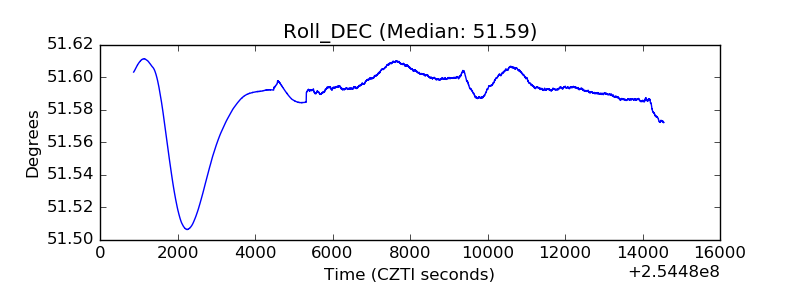 |
| _Roll_RA | 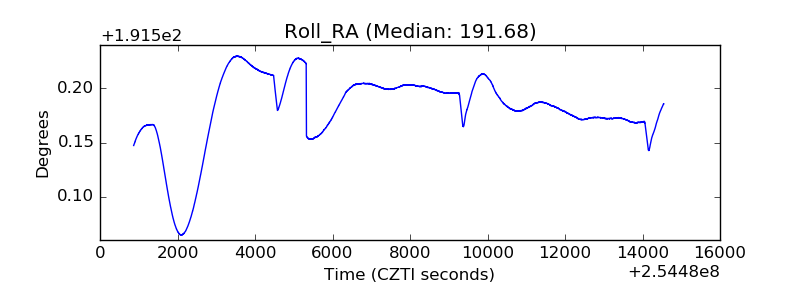 |
| Veto Counter |  |