| Param | Original file | Final file |
|---|---|---|
| Filename | modeM0/AS1G08_071T01_9000001874cztM0_level2_bc.evt | modeM0/AS1G08_071T01_9000001874cztM0_level2_quad_clean.evt |
| Size (bytes) | 12,190,927,680 | 4,129,032,960 |
| Size | 11.4 GB | 3.8 GB |
| Events in quadrant A | 64,101,793 | 26,095,036 |
| Events in quadrant B | 94,471,457 | 26,133,105 |
| Events in quadrant C | 68,007,327 | 26,499,185 |
| Events in quadrant D | 121,255,788 | 24,831,660 |
| Mode SS | |||
|---|---|---|---|
| Quadrant | BADHDUFLAG | Total packets | Discarded packets |
| A | 0 | 6402 | 0 |
| B | 0 | 6400 | 0 |
| C | 0 | 6402 | 0 |
| D | 0 | 6402 | 0 |
| Mode M0 | |||
|---|---|---|---|
| Quadrant | BADHDUFLAG | Total packets | Discarded packets |
| A | 0 | 652112 | 0 |
| B | 0 | 775830 | 0 |
| C | 0 | 667022 | 0 |
| D | 0 | 847894 | 0 |
| Mode M9 | |||
|---|---|---|---|
| Quadrant | BADHDUFLAG | Total packets | Discarded packets |
| A | 0 | 482 | 0 |
| B | 0 | 482 | 0 |
| C | 0 | 482 | 0 |
| D | 0 | 482 | 0 |
| Quadrant | Total seconds | Saturated seconds | Saturation percentage |
|---|---|---|---|
| A | 314012 | 3957 | 1.260143% |
| B | 313997 | 14618 | 4.655458% |
| C | 314046 | 3942 | 1.255230% |
| D | 314012 | 14345 | 4.568297% |
Noise dominated data is calculated using 1-second bins in cleaned event files. If a bin has >2000 counts, and if more than 50% of those come from <1% of pixels, then it is considered to be noise-dominated and hence unusable.
| Quadrant | # 1 sec bins | Bins with >0 counts | Bins with >2000 counts | High rate bins dominated by noise | Noise dominated (total time) | Noise dominated (detector-on time) | Marked lightcurve |
|---|---|---|---|---|---|---|---|
| A | 362521 | 314084 | 36 | 36 | 0.01% | 0.01% |  |
| B | 362521 | 314055 | 687 | 687 | 0.19% | 0.22% |  |
| C | 362521 | 314109 | 171 | 171 | 0.05% | 0.05% | 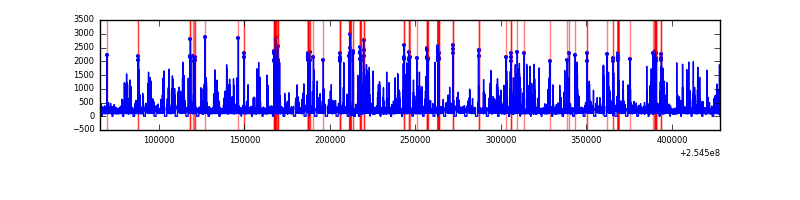 |
| D | 362521 | 314073 | 2540 | 2540 | 0.70% | 0.81% | 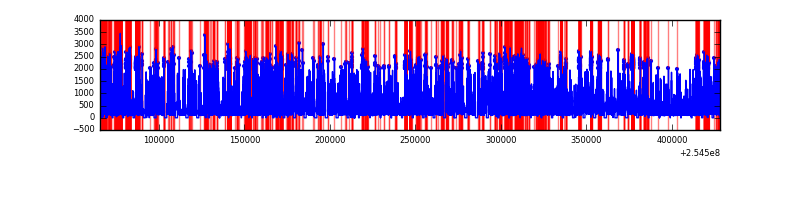 |
Top three noisy pixels from each quadrant. If the there are fewer than three noisy pixels in the level2.evt file, extra rows are filled as -1
| Pixel properties | Quadrant properties | ||||||
|---|---|---|---|---|---|---|---|
| Quadrant | DetID | PixID | Counts | Sigma | Mean | Median | Sigma |
| A | 12 | 189 | 1161979 | 335.14 | 15797 | 15488 | 3421.0 |
| A | 3 | 1 | 799658 | 229.22 | 15797 | 15488 | 3421.0 |
| A | 8 | 15 | 517915 | 146.87 | 15797 | 15488 | 3421.0 |
| B | 4 | 239 | 18594774 | 6232.05 | 15795 | 15342 | 2981.3 |
| B | 3 | 64 | 6570767 | 2198.87 | 15795 | 15342 | 2981.3 |
| B | 11 | 51 | 2145245 | 714.43 | 15795 | 15342 | 2981.3 |
| C | 15 | 208 | 5639938 | 1642.25 | 15696 | 15498 | 3424.8 |
| C | 14 | 234 | 773349 | 221.28 | 15696 | 15498 | 3424.8 |
| C | 13 | 61 | 93666 | 22.82 | 15696 | 15498 | 3424.8 |
| D | 1 | 52 | 28622710 | 8087.57 | 15371 | 14812 | 3537.3 |
| D | 10 | 157 | 24788754 | 7003.69 | 15371 | 14812 | 3537.3 |
| D | 10 | 199 | 2565951 | 721.22 | 15371 | 14812 | 3537.3 |
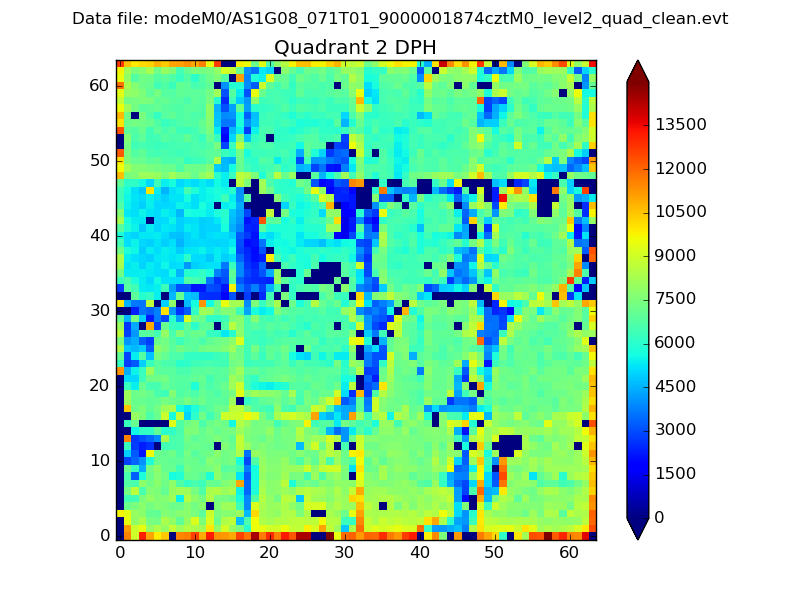
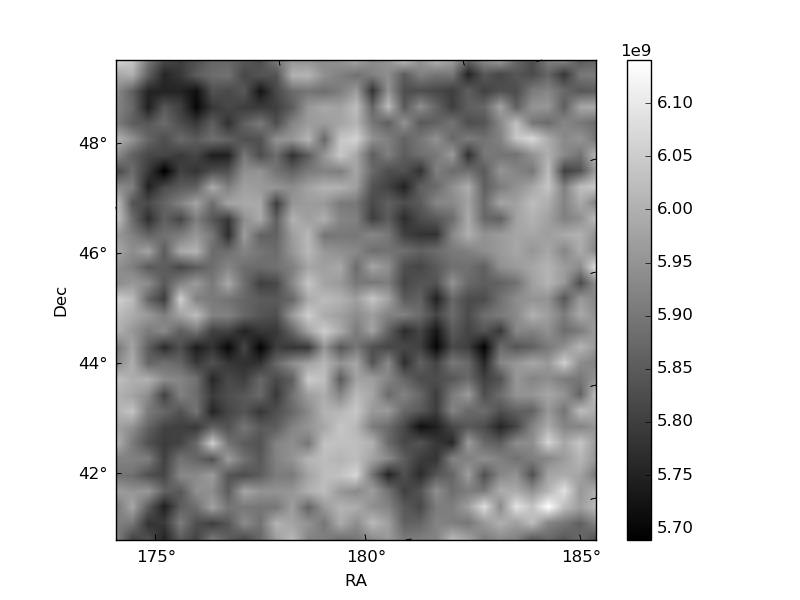
Histogram calculated using DETX and DETY for each event in the final _common_clean file
| Quadrant A | 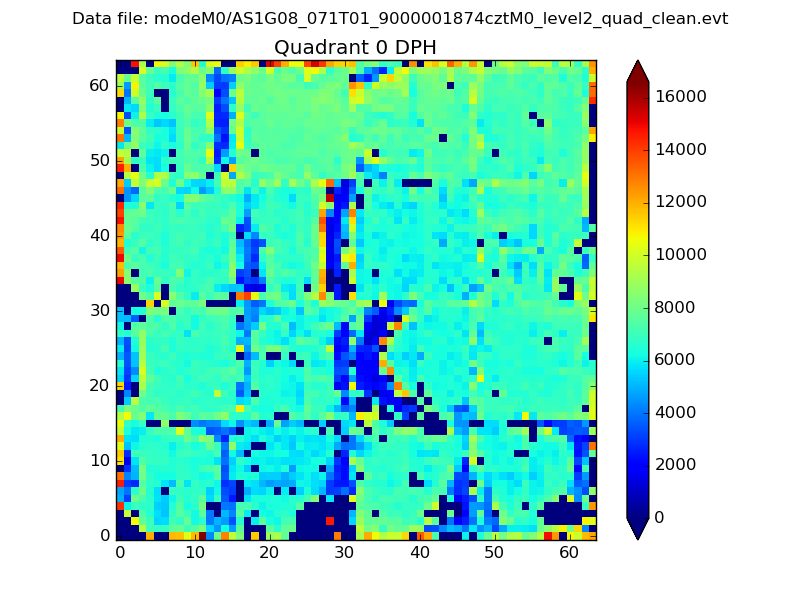 |
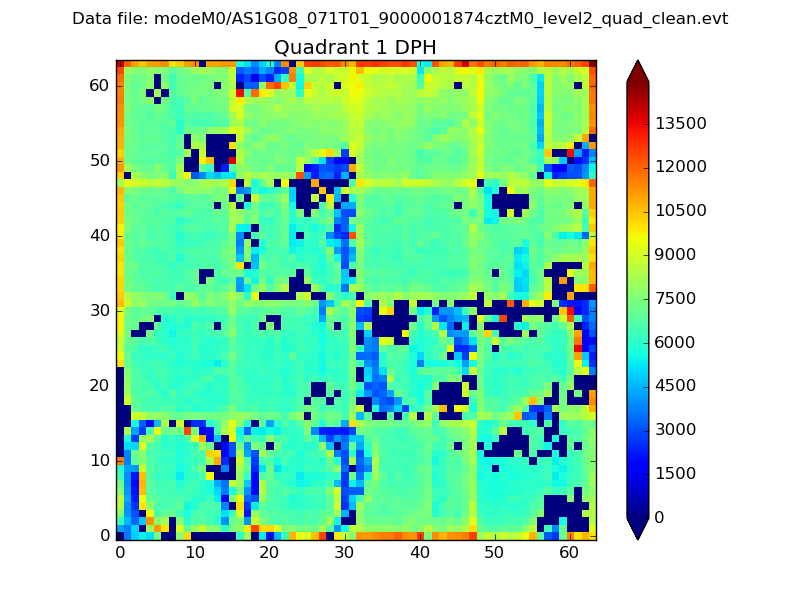 |
Quadrant B |
|---|---|---|---|
| Quadrant D | 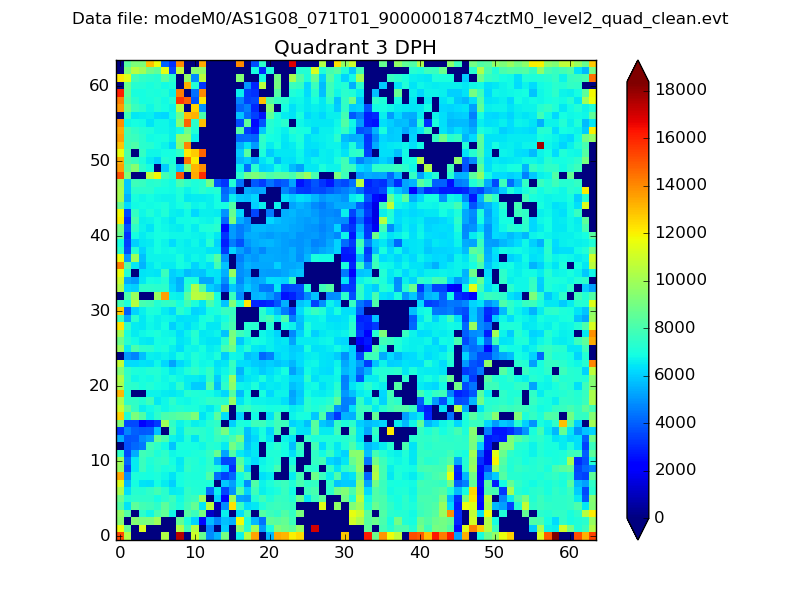 |
 |
Quadrant C |
| Plot type | Count rate plots | Images |
|---|---|---|
| Comparison with Poisson distribution Blue bars denote a histogram of data divided into 1 sec bins. Red curve is a Poisson curve with rate = median count rate of data. |
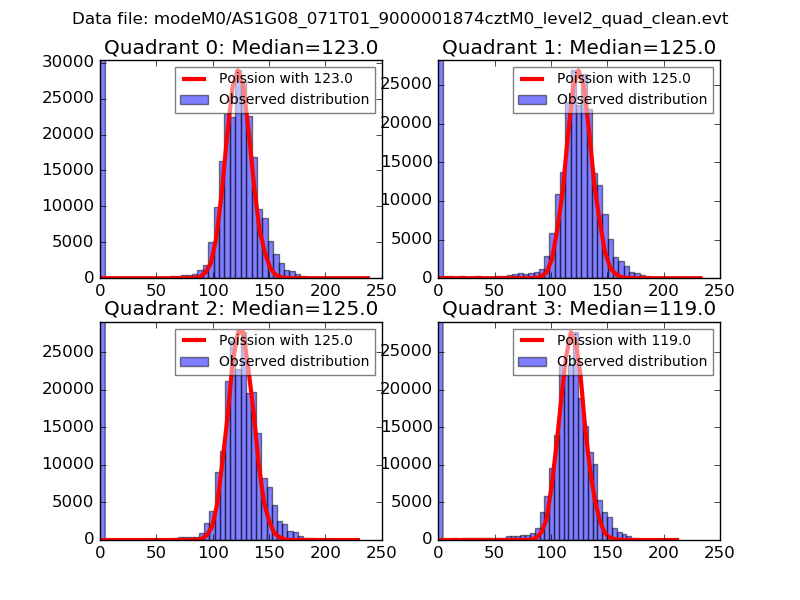 |
 |
| Quadrant-wise count rates Data is divided into 100 sec bins |
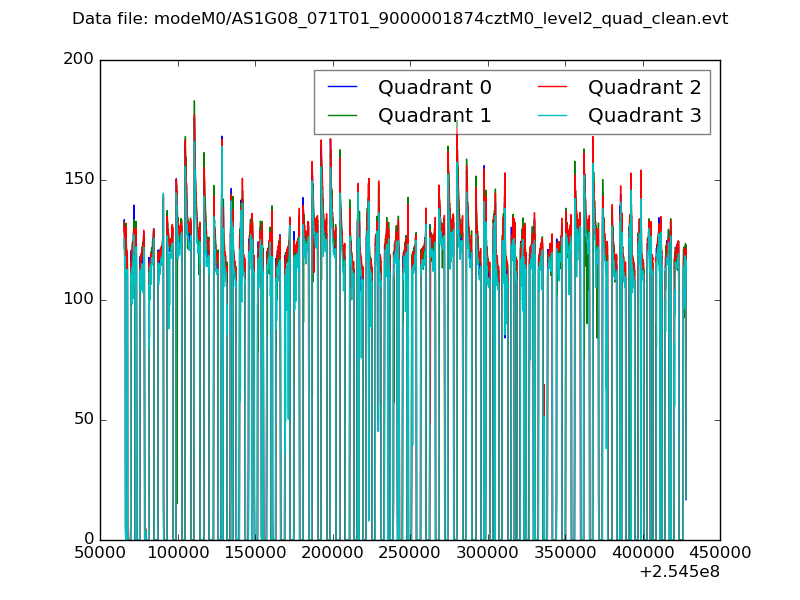 |
|
| Module-wise count rates for Quadrant A Data is divided into 100 sec bins |
 |
 |
| Module-wise count rates for Quadrant B Data is divided into 100 sec bins |
 |
 |
| Module-wise count rates for Quadrant C Data is divided into 100 sec bins |
 |
 |
| Module-wise count rates for Quadrant D Data is divided into 100 sec bins |
 |
 |
| Parameter | Plot |
|---|---|
| CZT HV Monitor | 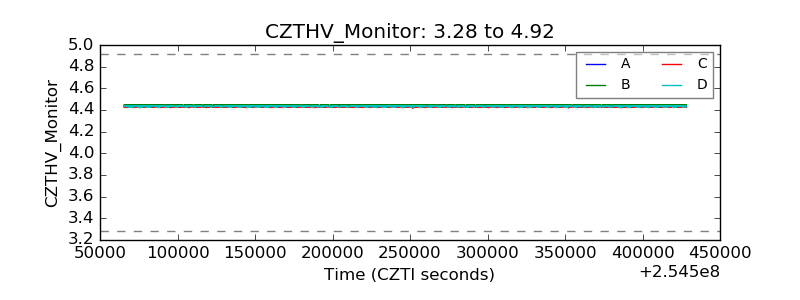 |
| D_VDD | 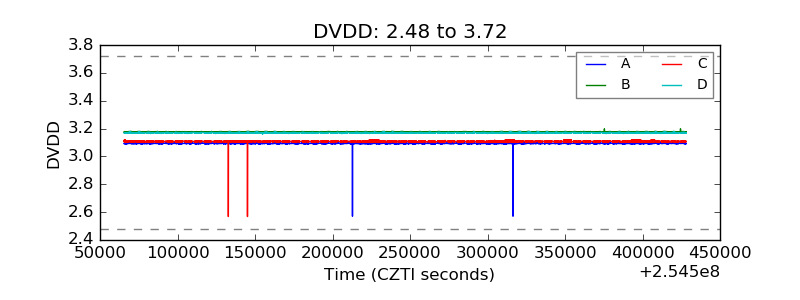 |
| Temperature 1 | 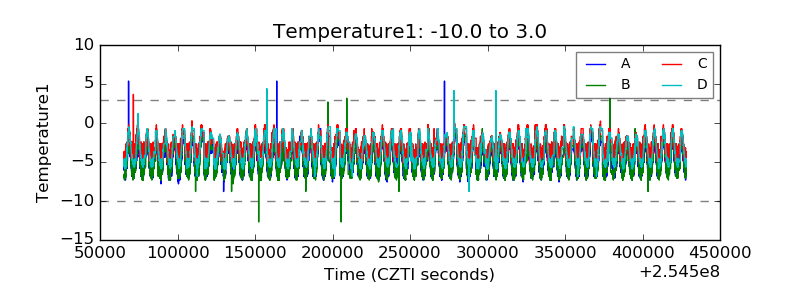 |
| Veto HV Monitor | 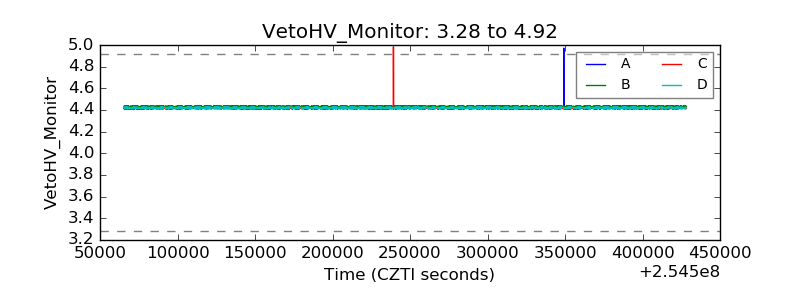 |
| Veto LLD | 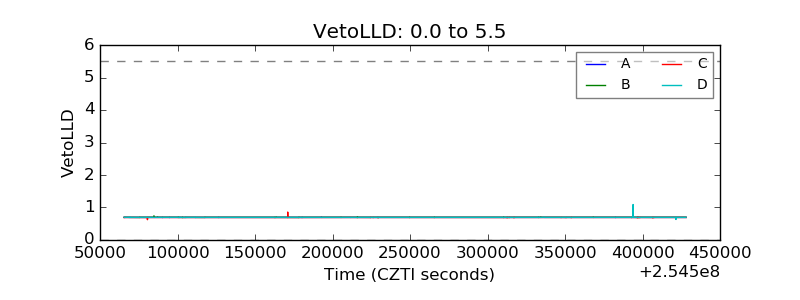 |
| Alpha Counter |  |
| _CPM_Rate |  |
| CZT Counter |  |
| +2.5 Volts monitor |  |
| +5 Volts monitor |  |
| _ROLL_ROT |  |
| _Roll_DEC |  |
| _Roll_RA | 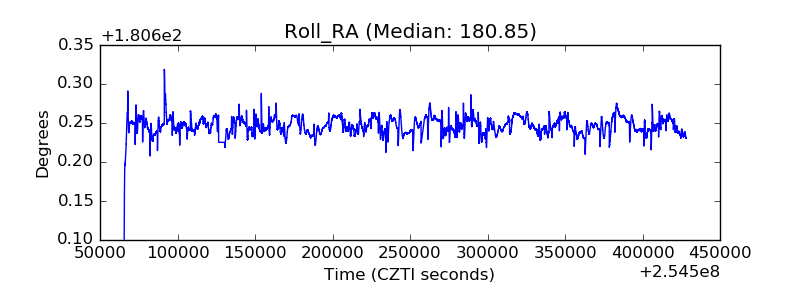 |
| Veto Counter |  |