| Param | Original file | Final file |
|---|---|---|
| Filename | modeM0/AS1A04_048T01_9000001992cztM0_level2_bc.evt | modeM0/AS1A04_048T01_9000001992cztM0_level2_quad_clean.evt |
| Size (bytes) | 1,789,568,640 | 675,100,800 |
| Size | 1.7 GB | 643.8 MB |
| Events in quadrant A | 11,012,632 | 4,225,385 |
| Events in quadrant B | 12,114,717 | 4,290,401 |
| Events in quadrant C | 14,256,716 | 4,192,100 |
| Events in quadrant D | 13,093,338 | 3,998,982 |
| Mode SS | |||
|---|---|---|---|
| Quadrant | BADHDUFLAG | Total packets | Discarded packets |
| A | 0 | 1110 | 0 |
| B | 0 | 1110 | 0 |
| C | 0 | 1110 | 0 |
| D | 0 | 1110 | 0 |
| Mode M9 | |||
|---|---|---|---|
| Quadrant | BADHDUFLAG | Total packets | Discarded packets |
| A | 0 | 77 | 0 |
| B | 0 | 77 | 0 |
| C | 0 | 77 | 0 |
| D | 0 | 77 | 0 |
| Mode M0 | |||
|---|---|---|---|
| Quadrant | BADHDUFLAG | Total packets | Discarded packets |
| A | 0 | 112164 | 0 |
| B | 0 | 115872 | 0 |
| C | 0 | 119717 | 0 |
| D | 0 | 120425 | 0 |
| Quadrant | Total seconds | Saturated seconds | Saturation percentage |
|---|---|---|---|
| A | 54540 | 291 | 0.533553% |
| B | 54540 | 650 | 1.191786% |
| C | 54538 | 428 | 0.784774% |
| D | 54540 | 854 | 1.565823% |
Noise dominated data is calculated using 1-second bins in cleaned event files. If a bin has >2000 counts, and if more than 50% of those come from <1% of pixels, then it is considered to be noise-dominated and hence unusable.
| Quadrant | # 1 sec bins | Bins with >0 counts | Bins with >2000 counts | High rate bins dominated by noise | Noise dominated (total time) | Noise dominated (detector-on time) | Marked lightcurve |
|---|---|---|---|---|---|---|---|
| A | 62176 | 54536 | 2 | 2 | 0.00% | 0.00% |  |
| B | 62176 | 54534 | 23 | 23 | 0.04% | 0.04% |  |
| C | 62176 | 54536 | 17 | 17 | 0.03% | 0.03% |  |
| D | 62176 | 54534 | 5 | 5 | 0.01% | 0.01% |  |
Top three noisy pixels from each quadrant. If the there are fewer than three noisy pixels in the level2.evt file, extra rows are filled as -1
| Pixel properties | Quadrant properties | ||||||
|---|---|---|---|---|---|---|---|
| Quadrant | DetID | PixID | Counts | Sigma | Mean | Median | Sigma |
| A | 1 | 162 | 71266 | 112.54 | 2816 | 2762 | 608.7 |
| A | 2 | 250 | 55511 | 86.66 | 2816 | 2762 | 608.7 |
| A | 8 | 15 | 27392 | 40.46 | 2816 | 2762 | 608.7 |
| B | 3 | 64 | 360556 | 673.58 | 2848 | 2773 | 531.2 |
| B | 4 | 142 | 184934 | 342.95 | 2848 | 2773 | 531.2 |
| B | 4 | 173 | 155025 | 286.64 | 2848 | 2773 | 531.2 |
| C | 3 | 233 | 3338422 | 5502.06 | 2780 | 2750 | 606.3 |
| C | 13 | 61 | 16331 | 22.4 | 2780 | 2750 | 606.3 |
| C | 14 | 234 | 15700 | 21.36 | 2780 | 2750 | 606.3 |
| D | 13 | 104 | 702006 | 1116.22 | 2758 | 2666 | 626.5 |
| D | 13 | 122 | 589224 | 936.21 | 2758 | 2666 | 626.5 |
| D | 8 | 195 | 443402 | 703.46 | 2758 | 2666 | 626.5 |
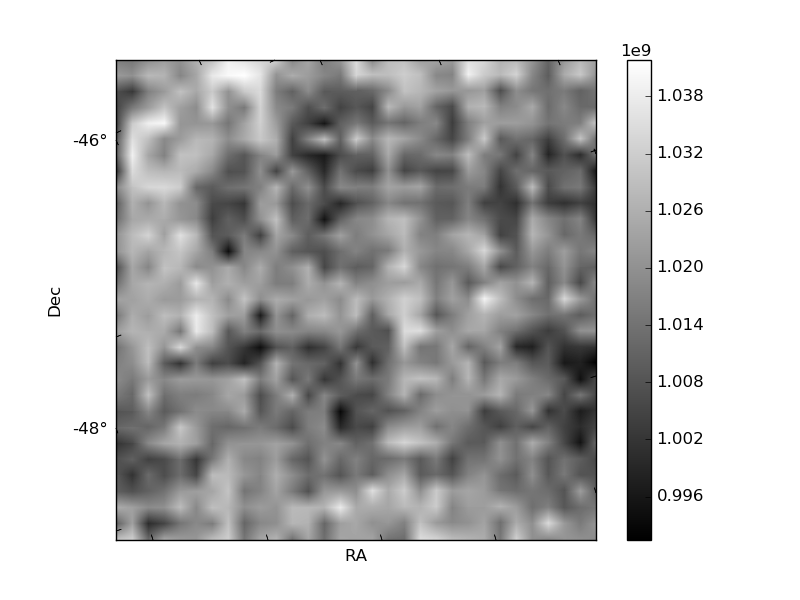
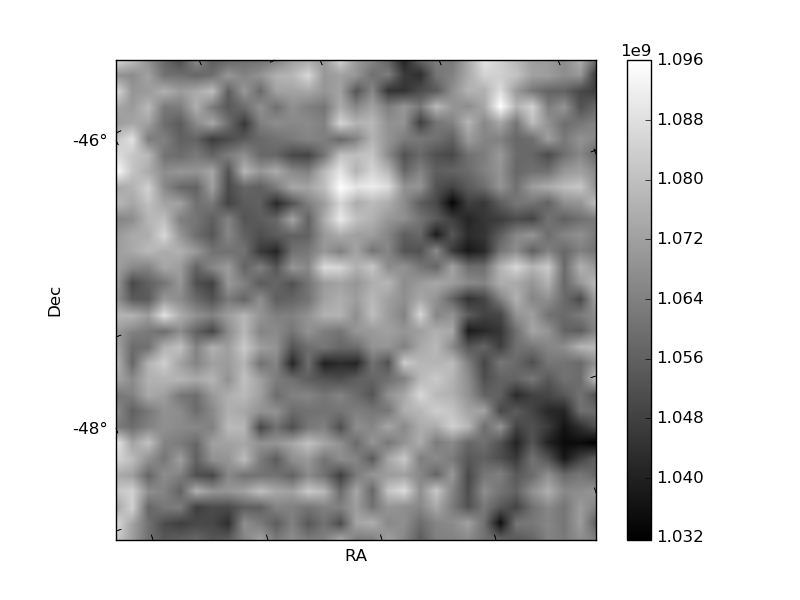
Histogram calculated using DETX and DETY for each event in the final _common_clean file
| Quadrant A | 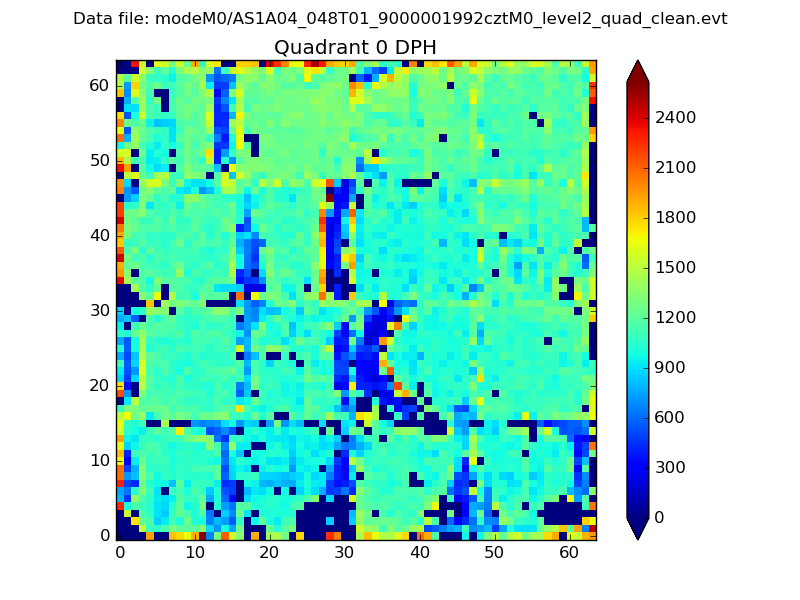 |
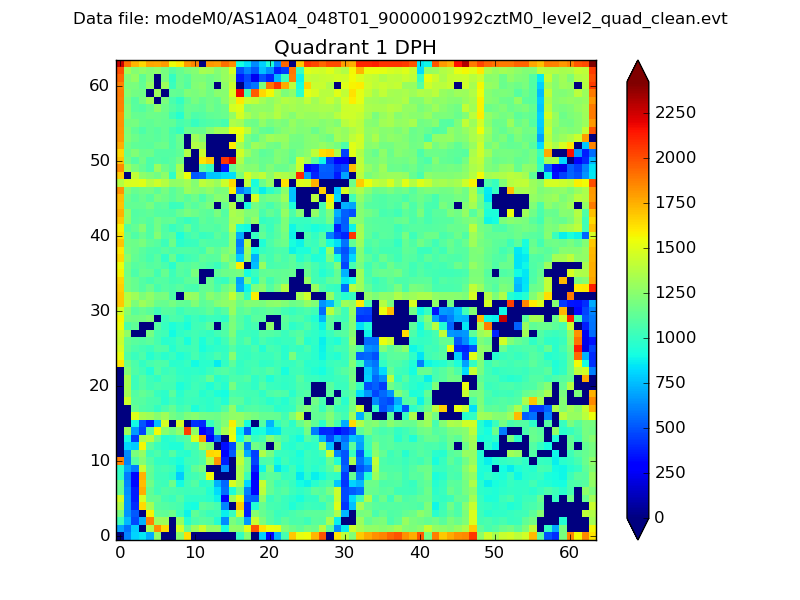 |
Quadrant B |
|---|---|---|---|
| Quadrant D |  |
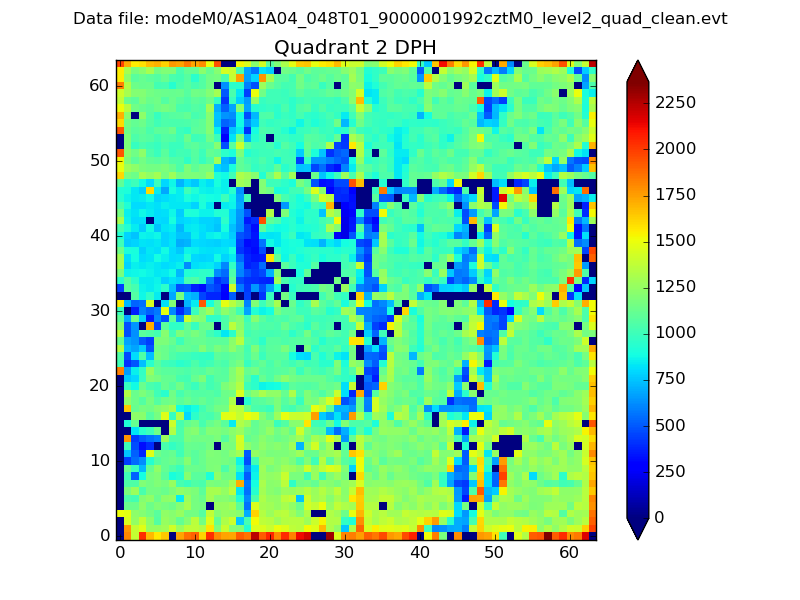 |
Quadrant C |
| Plot type | Count rate plots | Images |
|---|---|---|
| Comparison with Poisson distribution Blue bars denote a histogram of data divided into 1 sec bins. Red curve is a Poisson curve with rate = median count rate of data. |
 |
 |
| Quadrant-wise count rates Data is divided into 100 sec bins |
 |
|
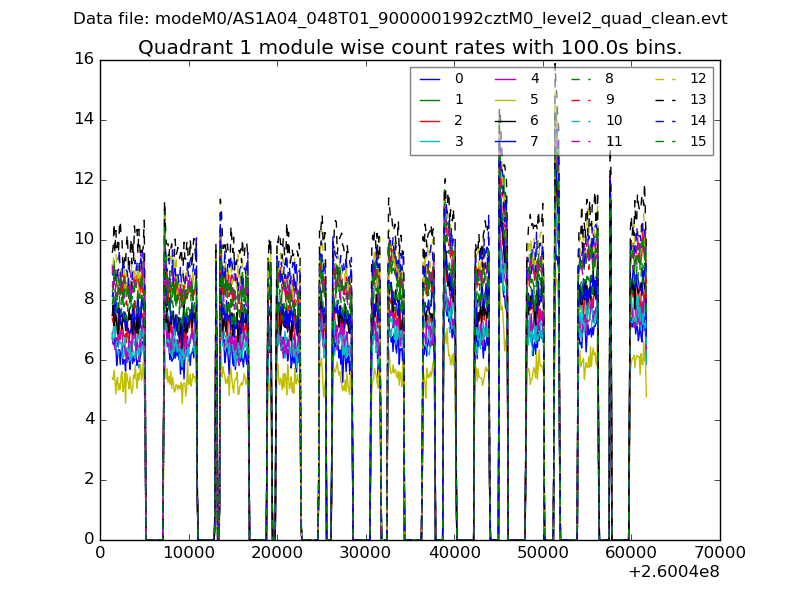
| Module-wise count rates for Quadrant A Data is divided into 100 sec bins |
 |
 |
| Module-wise count rates for Quadrant B Data is divided into 100 sec bins |
 |
 |
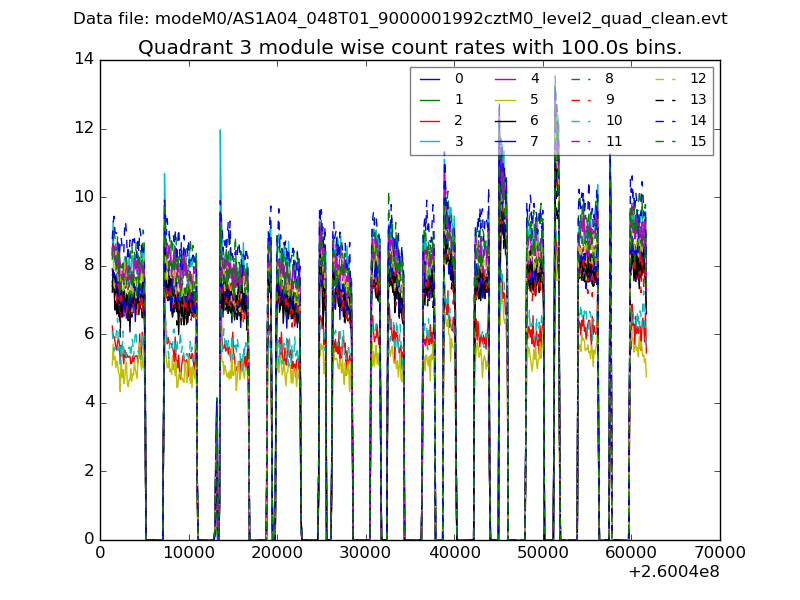
| Module-wise count rates for Quadrant C Data is divided into 100 sec bins |
 |
 |
| Module-wise count rates for Quadrant D Data is divided into 100 sec bins |
 |
 |
| Parameter | Plot |
|---|---|
| CZT HV Monitor |  |
| D_VDD | 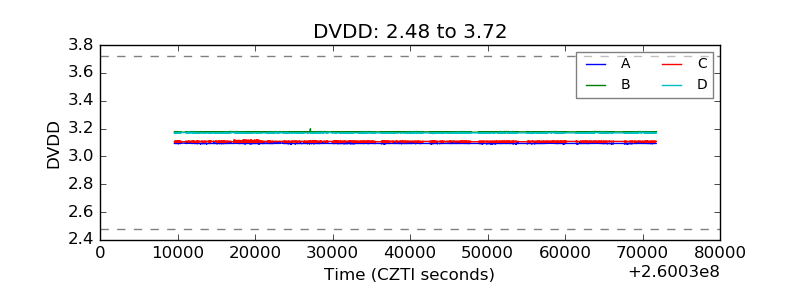 |
| Temperature 1 |  |
| Veto HV Monitor | 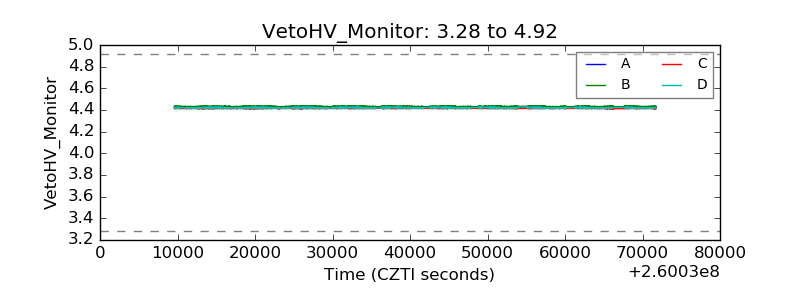 |
| Veto LLD | 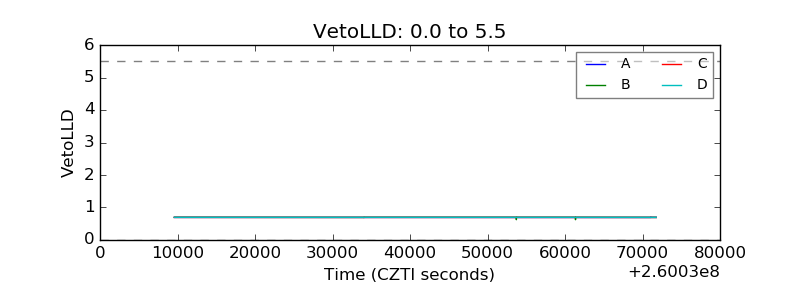 |
| Alpha Counter |  |
| _CPM_Rate |  |
| CZT Counter |  |
| +2.5 Volts monitor |  |
| +5 Volts monitor |  |
| _ROLL_ROT | 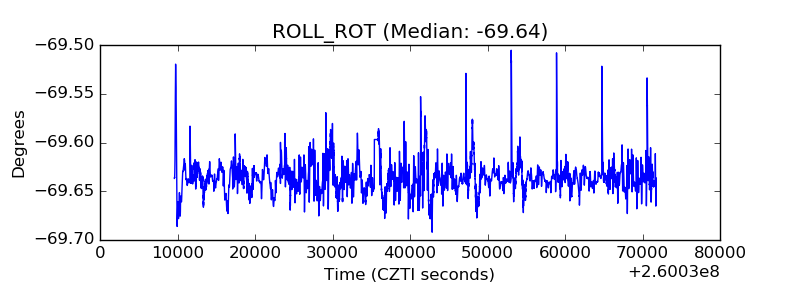 |
| _Roll_DEC |  |
| _Roll_RA |  |
| Veto Counter | 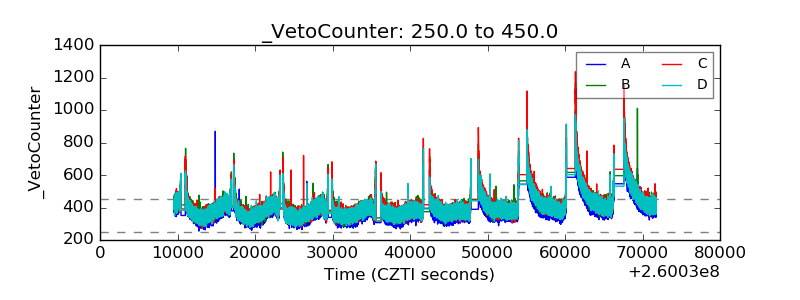 |