| Param | Original file | Final file |
|---|---|---|
| Filename | modeM0/AS1G08_069T01_9000002102cztM0_level2_bc.evt | modeM0/AS1G08_069T01_9000002102cztM0_level2_quad_clean.evt |
| Size (bytes) | 3,552,563,520 | 1,038,525,120 |
| Size | 3.3 GB | 990.4 MB |
| Events in quadrant A | 21,100,039 | 6,783,765 |
| Events in quadrant B | 19,283,963 | 6,674,124 |
| Events in quadrant C | 19,245,301 | 6,448,640 |
| Events in quadrant D | 42,495,749 | 6,041,292 |
| Mode SS | |||
|---|---|---|---|
| Quadrant | BADHDUFLAG | Total packets | Discarded packets |
| A | 0 | 1636 | 0 |
| B | 0 | 1636 | 0 |
| C | 0 | 1636 | 0 |
| D | 0 | 1636 | 0 |
| Mode M0 | |||
|---|---|---|---|
| Quadrant | BADHDUFLAG | Total packets | Discarded packets |
| A | 0 | 179097 | 0 |
| B | 0 | 175430 | 0 |
| C | 0 | 169735 | 0 |
| D | 0 | 255744 | 0 |
| Mode M9 | |||
|---|---|---|---|
| Quadrant | BADHDUFLAG | Total packets | Discarded packets |
| A | 0 | 125 | 0 |
| B | 0 | 125 | 0 |
| C | 0 | 125 | 0 |
| D | 0 | 125 | 0 |
| Quadrant | Total seconds | Saturated seconds | Saturation percentage |
|---|---|---|---|
| A | 80345 | 1305 | 1.624245% |
| B | 80345 | 1349 | 1.679009% |
| C | 80345 | 512 | 0.637252% |
| D | 80345 | 5553 | 6.911444% |
Noise dominated data is calculated using 1-second bins in cleaned event files. If a bin has >2000 counts, and if more than 50% of those come from <1% of pixels, then it is considered to be noise-dominated and hence unusable.
| Quadrant | # 1 sec bins | Bins with >0 counts | Bins with >2000 counts | High rate bins dominated by noise | Noise dominated (total time) | Noise dominated (detector-on time) | Marked lightcurve |
|---|---|---|---|---|---|---|---|
| A | 92791 | 80348 | 154 | 154 | 0.17% | 0.19% |  |
| B | 92791 | 80345 | 38 | 38 | 0.04% | 0.05% | 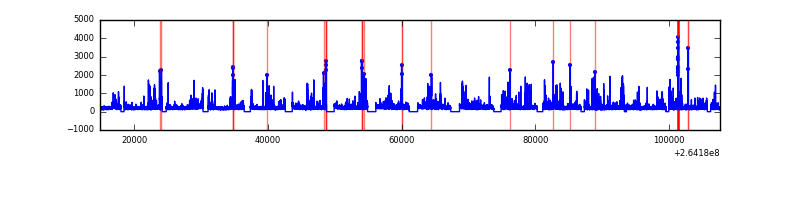 |
| C | 92791 | 80350 | 4 | 4 | 0.00% | 0.00% | 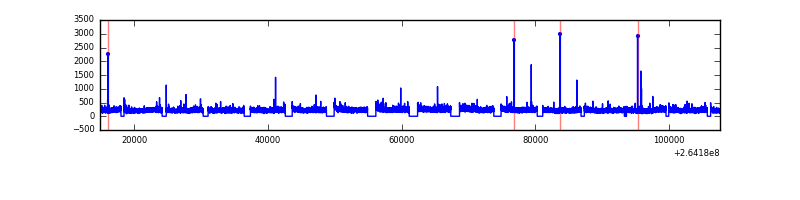 |
| D | 92791 | 80346 | 1178 | 1178 | 1.27% | 1.47% | 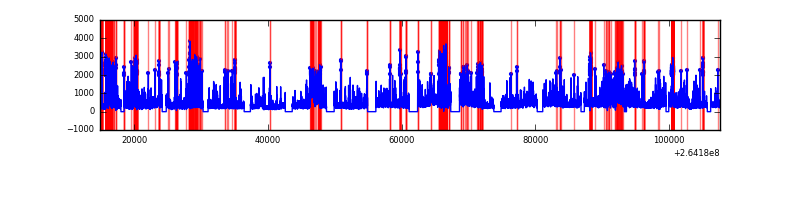 |
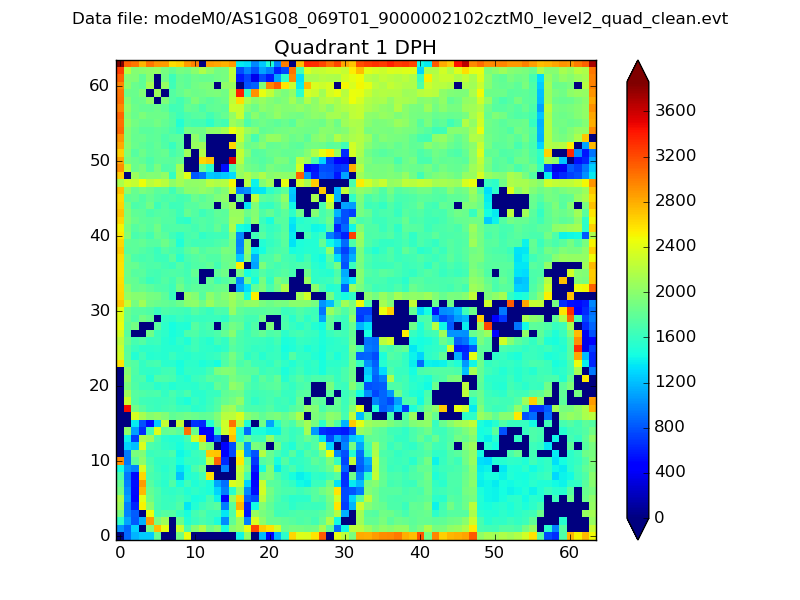
Top three noisy pixels from each quadrant. If the there are fewer than three noisy pixels in the level2.evt file, extra rows are filled as -1
| Pixel properties | Quadrant properties | ||||||
|---|---|---|---|---|---|---|---|
| Quadrant | DetID | PixID | Counts | Sigma | Mean | Median | Sigma |
| A | 9 | 143 | 2812626 | 3017.91 | 4298 | 4210 | 930.6 |
| A | 12 | 189 | 1043440 | 1116.75 | 4298 | 4210 | 930.6 |
| A | 8 | 15 | 535944 | 571.4 | 4298 | 4210 | 930.6 |
| B | 0 | 229 | 1362438 | 1687.2 | 4266 | 4161 | 805.0 |
| B | 10 | 244 | 259683 | 317.4 | 4266 | 4161 | 805.0 |
| B | 0 | 189 | 234186 | 285.73 | 4266 | 4161 | 805.0 |
| C | 3 | 233 | 2890395 | 3150.63 | 4155 | 4110 | 916.1 |
| C | 14 | 234 | 48517 | 48.47 | 4155 | 4110 | 916.1 |
| C | 5 | 96 | 28496 | 26.62 | 4155 | 4110 | 916.1 |
| D | 8 | 195 | 9840120 | 10571.75 | 4033 | 3928 | 930.4 |
| D | 5 | 222 | 8348815 | 8968.92 | 4033 | 3928 | 930.4 |
| D | 1 | 52 | 3102178 | 3329.94 | 4033 | 3928 | 930.4 |
Histogram calculated using DETX and DETY for each event in the final _common_clean file
| Quadrant A |  |
 |
Quadrant B |
|---|---|---|---|
| Quadrant D | 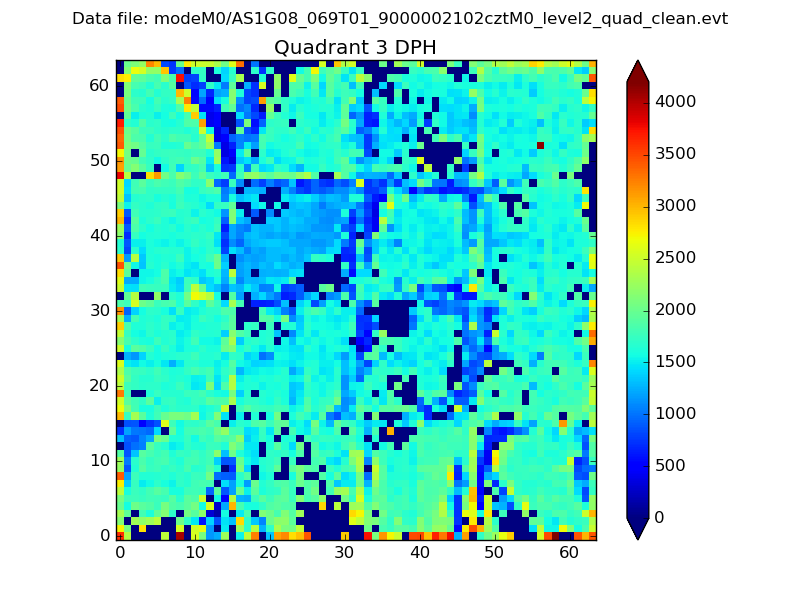 |
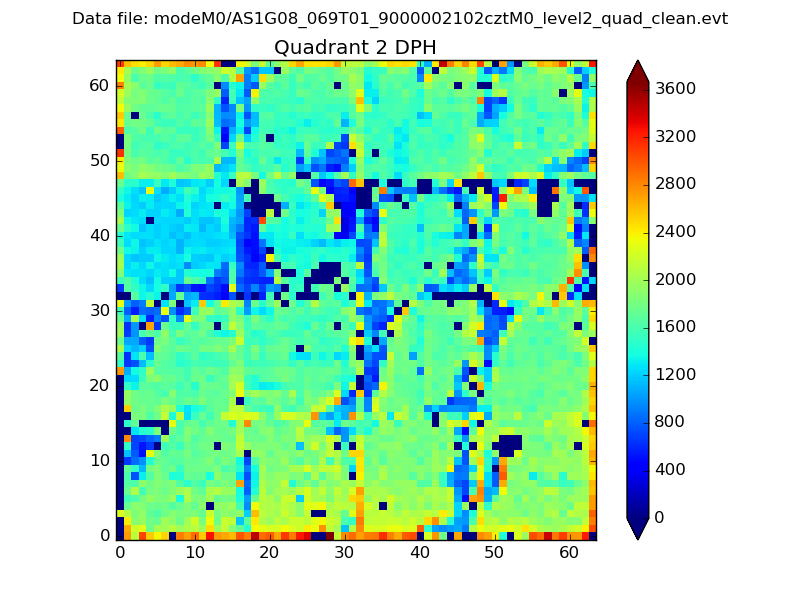 |
Quadrant C |
| Plot type | Count rate plots | Images |
|---|---|---|
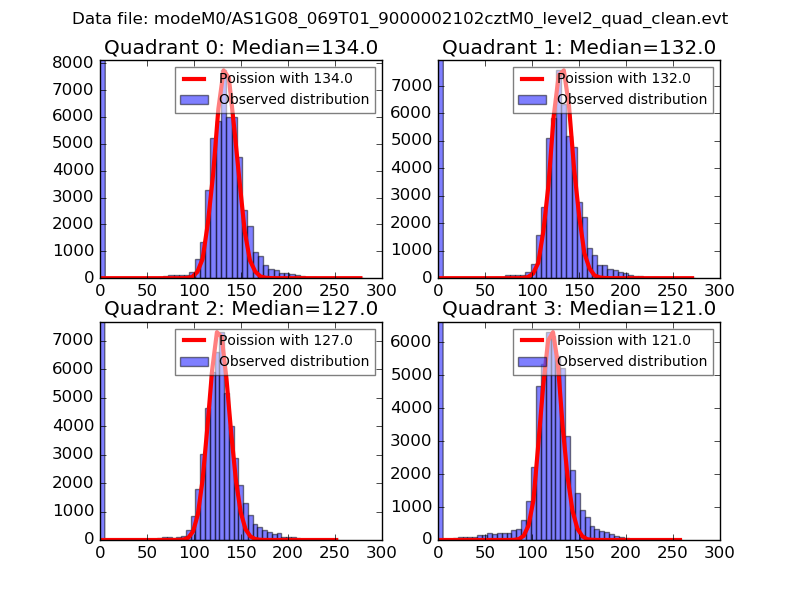
| Comparison with Poisson distribution Blue bars denote a histogram of data divided into 1 sec bins. Red curve is a Poisson curve with rate = median count rate of data. |
 |
 |
| Quadrant-wise count rates Data is divided into 100 sec bins |
 |
|
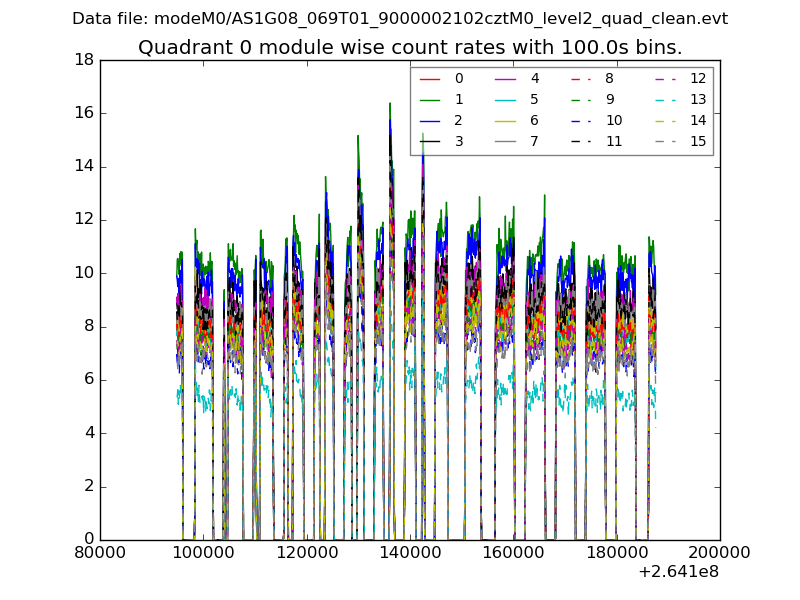
| Module-wise count rates for Quadrant A Data is divided into 100 sec bins |
 |
 |
| Module-wise count rates for Quadrant B Data is divided into 100 sec bins |
 |
 |
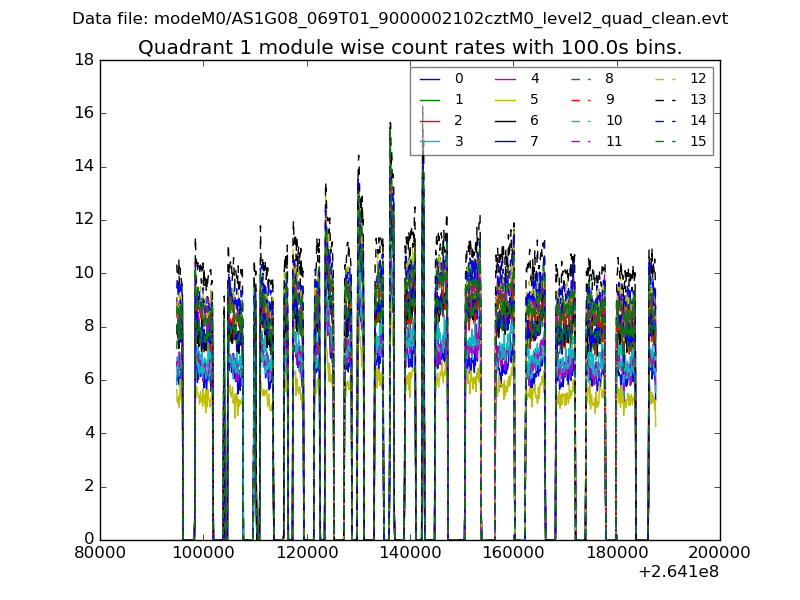
| Module-wise count rates for Quadrant C Data is divided into 100 sec bins |
 |
 |
| Module-wise count rates for Quadrant D Data is divided into 100 sec bins |
 |
 |
| Parameter | Plot |
|---|---|
| CZT HV Monitor |  |
| D_VDD | 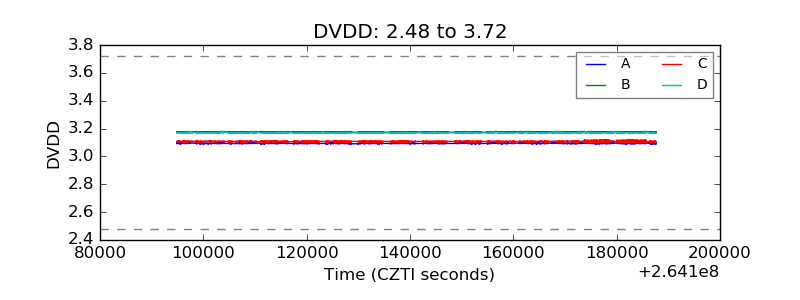 |
| Temperature 1 | 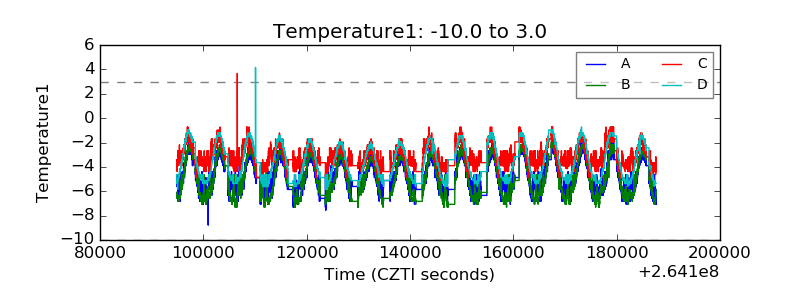 |
| Veto HV Monitor |  |
| Veto LLD |  |
| Alpha Counter |  |
| _CPM_Rate | 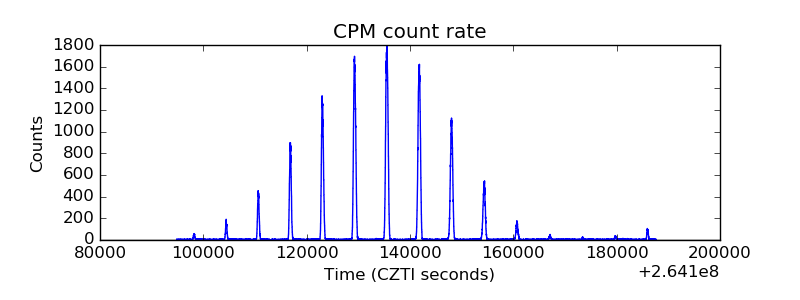 |
| CZT Counter |  |
| +2.5 Volts monitor |  |
| +5 Volts monitor |  |
| _ROLL_ROT | 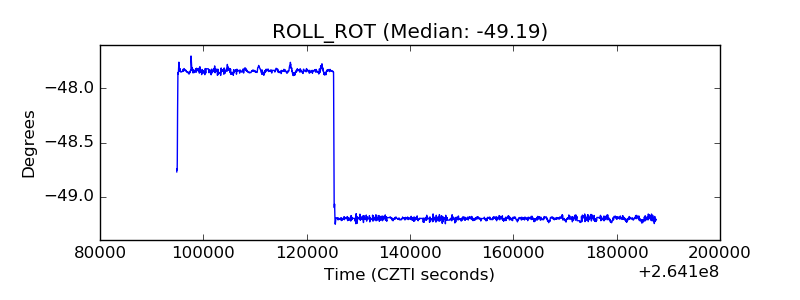 |
| _Roll_DEC | 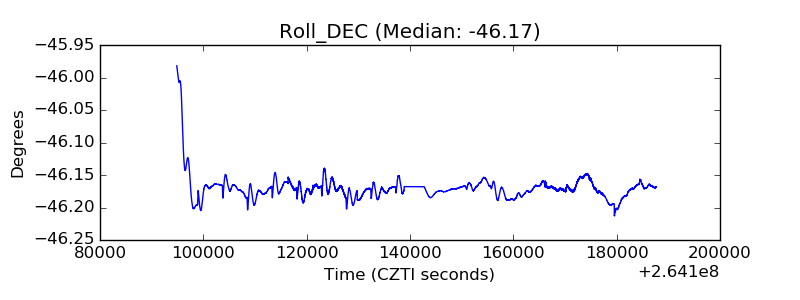 |
| _Roll_RA | 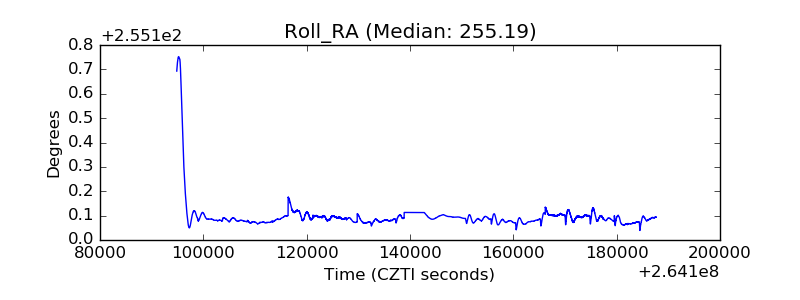 |
| Veto Counter |  |