| Param | Original file | Final file |
|---|---|---|
| Filename | modeM0/AS1G08_058T09_9000002300cztM0_level2_bc.evt | modeM0/AS1G08_058T09_9000002300cztM0_level2_quad_clean.evt |
| Size (bytes) | 3,019,170,240 | 1,034,951,040 |
| Size | 2.8 GB | 987.0 MB |
| Events in quadrant A | 18,946,403 | 6,540,220 |
| Events in quadrant B | 19,431,002 | 6,579,600 |
| Events in quadrant C | 17,825,510 | 6,285,732 |
| Events in quadrant D | 29,451,781 | 6,126,496 |
| Mode SS | |||
|---|---|---|---|
| Quadrant | BADHDUFLAG | Total packets | Discarded packets |
| A | 0 | 1724 | 0 |
| B | 0 | 1724 | 0 |
| C | 0 | 1724 | 0 |
| D | 0 | 1724 | 0 |
| Mode M0 | |||
|---|---|---|---|
| Quadrant | BADHDUFLAG | Total packets | Discarded packets |
| A | 0 | 178251 | 0 |
| B | 0 | 182148 | 0 |
| C | 0 | 177438 | 0 |
| D | 0 | 217594 | 0 |
| Mode M9 | |||
|---|---|---|---|
| Quadrant | BADHDUFLAG | Total packets | Discarded packets |
| A | 0 | 151 | 0 |
| B | 0 | 151 | 0 |
| C | 0 | 151 | 0 |
| D | 0 | 151 | 0 |
| Quadrant | Total seconds | Saturated seconds | Saturation percentage |
|---|---|---|---|
| A | 84853 | 871 | 1.026481% |
| B | 84853 | 1195 | 1.408318% |
| C | 84853 | 1133 | 1.335250% |
| D | 84853 | 4749 | 5.596738% |
Noise dominated data is calculated using 1-second bins in cleaned event files. If a bin has >2000 counts, and if more than 50% of those come from <1% of pixels, then it is considered to be noise-dominated and hence unusable.
| Quadrant | # 1 sec bins | Bins with >0 counts | Bins with >2000 counts | High rate bins dominated by noise | Noise dominated (total time) | Noise dominated (detector-on time) | Marked lightcurve |
|---|---|---|---|---|---|---|---|
| A | 99534 | 84850 | 17 | 17 | 0.02% | 0.02% | 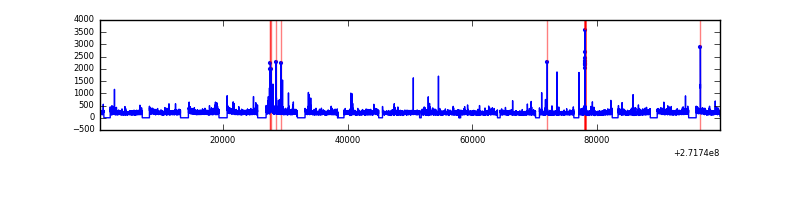 |
| B | 99534 | 84847 | 9 | 9 | 0.01% | 0.01% |  |
| C | 99534 | 84850 | 0 | 0 | 0.00% | 0.00% | 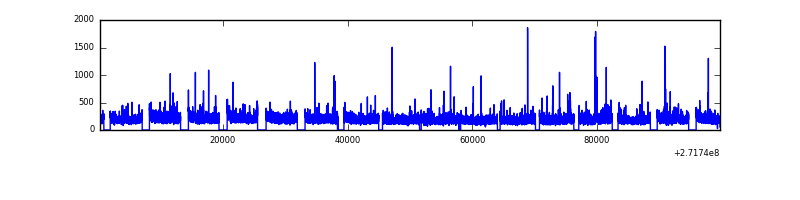 |
| D | 99534 | 84845 | 1583 | 1583 | 1.59% | 1.87% | 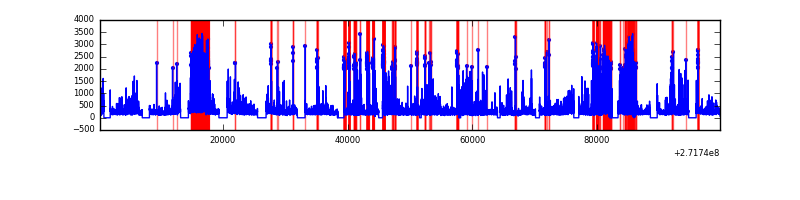 |
Top three noisy pixels from each quadrant. If the there are fewer than three noisy pixels in the level2.evt file, extra rows are filled as -1
| Pixel properties | Quadrant properties | ||||||
|---|---|---|---|---|---|---|---|
| Quadrant | DetID | PixID | Counts | Sigma | Mean | Median | Sigma |
| A | 0 | 253 | 946749 | 960.36 | 4575 | 4489 | 981.2 |
| A | 14 | 238 | 254762 | 255.08 | 4575 | 4489 | 981.2 |
| A | 7 | 16 | 68857 | 65.6 | 4575 | 4489 | 981.2 |
| B | 0 | 189 | 212212 | 244.11 | 4574 | 4455 | 851.1 |
| B | 15 | 222 | 184817 | 211.92 | 4574 | 4455 | 851.1 |
| B | 0 | 214 | 177463 | 203.28 | 4574 | 4455 | 851.1 |
| C | 3 | 233 | 654927 | 646.38 | 4345 | 4318 | 1006.5 |
| C | 7 | 247 | 245389 | 239.5 | 4345 | 4318 | 1006.5 |
| C | 10 | 22 | 90262 | 85.38 | 4345 | 4318 | 1006.5 |
| D | 1 | 52 | 8023364 | 7984.83 | 4387 | 4232 | 1004.3 |
| D | 5 | 222 | 2356096 | 2341.8 | 4387 | 4232 | 1004.3 |
| D | 12 | 221 | 655179 | 648.16 | 4387 | 4232 | 1004.3 |
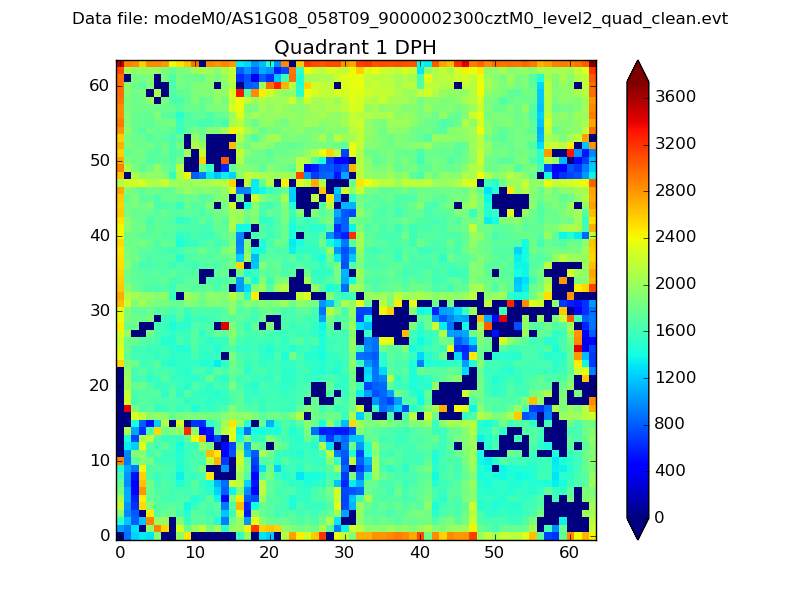
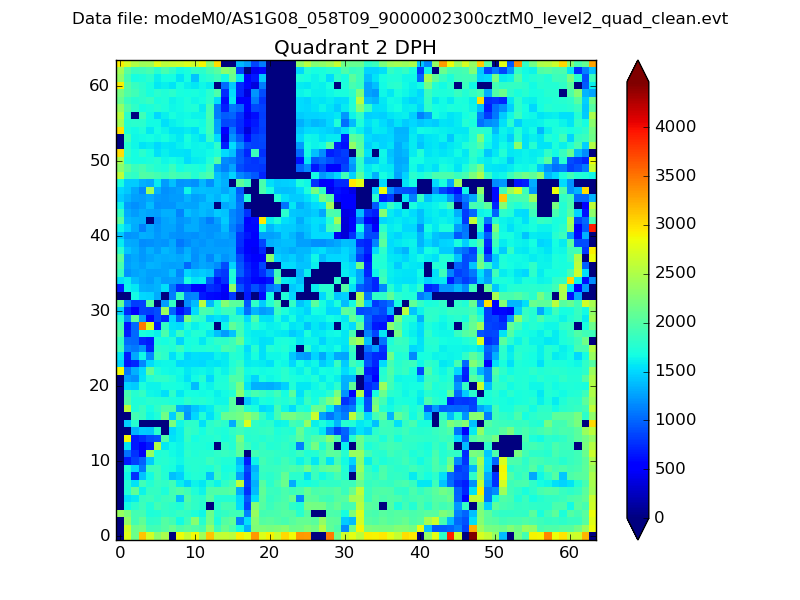
Histogram calculated using DETX and DETY for each event in the final _common_clean file
| Quadrant A | 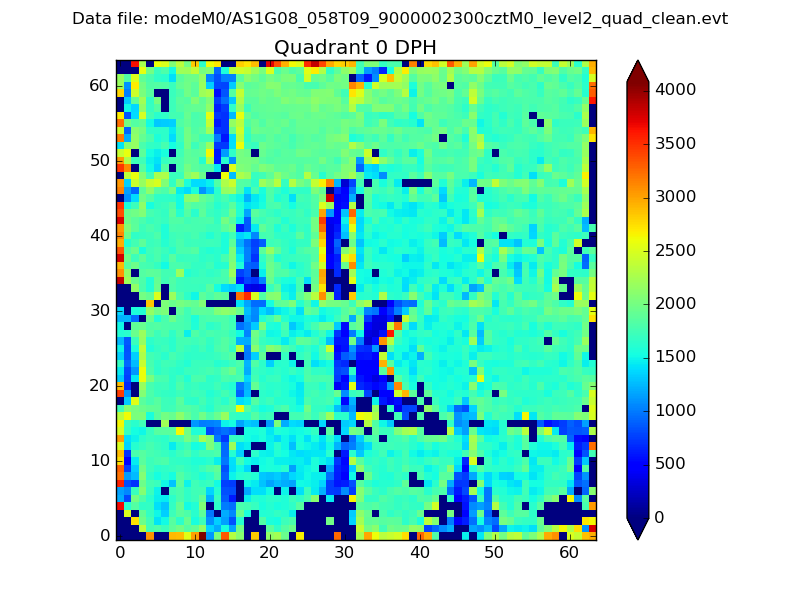 |
 |
Quadrant B |
|---|---|---|---|
| Quadrant D |  |
 |
Quadrant C |
| Plot type | Count rate plots | Images |
|---|---|---|
| Comparison with Poisson distribution Blue bars denote a histogram of data divided into 1 sec bins. Red curve is a Poisson curve with rate = median count rate of data. |
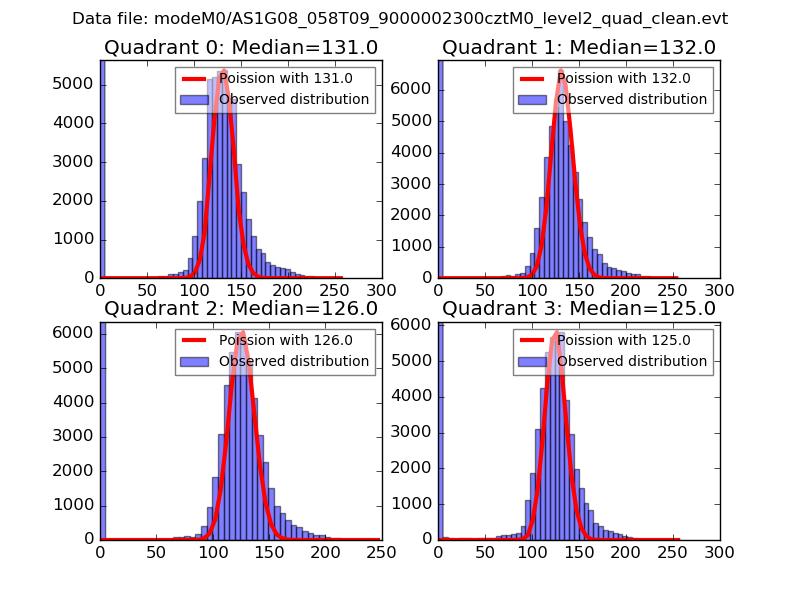 |
 |
| Quadrant-wise count rates Data is divided into 100 sec bins |
 |
|
| Module-wise count rates for Quadrant A Data is divided into 100 sec bins |
 |
 |
| Module-wise count rates for Quadrant B Data is divided into 100 sec bins |
 |
 |
| Module-wise count rates for Quadrant C Data is divided into 100 sec bins |
 |
 |
| Module-wise count rates for Quadrant D Data is divided into 100 sec bins |
 |
 |
| Parameter | Plot |
|---|---|
| CZT HV Monitor |  |
| D_VDD |  |
| Temperature 1 |  |
| Veto HV Monitor |  |
| Veto LLD |  |
| Alpha Counter |  |
| _CPM_Rate |  |
| CZT Counter |  |
| +2.5 Volts monitor |  |
| +5 Volts monitor |  |
| _ROLL_ROT | 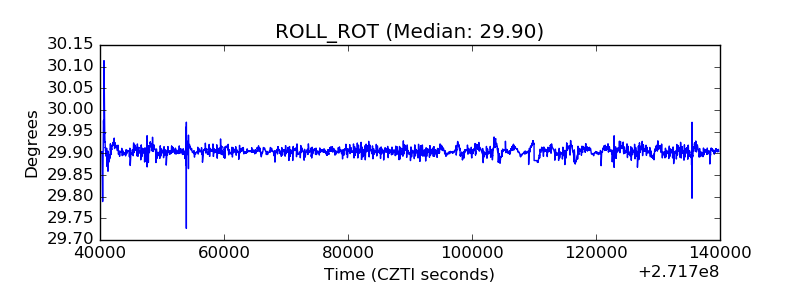 |
| _Roll_DEC | 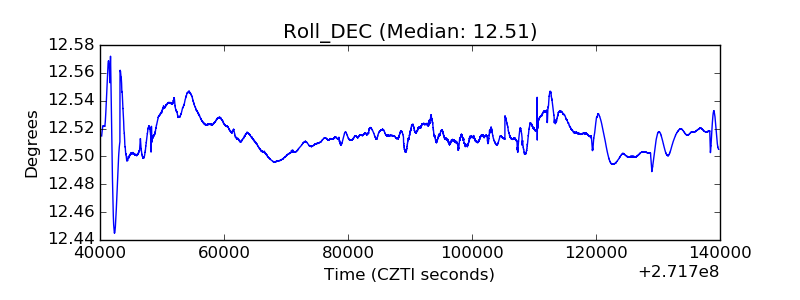 |
| _Roll_RA |  |
| Veto Counter |  |