| Param | Original file | Final file |
|---|---|---|
| Filename | modeM0/AS1A05_182T02_9000002392cztM0_level2_bc.evt | modeM0/AS1A05_182T02_9000002392cztM0_level2_quad_clean.evt |
| Size (bytes) | 830,416,320 | 308,237,760 |
| Size | 791.9 MB | 294.0 MB |
| Events in quadrant A | 4,486,816 | 2,110,471 |
| Events in quadrant B | 9,996,203 | 1,978,313 |
| Events in quadrant C | 4,171,991 | 2,019,088 |
| Events in quadrant D | 5,267,129 | 1,992,039 |
| Mode M9 | |||
|---|---|---|---|
| Quadrant | BADHDUFLAG | Total packets | Discarded packets |
| A | 0 | 45 | 0 |
| B | 0 | 45 | 0 |
| C | 0 | 45 | 0 |
| D | 0 | 45 | 0 |
| Mode M0 | |||
|---|---|---|---|
| Quadrant | BADHDUFLAG | Total packets | Discarded packets |
| A | 0 | 38541 | 0 |
| B | 0 | 62221 | 0 |
| C | 0 | 37998 | 0 |
| D | 0 | 41073 | 0 |
| Mode SS | |||
|---|---|---|---|
| Quadrant | BADHDUFLAG | Total packets | Discarded packets |
| A | 0 | 364 | 0 |
| B | 0 | 364 | 0 |
| C | 0 | 364 | 0 |
| D | 0 | 364 | 0 |
| Quadrant | Total seconds | Saturated seconds | Saturation percentage |
|---|---|---|---|
| A | 17936 | 207 | 1.154103% |
| B | 17936 | 2632 | 14.674398% |
| C | 17936 | 253 | 1.410571% |
| D | 17936 | 230 | 1.282337% |
Noise dominated data is calculated using 1-second bins in cleaned event files. If a bin has >2000 counts, and if more than 50% of those come from <1% of pixels, then it is considered to be noise-dominated and hence unusable.
| Quadrant | # 1 sec bins | Bins with >0 counts | Bins with >2000 counts | High rate bins dominated by noise | Noise dominated (total time) | Noise dominated (detector-on time) | Marked lightcurve |
|---|---|---|---|---|---|---|---|
| A | 21906 | 17936 | 1 | 1 | 0.00% | 0.01% | 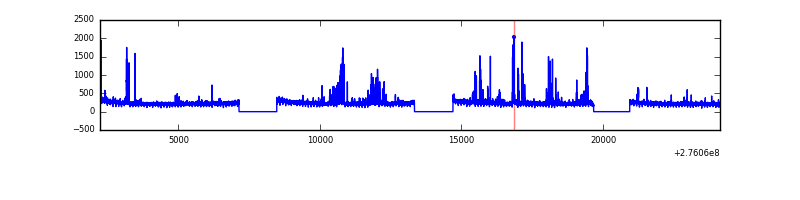 |
| B | 21906 | 17933 | 220 | 220 | 1.00% | 1.23% |  |
| C | 21906 | 17936 | 0 | 0 | 0.00% | 0.00% |  |
| D | 21907 | 17937 | 19 | 19 | 0.09% | 0.11% | 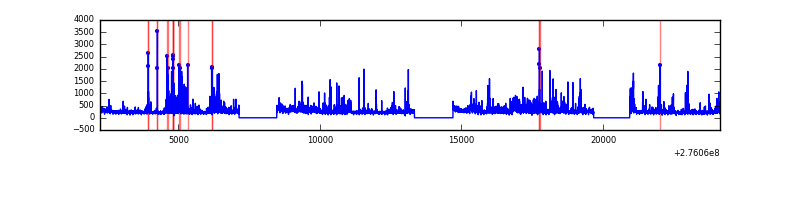 |
Top three noisy pixels from each quadrant. If the there are fewer than three noisy pixels in the level2.evt file, extra rows are filled as -1
| Pixel properties | Quadrant properties | ||||||
|---|---|---|---|---|---|---|---|
| Quadrant | DetID | PixID | Counts | Sigma | Mean | Median | Sigma |
| A | 15 | 174 | 247268 | 1095.69 | 1047 | 1033 | 224.7 |
| A | 9 | 143 | 200678 | 888.37 | 1047 | 1033 | 224.7 |
| A | 14 | 4 | 15895 | 66.13 | 1047 | 1033 | 224.7 |
| B | 3 | 112 | 5581993 | 30304.2 | 985 | 967 | 184.2 |
| B | 0 | 198 | 154644 | 834.44 | 985 | 967 | 184.2 |
| B | 4 | 216 | 129349 | 697.1 | 985 | 967 | 184.2 |
| C | 3 | 233 | 285908 | 1242.34 | 989 | 987 | 229.3 |
| C | 0 | 207 | 79177 | 340.93 | 989 | 987 | 229.3 |
| C | 7 | 247 | 9630 | 37.69 | 989 | 987 | 229.3 |
| D | 1 | 52 | 1029533 | 4454.85 | 1018 | 986 | 230.9 |
| D | 10 | 70 | 193104 | 832.1 | 1018 | 986 | 230.9 |
| D | 15 | 0 | 73637 | 314.66 | 1018 | 986 | 230.9 |
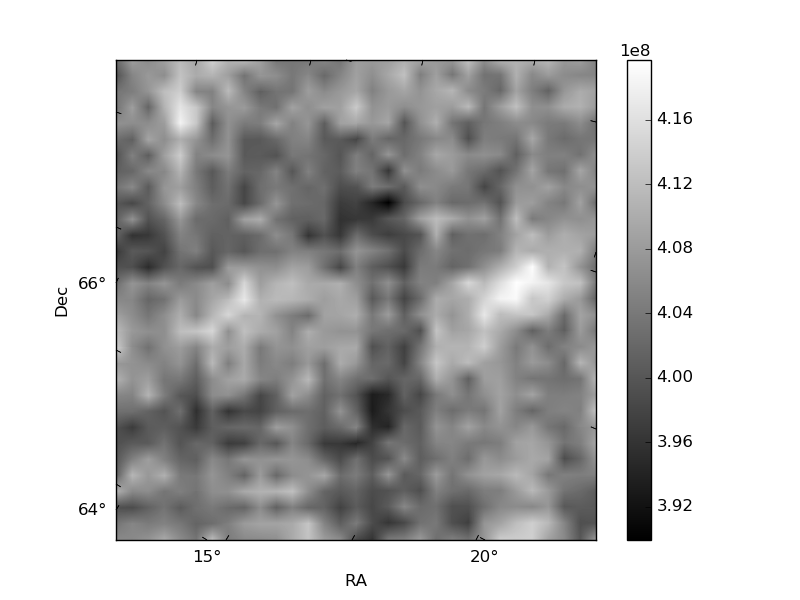
Histogram calculated using DETX and DETY for each event in the final _common_clean file
| Quadrant A | 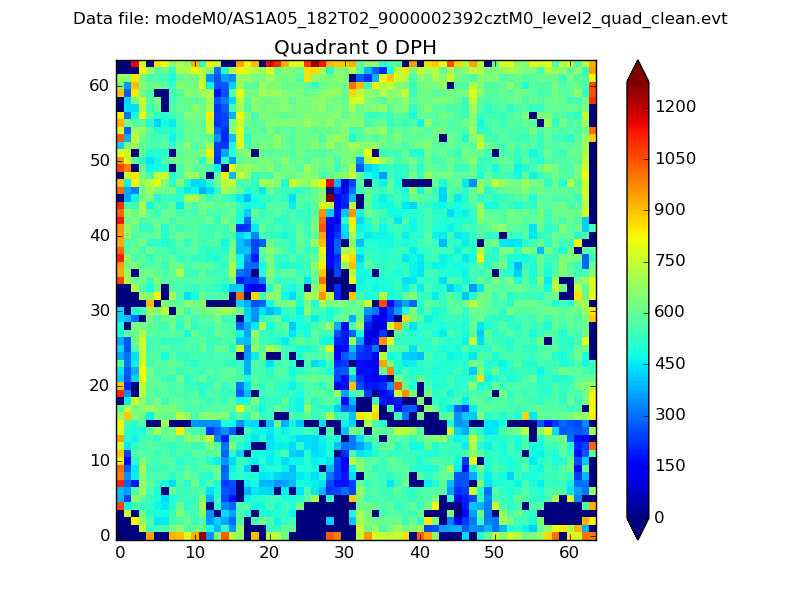 |
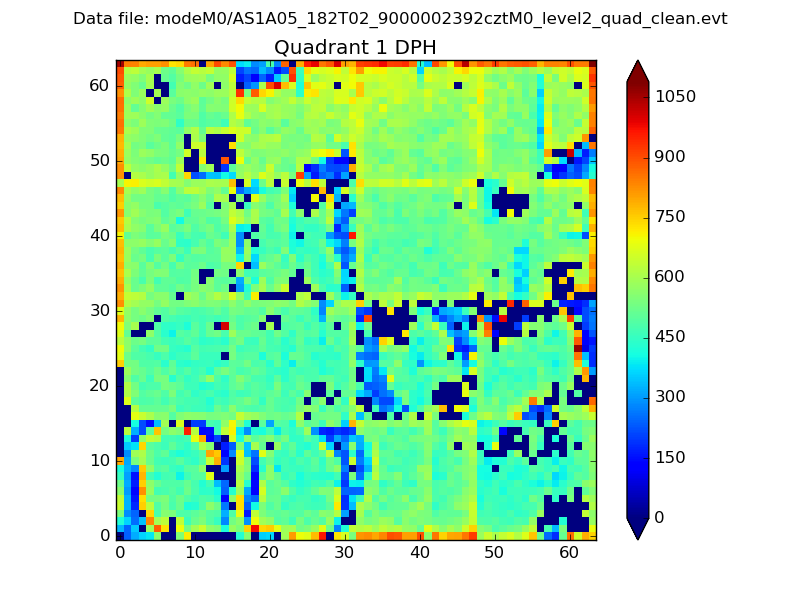 |
Quadrant B |
|---|---|---|---|
| Quadrant D | 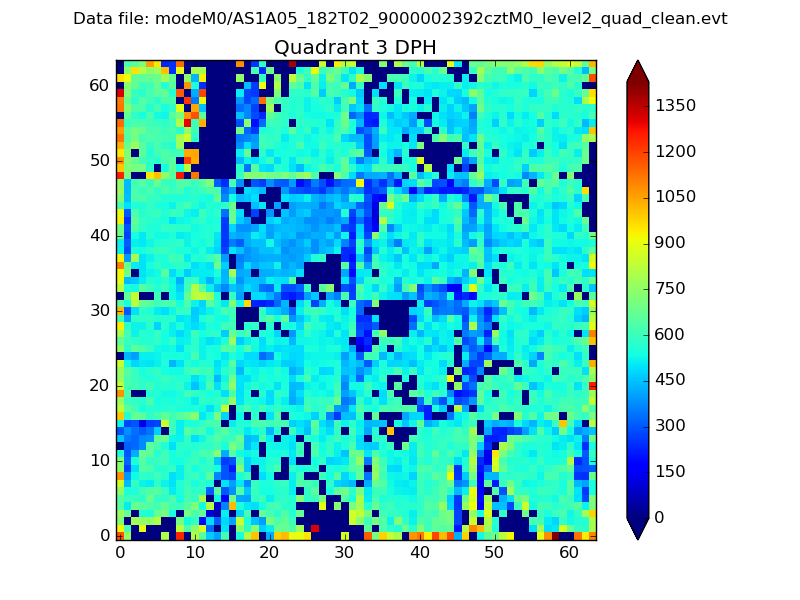 |
 |
Quadrant C |
| Plot type | Count rate plots | Images |
|---|---|---|
| Comparison with Poisson distribution Blue bars denote a histogram of data divided into 1 sec bins. Red curve is a Poisson curve with rate = median count rate of data. |
 |
 |
| Quadrant-wise count rates Data is divided into 100 sec bins |
 |
|
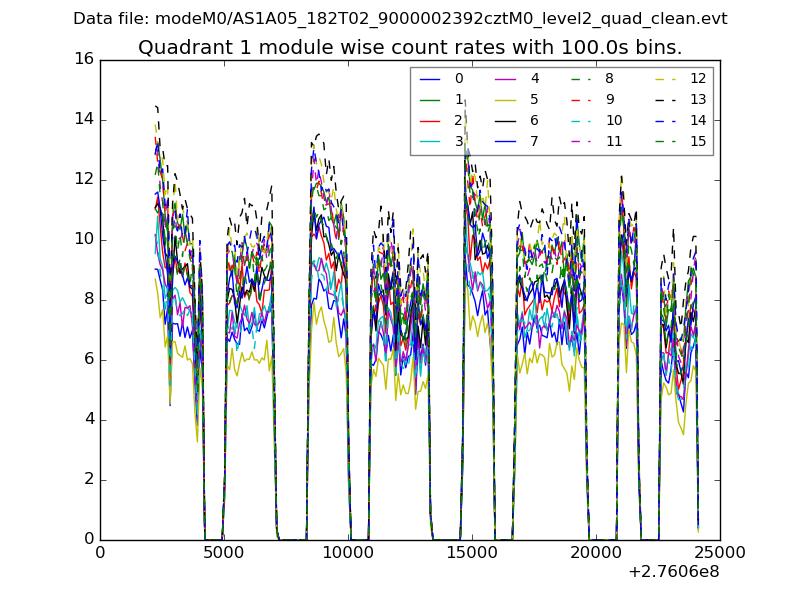
| Module-wise count rates for Quadrant A Data is divided into 100 sec bins |
 |
 |
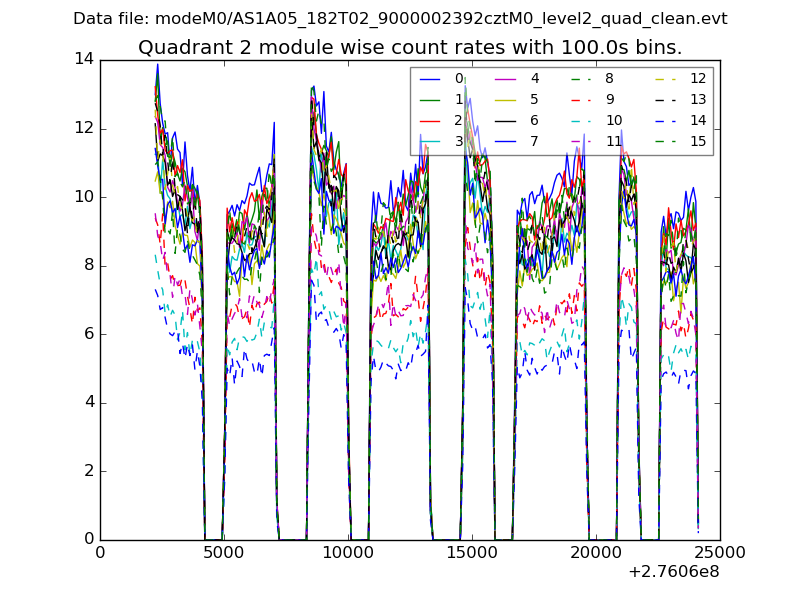
| Module-wise count rates for Quadrant B Data is divided into 100 sec bins |
 |
 |
| Module-wise count rates for Quadrant C Data is divided into 100 sec bins |
 |
 |
| Module-wise count rates for Quadrant D Data is divided into 100 sec bins |
 |
 |
| Parameter | Plot |
|---|---|
| CZT HV Monitor | 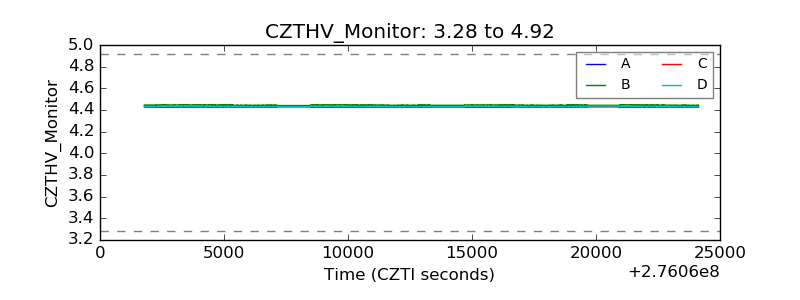 |
| D_VDD |  |
| Temperature 1 | 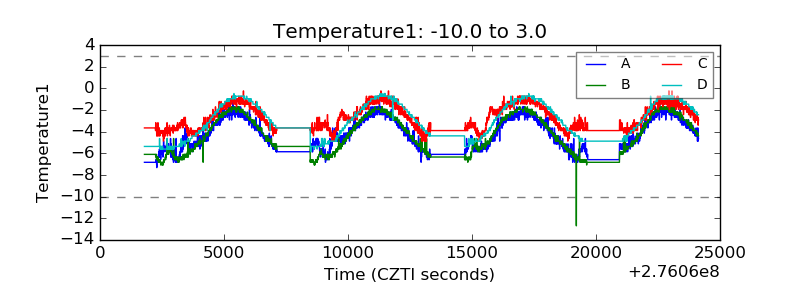 |
| Veto HV Monitor |  |
| Veto LLD |  |
| Alpha Counter | 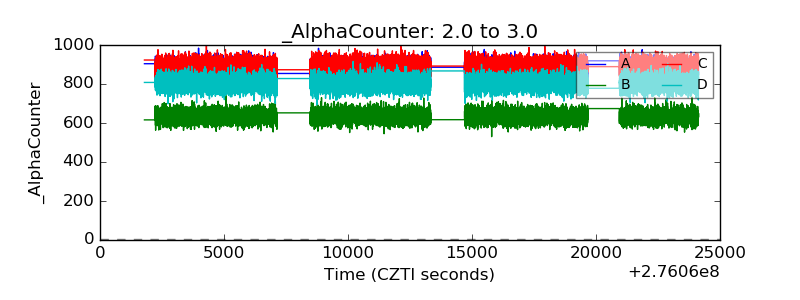 |
| _CPM_Rate | 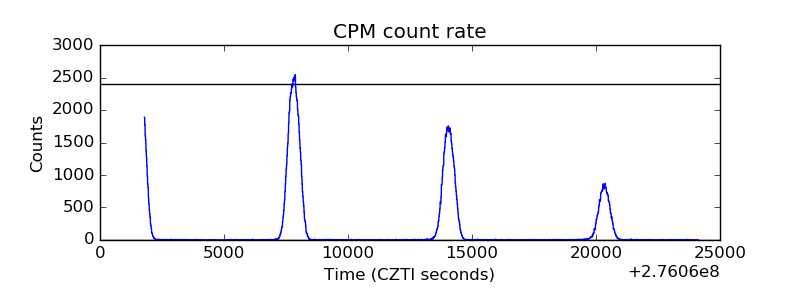 |
| CZT Counter |  |
| +2.5 Volts monitor |  |
| +5 Volts monitor | 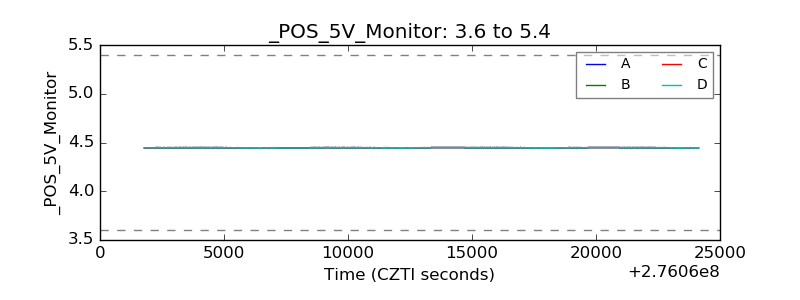 |
| _ROLL_ROT |  |
| _Roll_DEC | 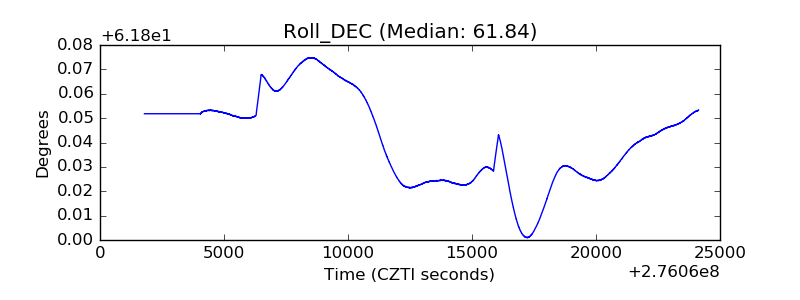 |
| _Roll_RA | 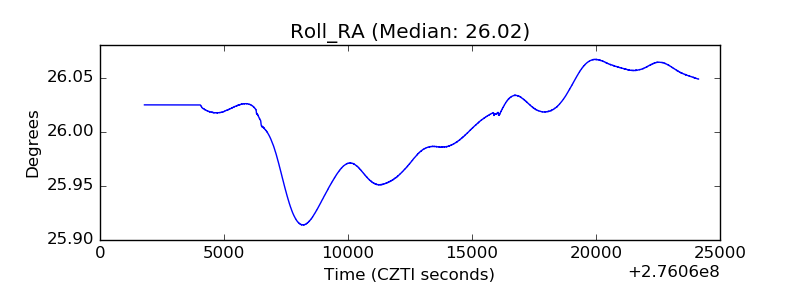 |
| Veto Counter | 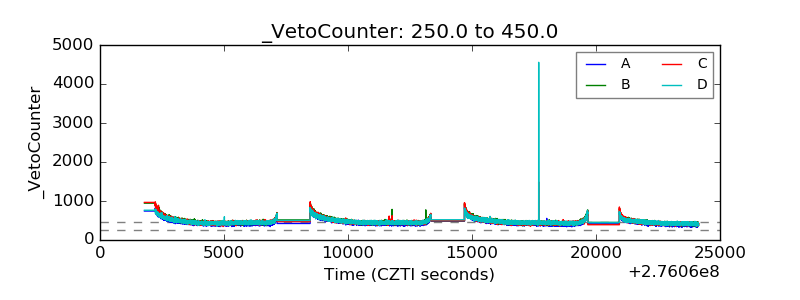 |