| Param | Original file | Final file |
|---|---|---|
| Filename | modeM0/AS1A05_084T06_9000002626cztM0_level2_bc.evt | modeM0/AS1A05_084T06_9000002626cztM0_level2_quad_clean.evt |
| Size (bytes) | 299,249,280 | 105,264,000 |
| Size | 285.4 MB | 100.4 MB |
| Events in quadrant A | 2,380,883 | 648,640 |
| Events in quadrant B | 2,146,619 | 652,645 |
| Events in quadrant C | 1,931,271 | 625,918 |
| Events in quadrant D | 1,962,196 | 615,307 |
| Mode SS | |||
|---|---|---|---|
| Quadrant | BADHDUFLAG | Total packets | Discarded packets |
| A | 0 | 192 | 0 |
| B | 0 | 192 | 0 |
| C | 0 | 192 | 0 |
| D | 0 | 192 | 0 |
| Mode M0 | |||
|---|---|---|---|
| Quadrant | BADHDUFLAG | Total packets | Discarded packets |
| A | 0 | 21562 | 0 |
| B | 0 | 20021 | 0 |
| C | 0 | 19249 | 0 |
| D | 0 | 19305 | 0 |
| Mode M9 | |||
|---|---|---|---|
| Quadrant | BADHDUFLAG | Total packets | Discarded packets |
| A | 0 | 18 | 0 |
| B | 0 | 18 | 0 |
| C | 0 | 18 | 0 |
| D | 0 | 18 | 0 |
| Quadrant | Total seconds | Saturated seconds | Saturation percentage |
|---|---|---|---|
| A | 9297 | 241 | 2.592234% |
| B | 9297 | 92 | 0.989567% |
| C | 9297 | 93 | 1.000323% |
| D | 9297 | 40 | 0.430246% |
Noise dominated data is calculated using 1-second bins in cleaned event files. If a bin has >2000 counts, and if more than 50% of those come from <1% of pixels, then it is considered to be noise-dominated and hence unusable.
| Quadrant | # 1 sec bins | Bins with >0 counts | Bins with >2000 counts | High rate bins dominated by noise | Noise dominated (total time) | Noise dominated (detector-on time) | Marked lightcurve |
|---|---|---|---|---|---|---|---|
| A | 11122 | 9297 | 14 | 14 | 0.13% | 0.15% |  |
| B | 11122 | 9297 | 2 | 2 | 0.02% | 0.02% | 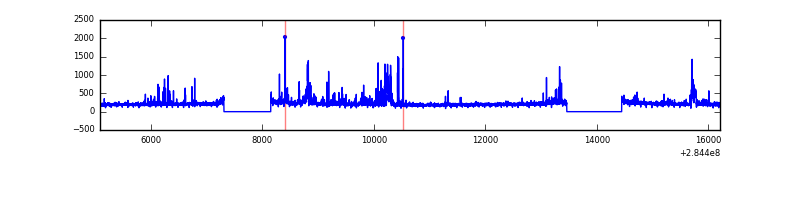 |
| C | 11122 | 9297 | 0 | 0 | 0.00% | 0.00% |  |
| D | 11122 | 9297 | 6 | 6 | 0.05% | 0.06% | 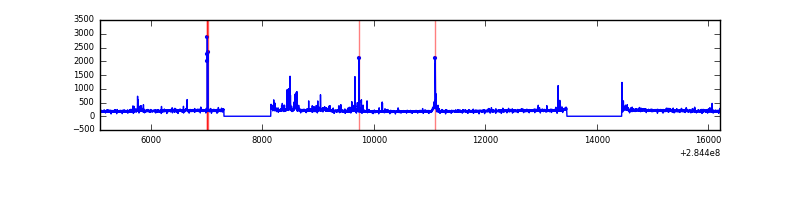 |
Top three noisy pixels from each quadrant. If the there are fewer than three noisy pixels in the level2.evt file, extra rows are filled as -1
| Pixel properties | Quadrant properties | ||||||
|---|---|---|---|---|---|---|---|
| Quadrant | DetID | PixID | Counts | Sigma | Mean | Median | Sigma |
| A | 15 | 174 | 585688 | 5553.85 | 467 | 457 | 105.4 |
| A | 0 | 226 | 3046 | 24.57 | 467 | 457 | 105.4 |
| A | 12 | 194 | 2969 | 23.84 | 467 | 457 | 105.4 |
| B | 0 | 229 | 162051 | 1728.27 | 477 | 465 | 93.5 |
| B | 10 | 245 | 88576 | 942.41 | 477 | 465 | 93.5 |
| B | 0 | 189 | 37242 | 393.36 | 477 | 465 | 93.5 |
| C | 3 | 233 | 124830 | 1153.76 | 454 | 448 | 107.8 |
| C | 5 | 218 | 42721 | 392.12 | 454 | 448 | 107.8 |
| C | 1 | 16 | 6354 | 54.78 | 454 | 448 | 107.8 |
| D | 7 | 238 | 43939 | 388.67 | 462 | 446 | 111.9 |
| D | 2 | 234 | 35040 | 309.15 | 462 | 446 | 111.9 |
| D | 2 | 33 | 31315 | 275.86 | 462 | 446 | 111.9 |
Histogram calculated using DETX and DETY for each event in the final _common_clean file
| Quadrant A |  |
 |
Quadrant B |
|---|---|---|---|
| Quadrant D |  |
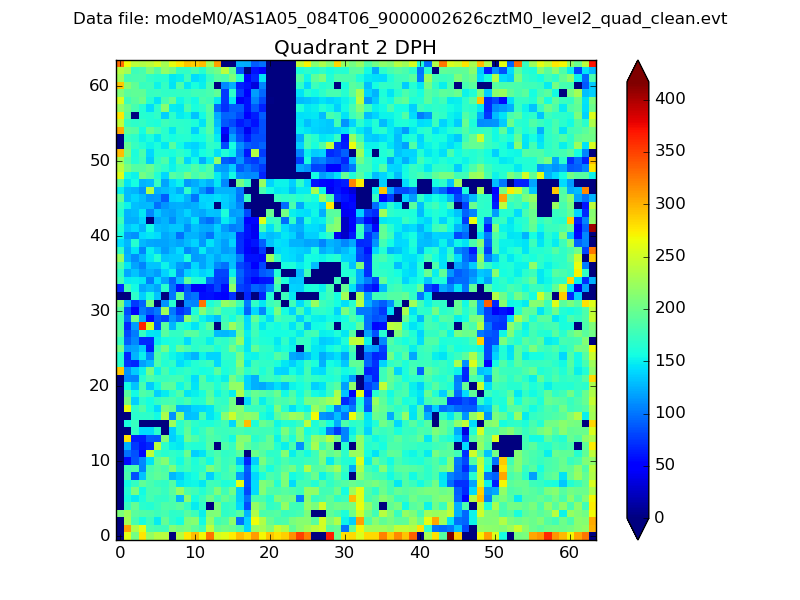 |
Quadrant C |
| Plot type | Count rate plots | Images |
|---|---|---|
| Comparison with Poisson distribution Blue bars denote a histogram of data divided into 1 sec bins. Red curve is a Poisson curve with rate = median count rate of data. |
 |
 |
| Quadrant-wise count rates Data is divided into 100 sec bins |
 |
|
| Module-wise count rates for Quadrant A Data is divided into 100 sec bins |
 |
 |
| Module-wise count rates for Quadrant B Data is divided into 100 sec bins |
 |
 |
| Module-wise count rates for Quadrant C Data is divided into 100 sec bins |
 |
 |
| Module-wise count rates for Quadrant D Data is divided into 100 sec bins |
 |
 |
| Parameter | Plot |
|---|---|
| CZT HV Monitor |  |
| D_VDD | 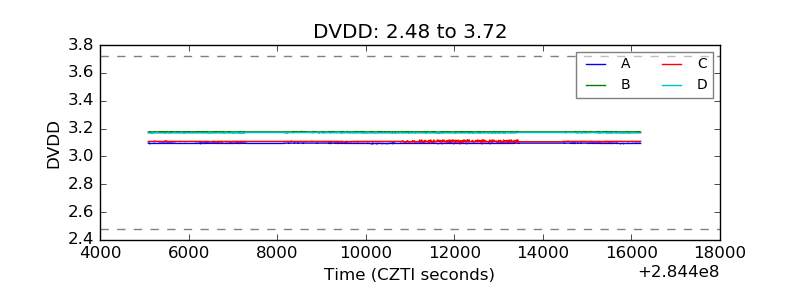 |
| Temperature 1 |  |
| Veto HV Monitor |  |
| Veto LLD | 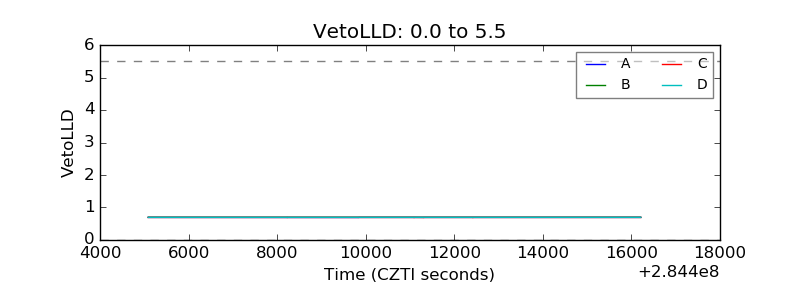 |
| Alpha Counter |  |
| _CPM_Rate |  |
| CZT Counter | 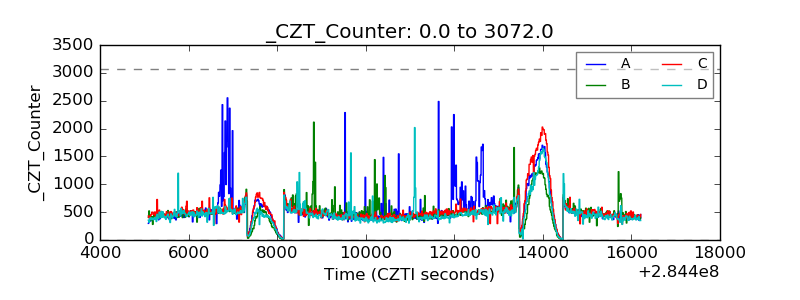 |
| +2.5 Volts monitor |  |
| +5 Volts monitor |  |
| _ROLL_ROT |  |
| _Roll_DEC |  |
| _Roll_RA |  |
| Veto Counter |  |