| Param | Original file | Final file |
|---|---|---|
| Filename | modeM0/AS1A05_101T06_9000002656cztM0_level2_bc.evt | modeM0/AS1A05_101T06_9000002656cztM0_level2_quad_clean.evt |
| Size (bytes) | 567,446,400 | 224,640,000 |
| Size | 541.2 MB | 214.2 MB |
| Events in quadrant A | 3,579,598 | 1,431,805 |
| Events in quadrant B | 4,537,250 | 1,452,674 |
| Events in quadrant C | 3,393,238 | 1,382,967 |
| Events in quadrant D | 4,492,748 | 1,347,319 |
| Mode M9 | |||
|---|---|---|---|
| Quadrant | BADHDUFLAG | Total packets | Discarded packets |
| A | 0 | 43 | 0 |
| B | 0 | 43 | 0 |
| C | 0 | 43 | 0 |
| D | 0 | 43 | 0 |
| Mode SS | |||
|---|---|---|---|
| Quadrant | BADHDUFLAG | Total packets | Discarded packets |
| A | 0 | 354 | 0 |
| B | 0 | 354 | 0 |
| C | 0 | 354 | 0 |
| D | 0 | 354 | 0 |
| Mode M0 | |||
|---|---|---|---|
| Quadrant | BADHDUFLAG | Total packets | Discarded packets |
| A | 0 | 35878 | 0 |
| B | 0 | 39437 | 0 |
| C | 0 | 35498 | 0 |
| D | 0 | 38462 | 0 |
| Quadrant | Total seconds | Saturated seconds | Saturation percentage |
|---|---|---|---|
| A | 17242 | 134 | 0.777172% |
| B | 17242 | 337 | 1.954530% |
| C | 17242 | 186 | 1.078761% |
| D | 17242 | 232 | 1.345552% |
Noise dominated data is calculated using 1-second bins in cleaned event files. If a bin has >2000 counts, and if more than 50% of those come from <1% of pixels, then it is considered to be noise-dominated and hence unusable.
| Quadrant | # 1 sec bins | Bins with >0 counts | Bins with >2000 counts | High rate bins dominated by noise | Noise dominated (total time) | Noise dominated (detector-on time) | Marked lightcurve |
|---|---|---|---|---|---|---|---|
| A | 21538 | 17245 | 0 | 0 | 0.00% | 0.00% |  |
| B | 21538 | 17243 | 3 | 3 | 0.01% | 0.02% |  |
| C | 21538 | 17243 | 0 | 0 | 0.00% | 0.00% |  |
| D | 21538 | 17243 | 49 | 49 | 0.23% | 0.28% |  |
Top three noisy pixels from each quadrant. If the there are fewer than three noisy pixels in the level2.evt file, extra rows are filled as -1
| Pixel properties | Quadrant properties | ||||||
|---|---|---|---|---|---|---|---|
| Quadrant | DetID | PixID | Counts | Sigma | Mean | Median | Sigma |
| A | 15 | 174 | 73527 | 360.27 | 909 | 892 | 201.6 |
| A | 14 | 238 | 6127 | 25.97 | 909 | 892 | 201.6 |
| A | 0 | 226 | 6038 | 25.52 | 909 | 892 | 201.6 |
| B | 15 | 222 | 499460 | 2867.9 | 920 | 898 | 173.8 |
| B | 0 | 189 | 86348 | 491.54 | 920 | 898 | 173.8 |
| B | 15 | 35 | 67202 | 381.4 | 920 | 898 | 173.8 |
| C | 3 | 233 | 23235 | 109.16 | 869 | 863 | 204.9 |
| C | 5 | 218 | 11540 | 52.09 | 869 | 863 | 204.9 |
| C | 8 | 208 | 8722 | 38.34 | 869 | 863 | 204.9 |
| D | 7 | 238 | 734561 | 3228.62 | 874 | 848 | 227.3 |
| D | 10 | 70 | 122454 | 535.11 | 874 | 848 | 227.3 |
| D | 2 | 234 | 81392 | 354.42 | 874 | 848 | 227.3 |
Histogram calculated using DETX and DETY for each event in the final _common_clean file
| Quadrant A | 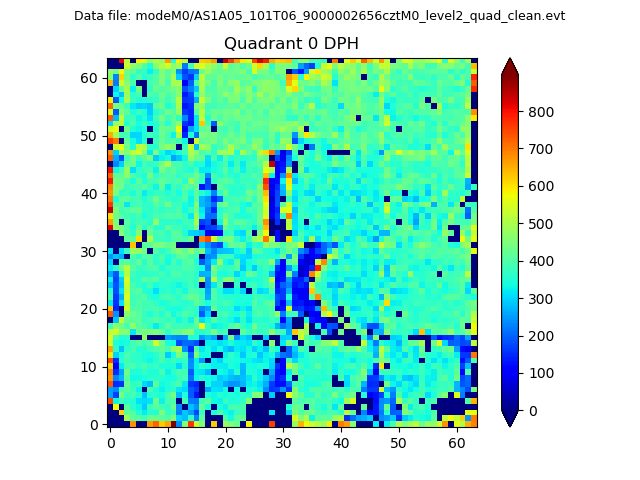 |
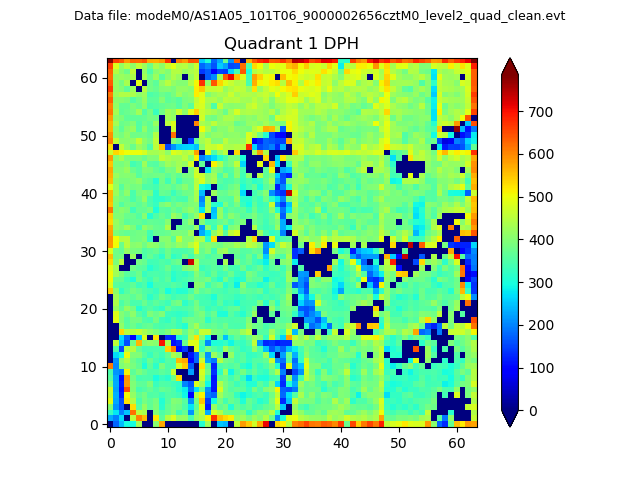 |
Quadrant B |
|---|---|---|---|
| Quadrant D | 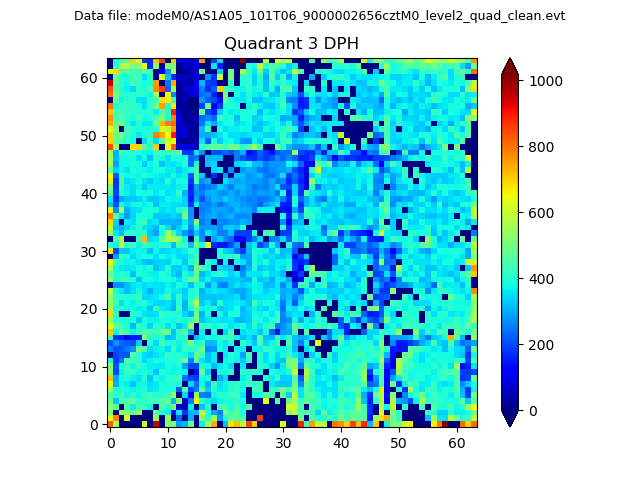 |
 |
Quadrant C |
| Plot type | Count rate plots | Images |
|---|---|---|
| Comparison with Poisson distribution Blue bars denote a histogram of data divided into 1 sec bins. Red curve is a Poisson curve with rate = median count rate of data. |
 |
 |
| Quadrant-wise count rates Data is divided into 100 sec bins |
 |
|
| Module-wise count rates for Quadrant A Data is divided into 100 sec bins |
 |
 |
| Module-wise count rates for Quadrant B Data is divided into 100 sec bins |
 |
 |
| Module-wise count rates for Quadrant C Data is divided into 100 sec bins |
 |
 |
| Module-wise count rates for Quadrant D Data is divided into 100 sec bins |
 |
 |
| Parameter | Plot |
|---|---|
| CZT HV Monitor | 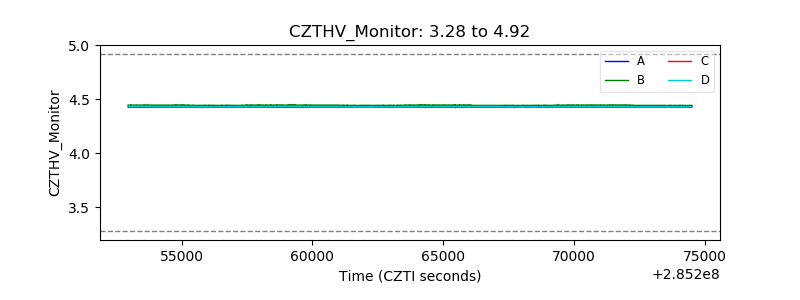 |
| D_VDD |  |
| Temperature 1 | 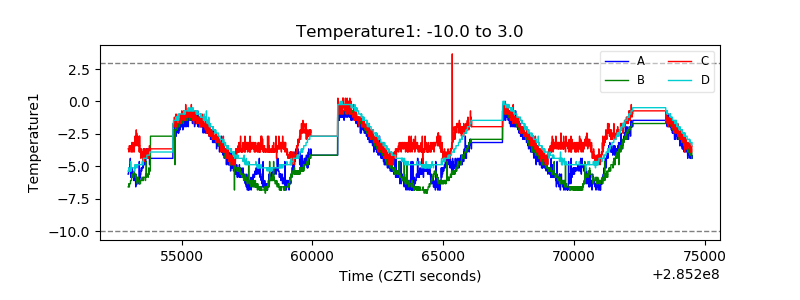 |
| Veto HV Monitor |  |
| Veto LLD |  |
| Alpha Counter |  |
| _CPM_Rate | 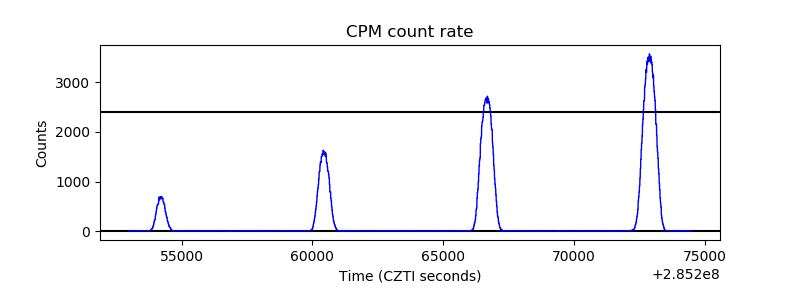 |
| CZT Counter |  |
| +2.5 Volts monitor |  |
| +5 Volts monitor |  |
| _ROLL_ROT |  |
| _Roll_DEC |  |
| _Roll_RA | 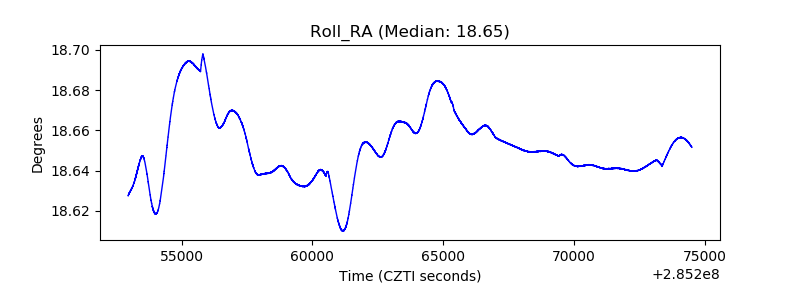 |
| Veto Counter |  |