| Param | Original file | Final file |
|---|---|---|
| Filename | modeM0/AS1A05_109T01_9000002662cztM0_level2_bc.evt | modeM0/AS1A05_109T01_9000002662cztM0_level2_quad_clean.evt |
| Size (bytes) | 934,698,240 | 369,944,640 |
| Size | 891.4 MB | 352.8 MB |
| Events in quadrant A | 6,146,179 | 2,315,849 |
| Events in quadrant B | 6,600,357 | 2,365,315 |
| Events in quadrant C | 6,023,643 | 2,279,038 |
| Events in quadrant D | 7,544,585 | 2,241,294 |
| Mode M0 | |||
|---|---|---|---|
| Quadrant | BADHDUFLAG | Total packets | Discarded packets |
| A | 0 | 61483 | 0 |
| B | 0 | 62844 | 0 |
| C | 0 | 61533 | 0 |
| D | 0 | 64715 | 0 |
| Mode SS | |||
|---|---|---|---|
| Quadrant | BADHDUFLAG | Total packets | Discarded packets |
| A | 0 | 594 | 0 |
| B | 0 | 594 | 0 |
| C | 0 | 594 | 0 |
| D | 0 | 594 | 0 |
| Mode M9 | |||
|---|---|---|---|
| Quadrant | BADHDUFLAG | Total packets | Discarded packets |
| A | 0 | 53 | 0 |
| B | 0 | 53 | 0 |
| C | 0 | 53 | 0 |
| D | 0 | 53 | 0 |
| Quadrant | Total seconds | Saturated seconds | Saturation percentage |
|---|---|---|---|
| A | 29145 | 349 | 1.197461% |
| B | 29145 | 344 | 1.180305% |
| C | 29145 | 437 | 1.499400% |
| D | 29145 | 306 | 1.049923% |
Noise dominated data is calculated using 1-second bins in cleaned event files. If a bin has >2000 counts, and if more than 50% of those come from <1% of pixels, then it is considered to be noise-dominated and hence unusable.
| Quadrant | # 1 sec bins | Bins with >0 counts | Bins with >2000 counts | High rate bins dominated by noise | Noise dominated (total time) | Noise dominated (detector-on time) | Marked lightcurve |
|---|---|---|---|---|---|---|---|
| A | 34089 | 29141 | 7 | 7 | 0.02% | 0.02% | 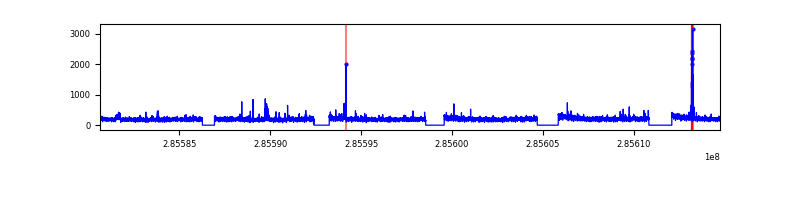 |
| B | 34089 | 29142 | 4 | 4 | 0.01% | 0.01% | 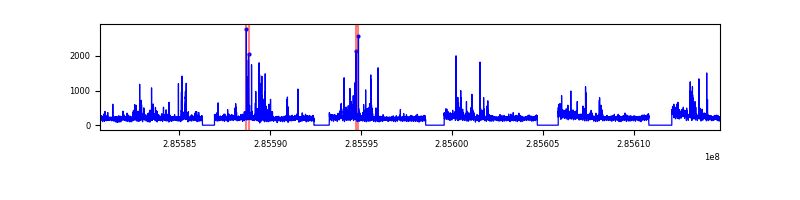 |
| C | 34089 | 29141 | 0 | 0 | 0.00% | 0.00% | 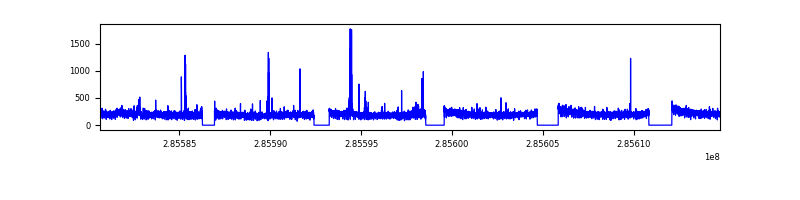 |
| D | 34089 | 29143 | 35 | 35 | 0.10% | 0.12% | 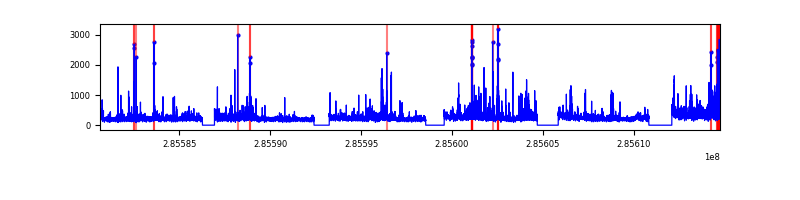 |
Top three noisy pixels from each quadrant. If the there are fewer than three noisy pixels in the level2.evt file, extra rows are filled as -1
| Pixel properties | Quadrant properties | ||||||
|---|---|---|---|---|---|---|---|
| Quadrant | DetID | PixID | Counts | Sigma | Mean | Median | Sigma |
| A | 15 | 174 | 234638 | 692.31 | 1540 | 1507 | 336.7 |
| A | 0 | 226 | 10150 | 25.67 | 1540 | 1507 | 336.7 |
| A | 12 | 194 | 10000 | 25.22 | 1540 | 1507 | 336.7 |
| B | 4 | 216 | 143411 | 482.36 | 1565 | 1526 | 294.1 |
| B | 0 | 189 | 122712 | 411.99 | 1565 | 1526 | 294.1 |
| B | 10 | 247 | 67398 | 223.94 | 1565 | 1526 | 294.1 |
| C | 3 | 233 | 122433 | 346.47 | 1503 | 1493 | 349.1 |
| C | 9 | 54 | 78785 | 221.43 | 1503 | 1493 | 349.1 |
| C | 9 | 160 | 26364 | 71.25 | 1503 | 1493 | 349.1 |
| D | 12 | 110 | 620724 | 1758.46 | 1535 | 1482 | 352.2 |
| D | 13 | 168 | 276672 | 781.45 | 1535 | 1482 | 352.2 |
| D | 5 | 222 | 263880 | 745.13 | 1535 | 1482 | 352.2 |
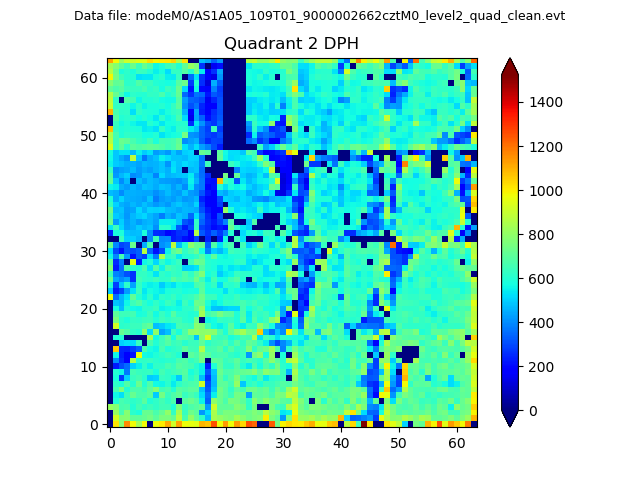
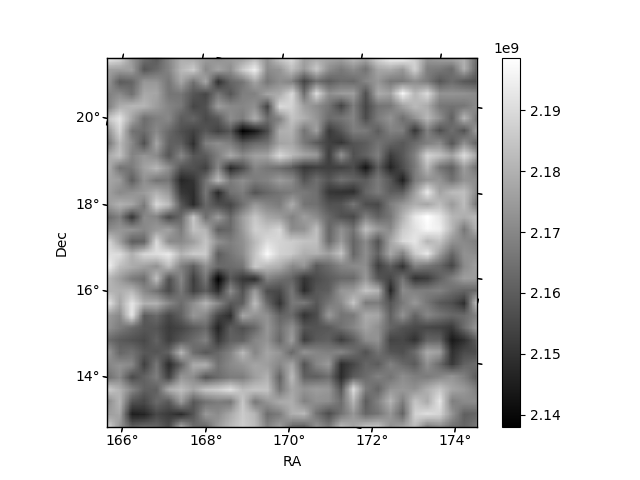
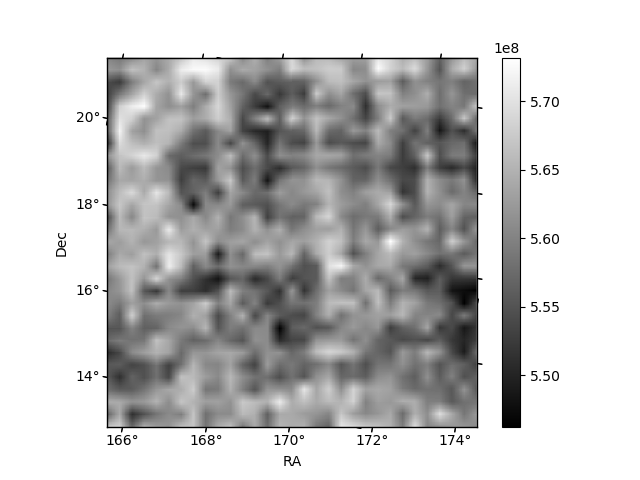
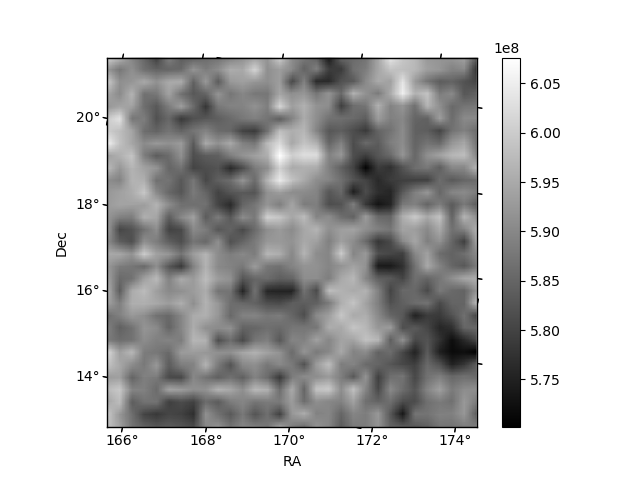
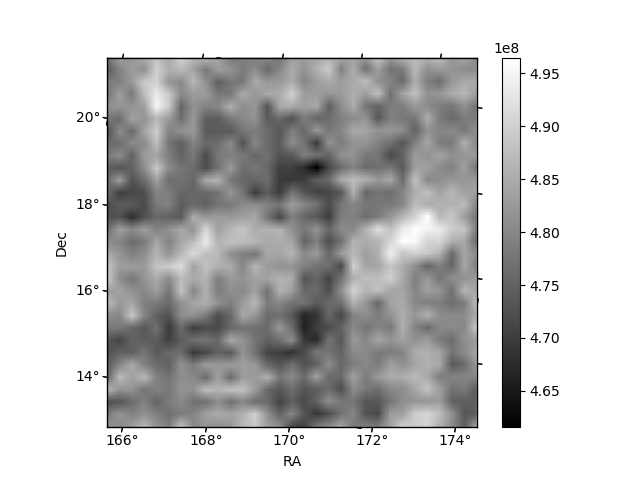
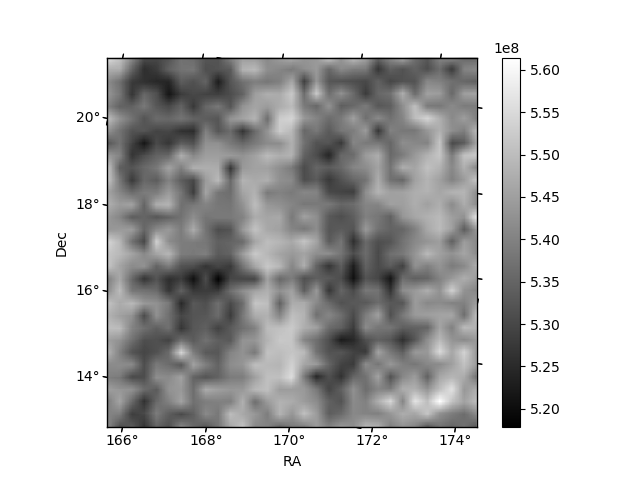
Histogram calculated using DETX and DETY for each event in the final _common_clean file
| Quadrant A | 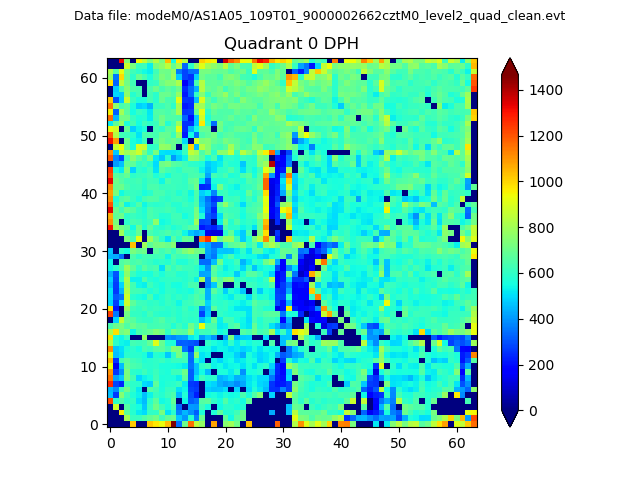 |
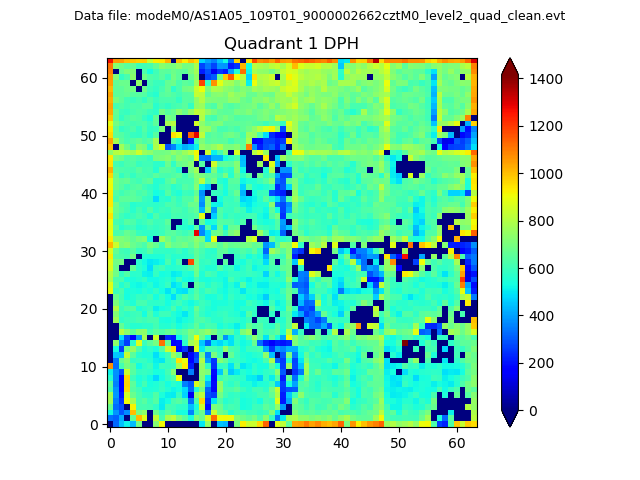 |
Quadrant B |
|---|---|---|---|
| Quadrant D | 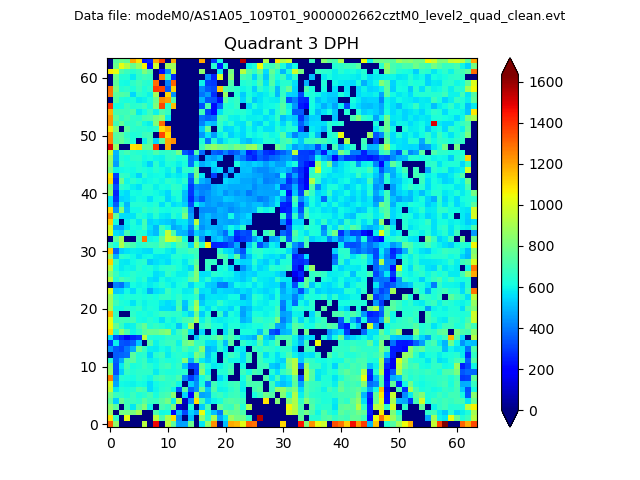 |
 |
Quadrant C |
| Plot type | Count rate plots | Images |
|---|---|---|
| Comparison with Poisson distribution Blue bars denote a histogram of data divided into 1 sec bins. Red curve is a Poisson curve with rate = median count rate of data. |
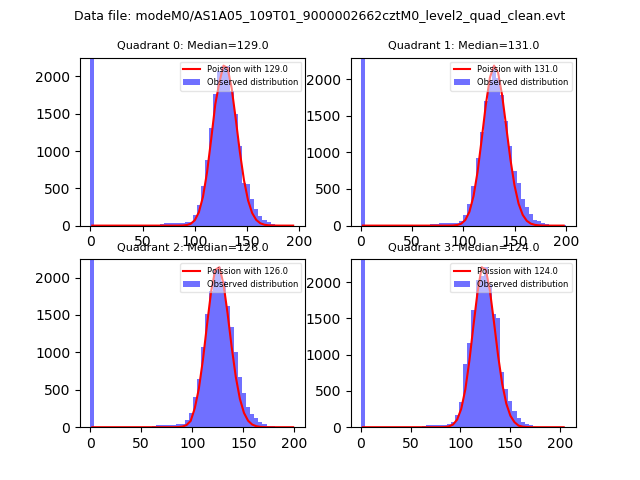 |
 |
| Quadrant-wise count rates Data is divided into 100 sec bins |
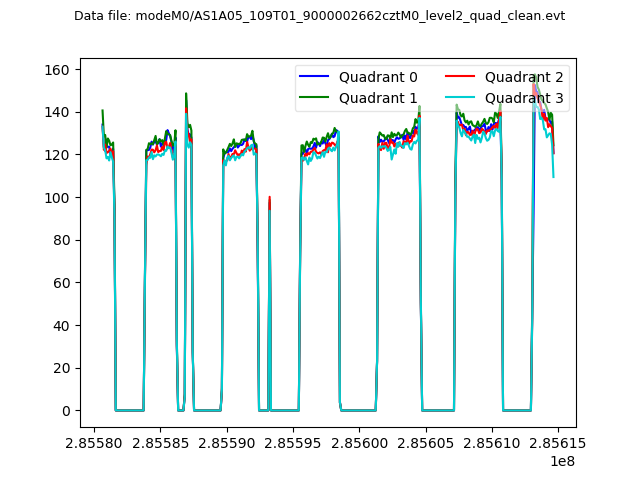 |
|
| Module-wise count rates for Quadrant A Data is divided into 100 sec bins |
 |
 |
| Module-wise count rates for Quadrant B Data is divided into 100 sec bins |
 |
 |
| Module-wise count rates for Quadrant C Data is divided into 100 sec bins |
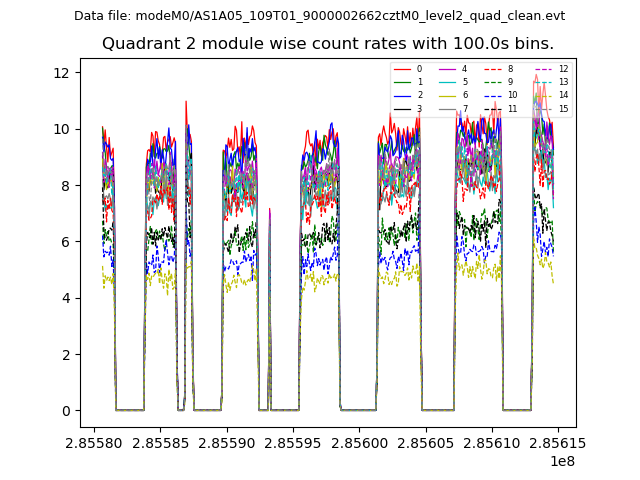 |
 |
| Module-wise count rates for Quadrant D Data is divided into 100 sec bins |
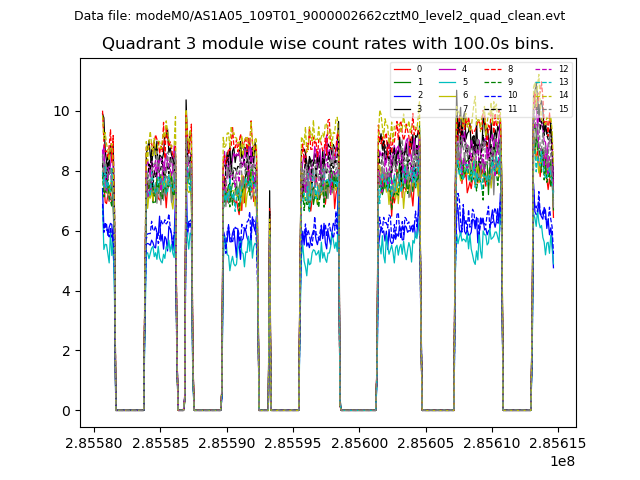 |
 |
| Parameter | Plot |
|---|---|
| CZT HV Monitor | 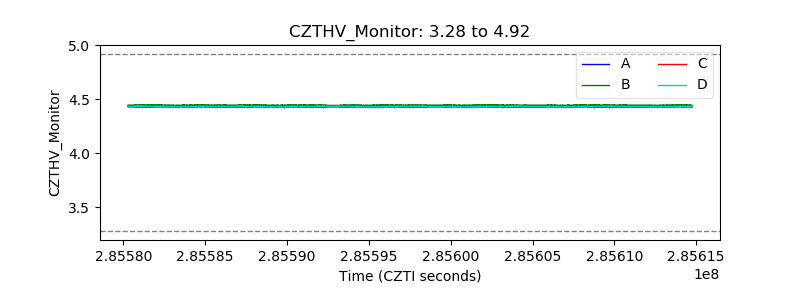 |
| D_VDD | 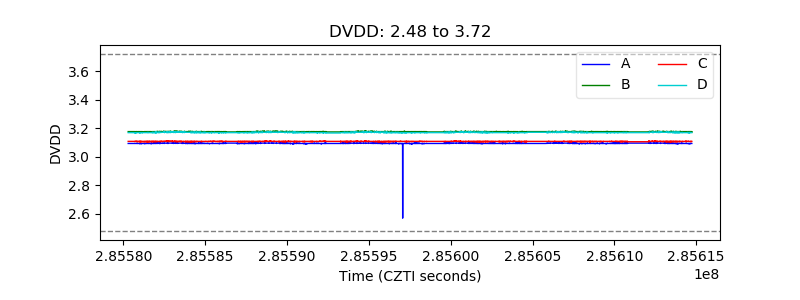 |
| Temperature 1 | 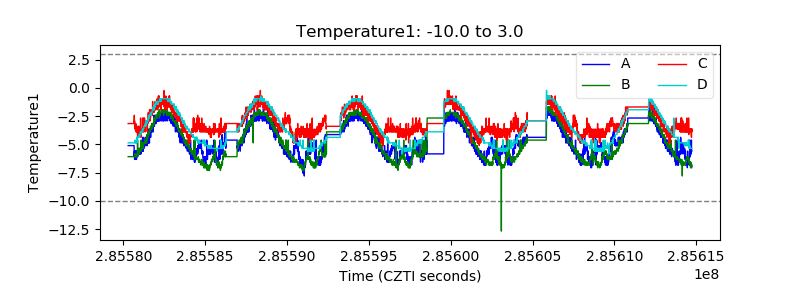 |
| Veto HV Monitor |  |
| Veto LLD | 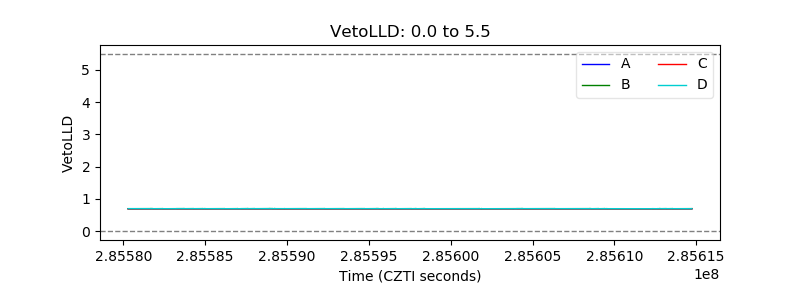 |
| Alpha Counter | 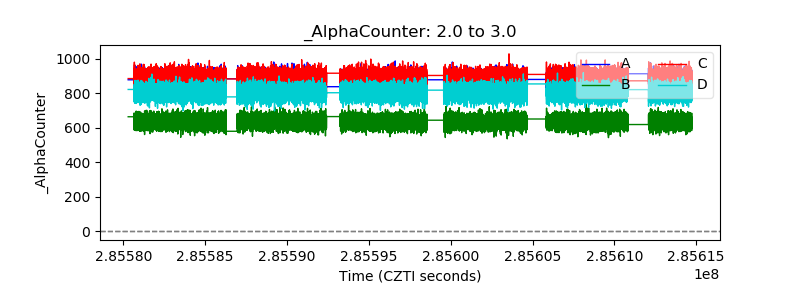 |
| _CPM_Rate | 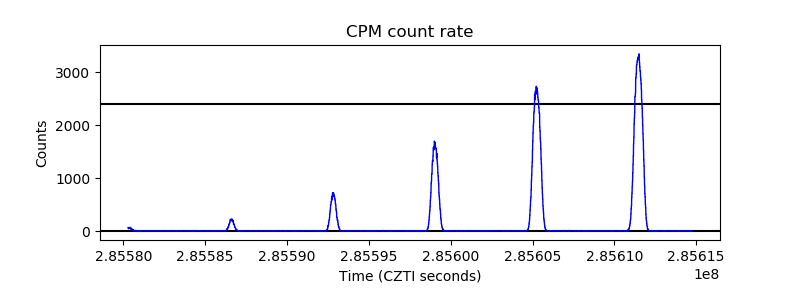 |
| CZT Counter |  |
| +2.5 Volts monitor |  |
| +5 Volts monitor | 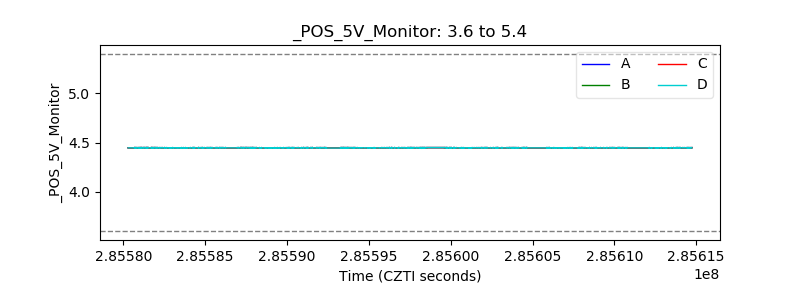 |
| _ROLL_ROT | 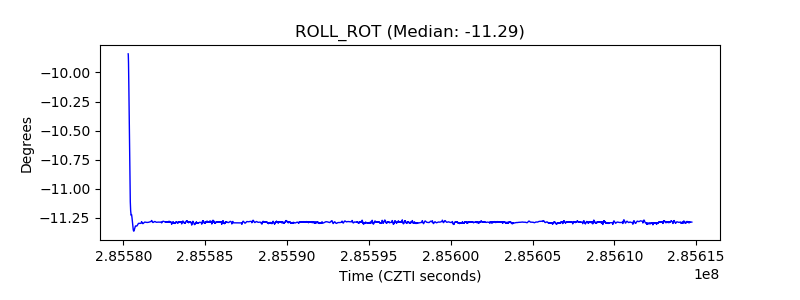 |
| _Roll_DEC |  |
| _Roll_RA | 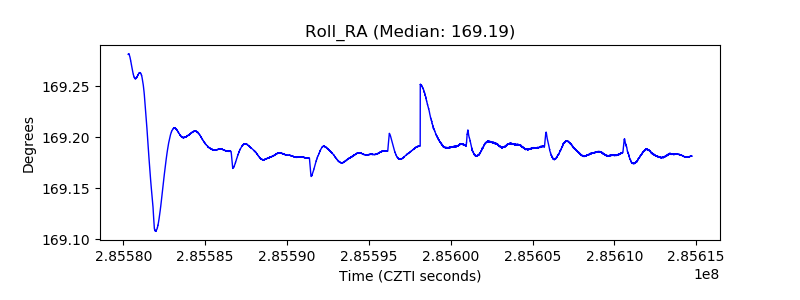 |
| Veto Counter | 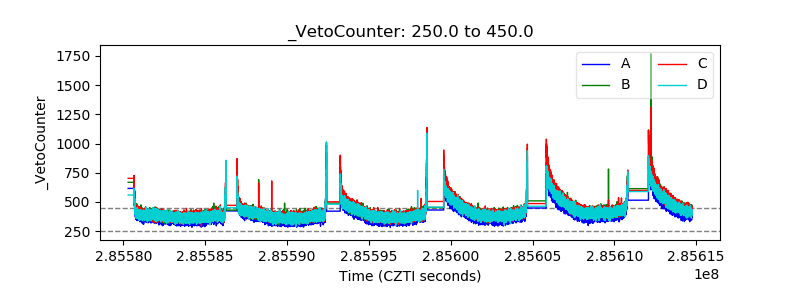 |