| Param | Original file | Final file |
|---|---|---|
| Filename | modeM0/AS1A05_227T07_9000002666cztM0_level2_bc.evt | modeM0/AS1A05_227T07_9000002666cztM0_level2_quad_clean.evt |
| Size (bytes) | 293,302,080 | 100,077,120 |
| Size | 279.7 MB | 95.4 MB |
| Events in quadrant A | 1,819,479 | 608,547 |
| Events in quadrant B | 2,042,826 | 629,816 |
| Events in quadrant C | 1,805,483 | 602,834 |
| Events in quadrant D | 2,604,494 | 575,614 |
| Mode M9 | |||
|---|---|---|---|
| Quadrant | BADHDUFLAG | Total packets | Discarded packets |
| A | 0 | 24 | 0 |
| B | 0 | 24 | 0 |
| C | 0 | 24 | 0 |
| D | 0 | 24 | 0 |
| Mode M0 | |||
|---|---|---|---|
| Quadrant | BADHDUFLAG | Total packets | Discarded packets |
| A | 0 | 18401 | 0 |
| B | 0 | 19193 | 0 |
| C | 0 | 18426 | 0 |
| D | 0 | 20967 | 0 |
| Mode SS | |||
|---|---|---|---|
| Quadrant | BADHDUFLAG | Total packets | Discarded packets |
| A | 0 | 178 | 0 |
| B | 0 | 178 | 0 |
| C | 0 | 178 | 0 |
| D | 0 | 178 | 0 |
| Quadrant | Total seconds | Saturated seconds | Saturation percentage |
|---|---|---|---|
| A | 8854 | 51 | 0.576011% |
| B | 8854 | 78 | 0.880958% |
| C | 8854 | 111 | 1.253671% |
| D | 8854 | 159 | 1.795799% |
Noise dominated data is calculated using 1-second bins in cleaned event files. If a bin has >2000 counts, and if more than 50% of those come from <1% of pixels, then it is considered to be noise-dominated and hence unusable.
| Quadrant | # 1 sec bins | Bins with >0 counts | Bins with >2000 counts | High rate bins dominated by noise | Noise dominated (total time) | Noise dominated (detector-on time) | Marked lightcurve |
|---|---|---|---|---|---|---|---|
| A | 11179 | 8854 | 0 | 0 | 0.00% | 0.00% | 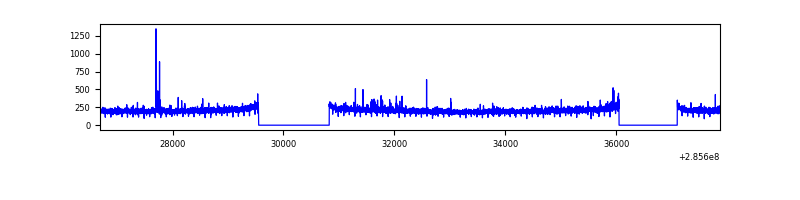 |
| B | 11179 | 8854 | 0 | 0 | 0.00% | 0.00% | 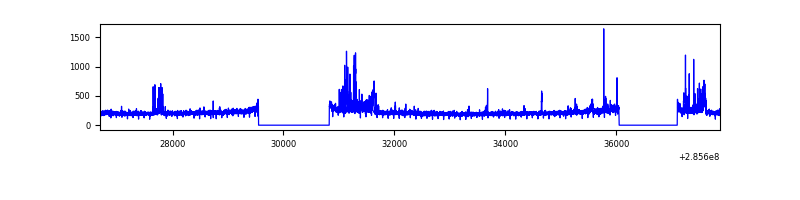 |
| C | 11179 | 8854 | 0 | 0 | 0.00% | 0.00% |  |
| D | 11179 | 8854 | 19 | 19 | 0.17% | 0.21% | 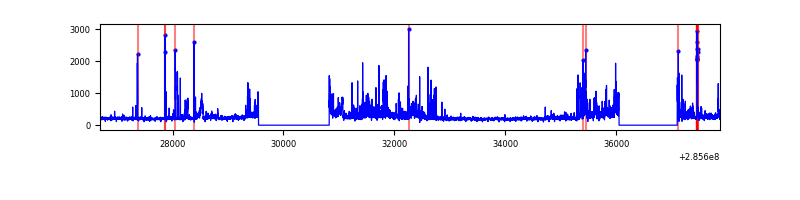 |
Top three noisy pixels from each quadrant. If the there are fewer than three noisy pixels in the level2.evt file, extra rows are filled as -1
| Pixel properties | Quadrant properties | ||||||
|---|---|---|---|---|---|---|---|
| Quadrant | DetID | PixID | Counts | Sigma | Mean | Median | Sigma |
| A | 15 | 174 | 9256 | 84.55 | 468 | 457 | 104.1 |
| A | 13 | 210 | 8665 | 78.87 | 468 | 457 | 104.1 |
| A | 4 | 2 | 4337 | 37.28 | 468 | 457 | 104.1 |
| B | 0 | 189 | 65325 | 704.39 | 481 | 469 | 92.1 |
| B | 0 | 244 | 56662 | 610.31 | 481 | 469 | 92.1 |
| B | 15 | 222 | 21142 | 224.53 | 481 | 469 | 92.1 |
| C | 3 | 233 | 10043 | 86.88 | 464 | 460 | 110.3 |
| C | 5 | 218 | 6976 | 59.07 | 464 | 460 | 110.3 |
| C | 13 | 61 | 2787 | 21.1 | 464 | 460 | 110.3 |
| D | 5 | 222 | 379545 | 3453.64 | 466 | 449 | 109.8 |
| D | 12 | 110 | 133329 | 1210.56 | 466 | 449 | 109.8 |
| D | 2 | 165 | 70926 | 642.06 | 466 | 449 | 109.8 |
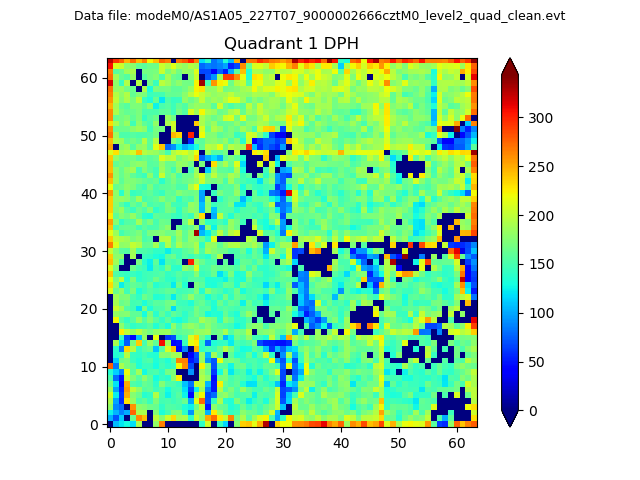
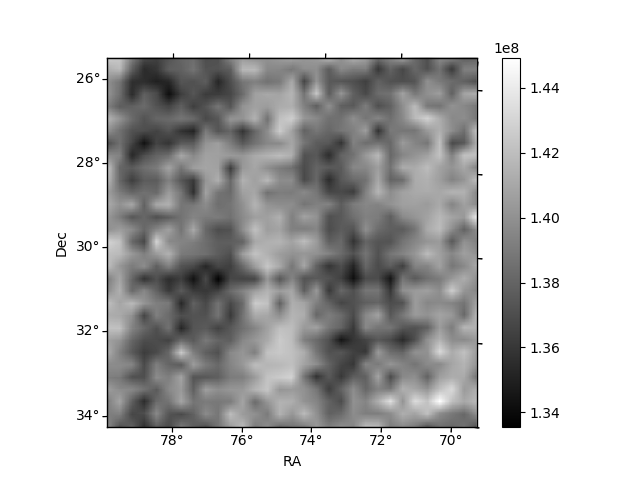
Histogram calculated using DETX and DETY for each event in the final _common_clean file
| Quadrant A | 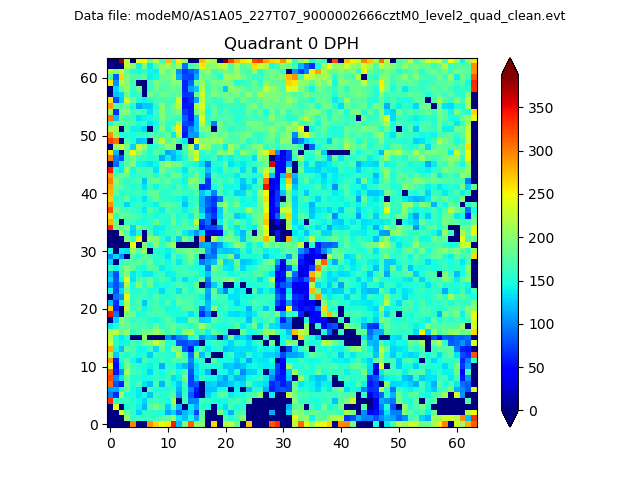 |
 |
Quadrant B |
|---|---|---|---|
| Quadrant D | 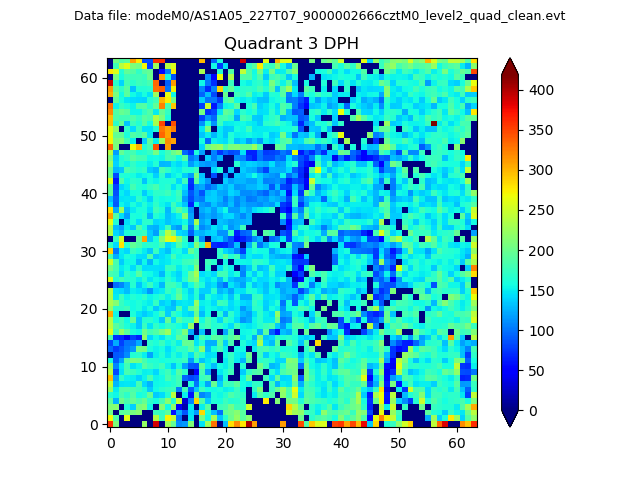 |
 |
Quadrant C |
| Plot type | Count rate plots | Images |
|---|---|---|
| Comparison with Poisson distribution Blue bars denote a histogram of data divided into 1 sec bins. Red curve is a Poisson curve with rate = median count rate of data. |
 |
 |
| Quadrant-wise count rates Data is divided into 100 sec bins |
 |
|
| Module-wise count rates for Quadrant A Data is divided into 100 sec bins |
 |
 |
| Module-wise count rates for Quadrant B Data is divided into 100 sec bins |
 |
 |
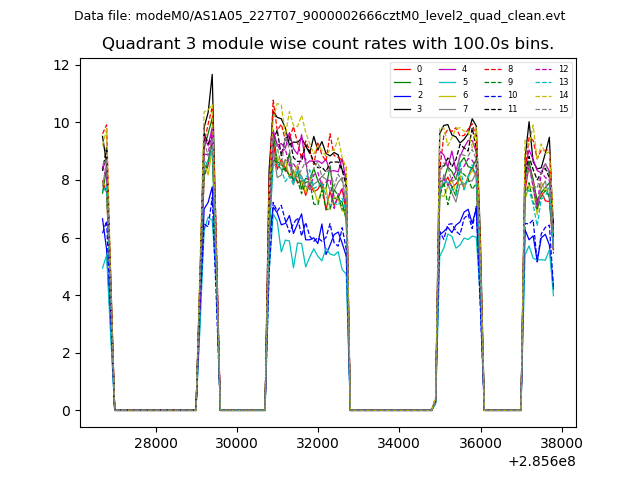
| Module-wise count rates for Quadrant C Data is divided into 100 sec bins |
 |
 |
| Module-wise count rates for Quadrant D Data is divided into 100 sec bins |
 |
 |
| Parameter | Plot |
|---|---|
| CZT HV Monitor |  |
| D_VDD | 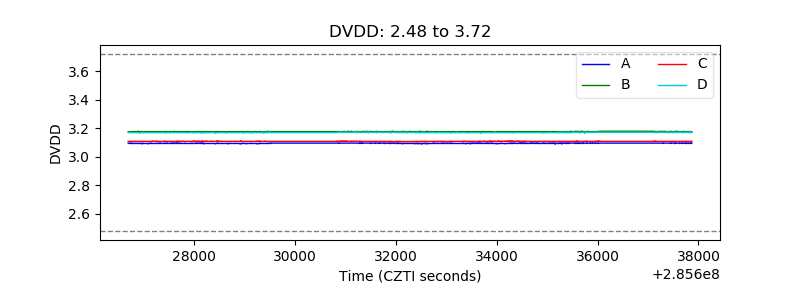 |
| Temperature 1 |  |
| Veto HV Monitor |  |
| Veto LLD | 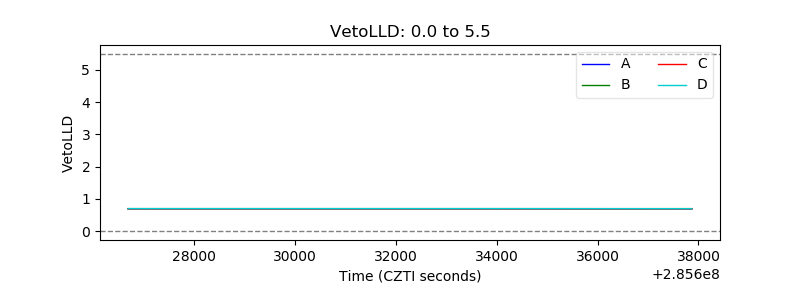 |
| Alpha Counter |  |
| _CPM_Rate |  |
| CZT Counter | 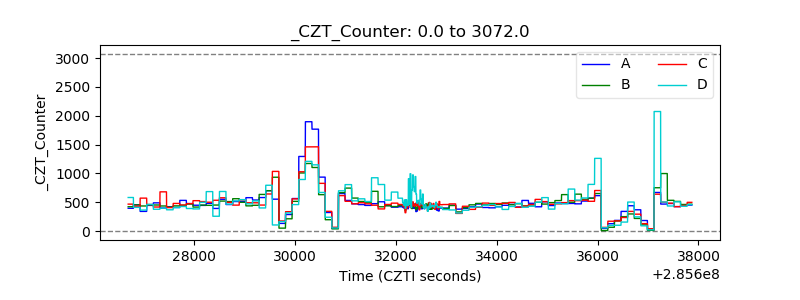 |
| +2.5 Volts monitor | 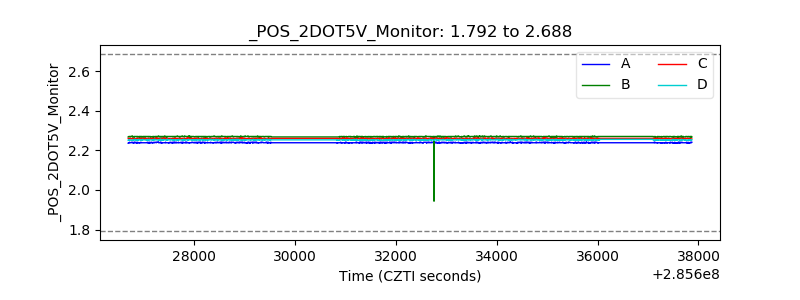 |
| +5 Volts monitor |  |
| _ROLL_ROT |  |
| _Roll_DEC |  |
| _Roll_RA |  |
| Veto Counter |  |