| Param | Original file | Final file |
|---|---|---|
| Filename | modeM0/AS1C04_011T01_9000002664cztM0_level2_bc.evt | modeM0/AS1C04_011T01_9000002664cztM0_level2_quad_clean.evt |
| Size (bytes) | 329,909,760 | 157,412,160 |
| Size | 314.6 MB | 150.1 MB |
| Events in quadrant A | 1,671,329 | 1,074,634 |
| Events in quadrant B | 1,870,745 | 1,111,449 |
| Events in quadrant C | 1,695,583 | 1,075,181 |
| Events in quadrant D | 4,236,536 | 985,627 |
| Mode SS | |||
|---|---|---|---|
| Quadrant | BADHDUFLAG | Total packets | Discarded packets |
| A | 0 | 154 | 0 |
| B | 0 | 154 | 0 |
| C | 0 | 154 | 0 |
| D | 0 | 154 | 0 |
| Mode M0 | |||
|---|---|---|---|
| Quadrant | BADHDUFLAG | Total packets | Discarded packets |
| A | 0 | 15713 | 0 |
| B | 0 | 16508 | 0 |
| C | 0 | 15991 | 0 |
| D | 0 | 25513 | 0 |
| Mode M9 | |||
|---|---|---|---|
| Quadrant | BADHDUFLAG | Total packets | Discarded packets |
| A | 0 | 27 | 0 |
| B | 0 | 27 | 0 |
| C | 0 | 27 | 0 |
| D | 0 | 27 | 0 |
| Quadrant | Total seconds | Saturated seconds | Saturation percentage |
|---|---|---|---|
| A | 7487 | 65 | 0.868171% |
| B | 7487 | 87 | 1.162014% |
| C | 7487 | 141 | 1.883264% |
| D | 7487 | 801 | 10.698544% |
Noise dominated data is calculated using 1-second bins in cleaned event files. If a bin has >2000 counts, and if more than 50% of those come from <1% of pixels, then it is considered to be noise-dominated and hence unusable.
| Quadrant | # 1 sec bins | Bins with >0 counts | Bins with >2000 counts | High rate bins dominated by noise | Noise dominated (total time) | Noise dominated (detector-on time) | Marked lightcurve |
|---|---|---|---|---|---|---|---|
| A | 10177 | 7488 | 0 | 0 | 0.00% | 0.00% |  |
| B | 10177 | 7487 | 1 | 1 | 0.01% | 0.01% |  |
| C | 10177 | 7487 | 0 | 0 | 0.00% | 0.00% |  |
| D | 10177 | 7487 | 218 | 218 | 2.14% | 2.91% |  |
Top three noisy pixels from each quadrant. If the there are fewer than three noisy pixels in the level2.evt file, extra rows are filled as -1
| Pixel properties | Quadrant properties | ||||||
|---|---|---|---|---|---|---|---|
| Quadrant | DetID | PixID | Counts | Sigma | Mean | Median | Sigma |
| A | 15 | 174 | 14652 | 150.1 | 431 | 424 | 94.8 |
| A | 0 | 226 | 2824 | 25.32 | 431 | 424 | 94.8 |
| A | 12 | 194 | 2822 | 25.3 | 431 | 424 | 94.8 |
| B | 0 | 189 | 85770 | 1017.93 | 443 | 433 | 83.8 |
| B | 0 | 219 | 25562 | 299.75 | 443 | 433 | 83.8 |
| B | 7 | 220 | 13080 | 150.86 | 443 | 433 | 83.8 |
| C | 3 | 233 | 23312 | 225.21 | 428 | 426 | 101.6 |
| C | 5 | 218 | 15558 | 148.9 | 428 | 426 | 101.6 |
| C | 9 | 160 | 6455 | 59.33 | 428 | 426 | 101.6 |
| D | 12 | 110 | 1331737 | 13806.88 | 411 | 398 | 96.4 |
| D | 7 | 238 | 638369 | 6616.19 | 411 | 398 | 96.4 |
| D | 5 | 222 | 476004 | 4932.35 | 411 | 398 | 96.4 |
Histogram calculated using DETX and DETY for each event in the final _common_clean file
| Quadrant A | 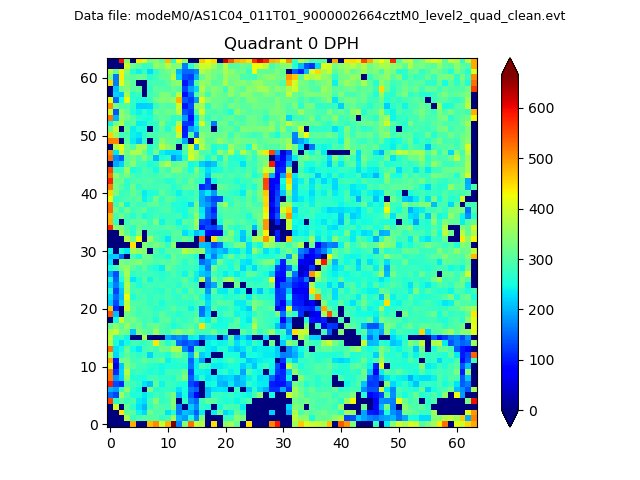 |
 |
Quadrant B |
|---|---|---|---|
| Quadrant D |  |
 |
Quadrant C |
| Plot type | Count rate plots | Images |
|---|---|---|
| Comparison with Poisson distribution Blue bars denote a histogram of data divided into 1 sec bins. Red curve is a Poisson curve with rate = median count rate of data. |
 |
 |
| Quadrant-wise count rates Data is divided into 100 sec bins |
 |
|
| Module-wise count rates for Quadrant A Data is divided into 100 sec bins |
 |
 |
| Module-wise count rates for Quadrant B Data is divided into 100 sec bins |
 |
 |
| Module-wise count rates for Quadrant C Data is divided into 100 sec bins |
 |
 |
| Module-wise count rates for Quadrant D Data is divided into 100 sec bins |
 |
 |
| Parameter | Plot |
|---|---|
| CZT HV Monitor |  |
| D_VDD |  |
| Temperature 1 |  |
| Veto HV Monitor |  |
| Veto LLD |  |
| Alpha Counter | 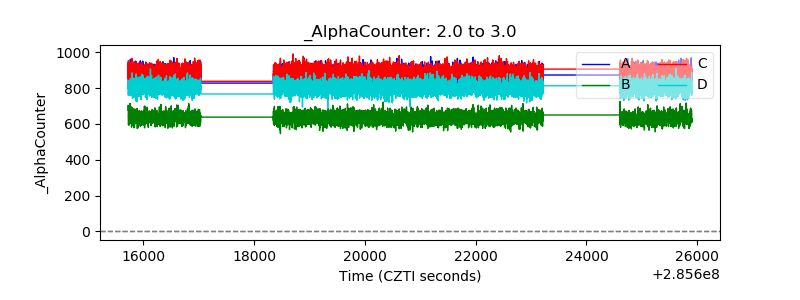 |
| _CPM_Rate |  |
| CZT Counter |  |
| +2.5 Volts monitor |  |
| +5 Volts monitor |  |
| _ROLL_ROT |  |
| _Roll_DEC |  |
| _Roll_RA |  |
| Veto Counter |  |